


Related

Financial Statements
Firms with low price-to-free-cash-flow ratios may represent neglected firms trading at attractive prices.
by John Bajkowski | April 2024

Investors have rediscovered the value of cash generation. Much is written about factors such as sales, earnings, dividends and book value, but it is ultimately a company’s ability to produce cash after paying all its bills that fuels the growth in these factors. Strong cash flow allows a company to increase dividends, develop new products, enter new markets, pay off liabilities and buy back shares.
Cash flow has the added benefit of clear-cut comparisons across companies, industries and time. For example, price-to-sales (P/S) ratio screens do not work well across different industries. Screening for companies with low multiples of price to sales requires further examination of the ability to convert revenue into bottom-line profits.
How should “cash generation” be analyzed?
Fortunately, companies are required to provide a statement of cash flow along with the income statement and balance sheet. There are few ways companies can present the cash flow statement, but ultimately it identifies activities that affected cash flow during an accounting period. The statement divides company uses and sources of cash into three primary segments—operating, investing and financing cash flows.
The operating cash flow segment measures a company’s ability to generate cash from day-to-day operations as it provides goods and services to its customers. It considers factors such as cash from the collection of accounts receivable, the cash incurred to produce any goods or services, payments made to suppliers, labor costs, taxes and interest payments. A positive cash flow from operations indicates that a firm was able to generate enough cash without the need for additional funds.
The investing segment of the cash flow statement identifies the firm’s investment in its long-term capital. The investing segment notes the purchases of property, plant and equipment; investment or sale of marketable securities; and investments or divestitures in unconsolidated subsidiaries. Negative cash flow from investing activities shows that the company made investments in its own long-term assets or outside investments. A positive cash flow from investing activities typically points to a divestiture or sale of the long-term assets of the firm.
The financial segment of the cash flow statement reveals how the company has financed its endeavors and if it has rewarded its shareholders through dividend payments. Items such as cash proceeds from the issuance of new shares of stock or debt, payment of dividends to stockholders and the cash used to repurchase stock or retire debt are summarized by the financing segment.
Combined, the three segments reveal the net inflow or outflow of cash for the company over a period of time. We have found, however, that it is better for investors to focus on a few critical sections of the cash flow statement when identifying potential investments.
Cash flow from operations is a close counterpoint to the income statement and represents a good starting point for company analysis. Its analytical value can be improved when elements such as the investment required to sustain the company and dividend payments expected by shareholders are considered. A growing company must invest to maintain its operations and expand. This is captured in the investing segment of the cash flow statement, while cash dividend payments are disclosed in the financial segment.
Free cash flow is calculated by subtracting capital expenditures (capex) and dividend payments from cash flow from operations. It is often divided by the number of shares to allow direct comparison to share price.
Share price divided by free cash flow per share has become a common multiple, such as the price-earnings (P/E) ratio or the price-to-sales ratio. A screen for positive and consistent free cash flow is a good starting point for the investor seeking firms performing well on a cash flow basis.
The stock screening universe starts by requiring stocks to be exchange-listed with a minimum market capitalization of $50 million. This helps to ensure a minimum level of trading liquidity. We also screen out financial firms as their usage of and investment in financial assets is not comparable to other types of companies.
The screen requires positive free cash flow for each of the last five fiscal years and the most recent 12 months. Ideally, a company would always have positive and increasing free cash flow.
Higher free cash flows should translate into higher stock prices. The ratio of stock price to free cash flow per share is a way to judge value. Comparing a company’s price-to-free-cash-flow (P/FCF) ratio to those of other companies, industry norms and historical averages provides some understanding of relative value, much like the traditional price-earnings ratio. Firms with low price-to-free-cash-flow ratios may represent neglected firms trading at attractive prices.
The screen requires a company to have a current price-to-free-cash-flow ratio that is lower than the median value for its industry as well as lower than the company’s five-year average. We then look for the 30 stocks with the lowest price-to-free-cash-flow ratio as the final filter. The list of passing companies using data as of March 13 is presented in Table 1. For the most current list of passng companies, go to Price-to-Free-Cash-Flow Screen.
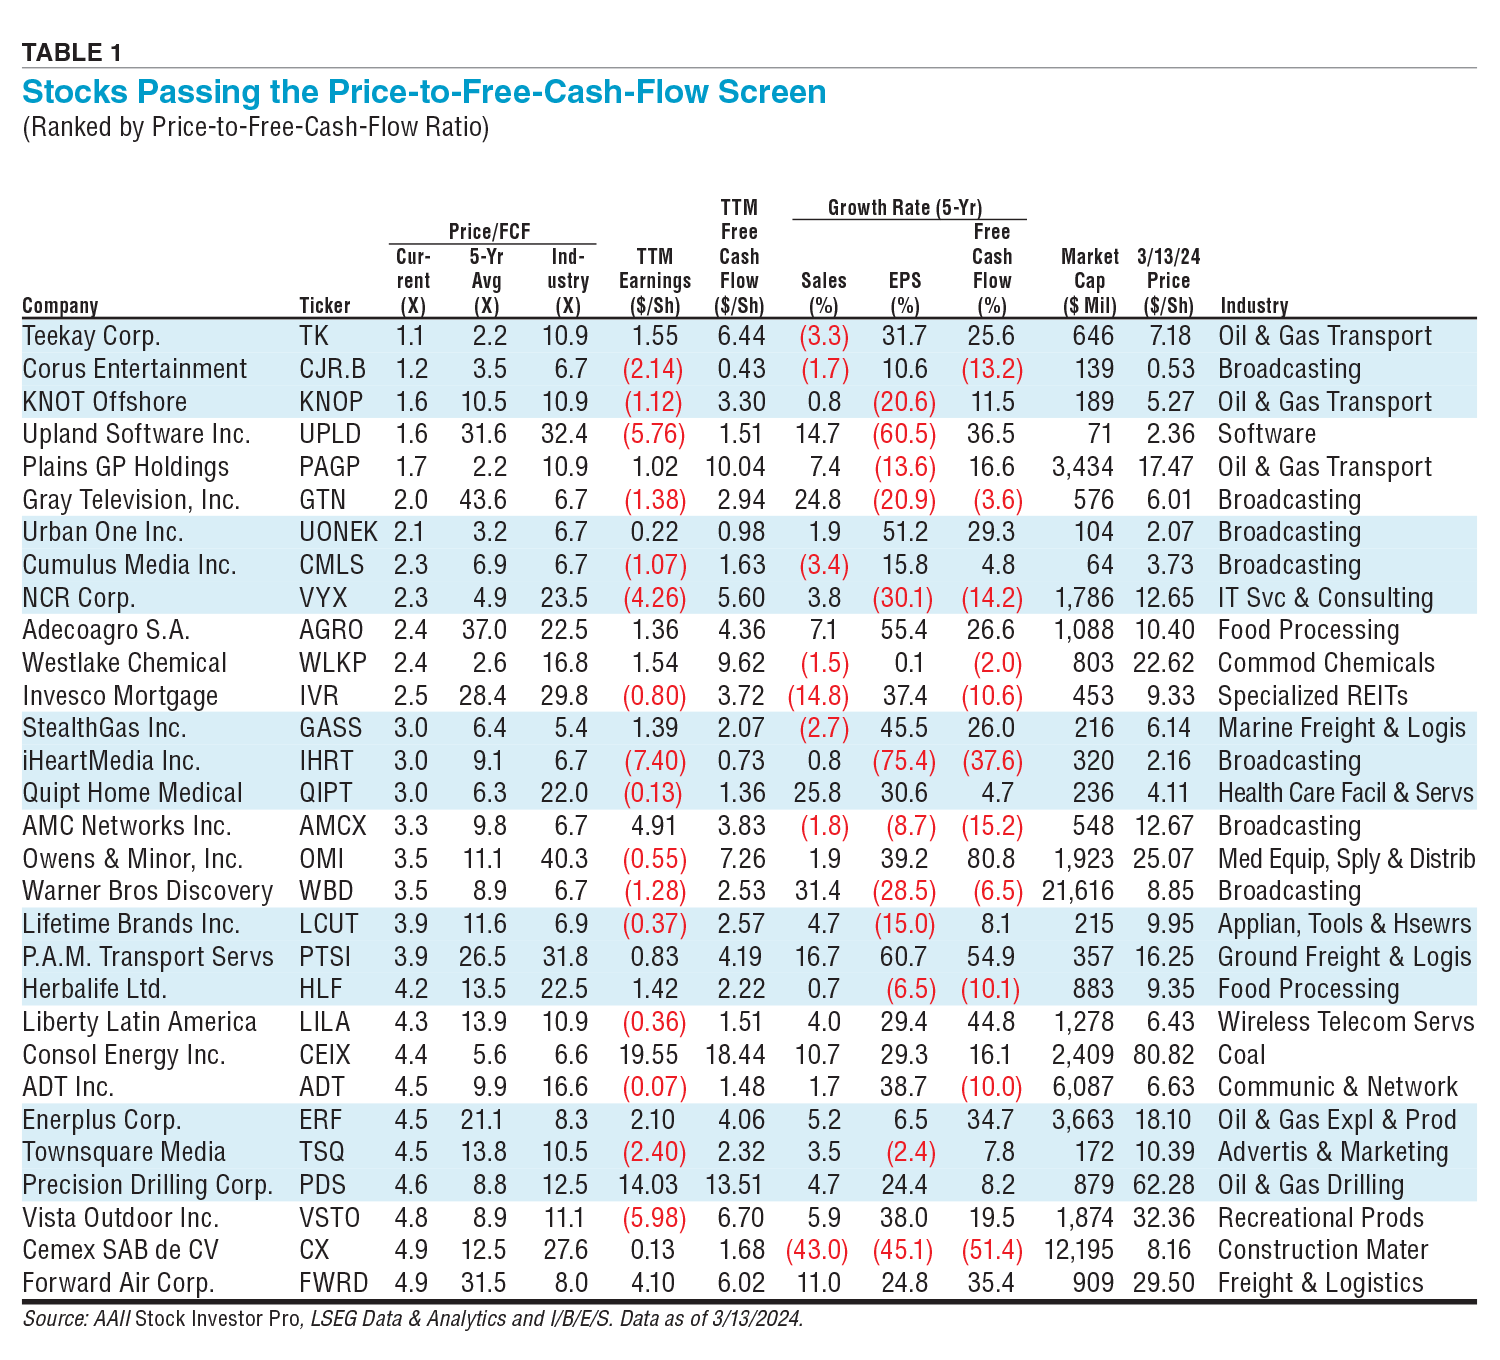
Oil and gas transportation stock Teekay Corp.  (TK) has the lowest current price-to-free-cash-flow ratio of the passing companies at 1.1. This ratio is half of the company’s five-year average of 2.2 and well below the industry median of 10.9. The company earned $6.44 in free cash flow per share over the last 12 months, well above the earnings per share figure of $1.55. Sales have contracted over the last five years at a 3.3% annual rate, while earnings per share have expanded by 31.7% and free cash flow per share has grown at a 25.6% annual rate over the same period. Teekay is a smaller company as reflected in its market cap of $646 million (stock price multiplied by shares outstanding).
Freight and logistics company Forward Air Corp. (FWRD) has the highest price-to-free-cash-flow ratio of the passing companies. Its ratio of 4.9 is well below the company’s five-year average of 31.5. The company traded at price levels around four times its current price from 2021 through 2023, which elevated its historical average ratio. The company earned $6.02 in free cash flow per share over the last 12 months, above the earnings per share figure of $4.10. Sales have increased over the last five years at an 11.0% average annual growth rate, while earnings per share have expanded by 24.8% and free cash flow per share has grown at a 35.4% annual rate over the same period. Analysts are expecting earnings to be weak this year with a consensus estimate of $0.60 per share before slightly bouncing back to $1.82 per share in 2025. Expectations have weakened for the company, which is reflected in the low price-to-free-cash-flow ratio relative to the company’s historical average and industry median.
It is important to keep in mind that cyclical firms often trade with low ratios during the late stage of an economic expansion. This occurs when the market expects the economy to slow down and factors such as cash flow and earnings to decrease. Stocks would only be bargains if you felt that the market has incorrectly forecast the occurrence or severity of a slowdown.
Stock Investor Pro, AAII’s fundamental stock screening and research database, includes this free cash flow screen among its preprogrammed screens. All AAII members can access the screen and the passing companies on AAII.com.
Figure 1 shows the performance of the price-to-free-cash-flow screen. The long-term performance of the screen, assuming monthly rebalancing, has been strong—up 16.6% annually since inception in 1998, compared to a price change of 6.3% annually for the S&P 500 index for the same period. The screen, however, has been 86% more volatile than the S&P 500, as captured by the risk index of 1.86. The volatility reduces the risk-adjusted return to 13.1%, indicating that even with the extra volatility the performance compares favorably.
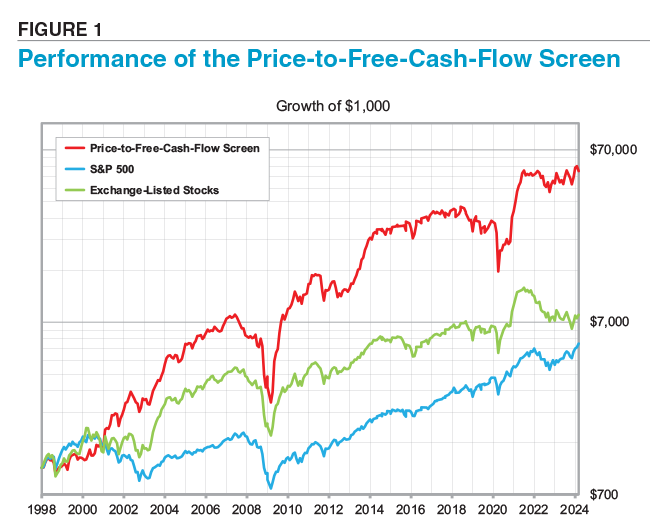

Like most approaches, the strategy has not outperformed the market in all stages of the market cycle. An examination of the year-by-year returns reveals how strongly the performance can vary over time.
The characteristics of the stocks passing the price-to-free-cash-flow screen are presented in Table 2.
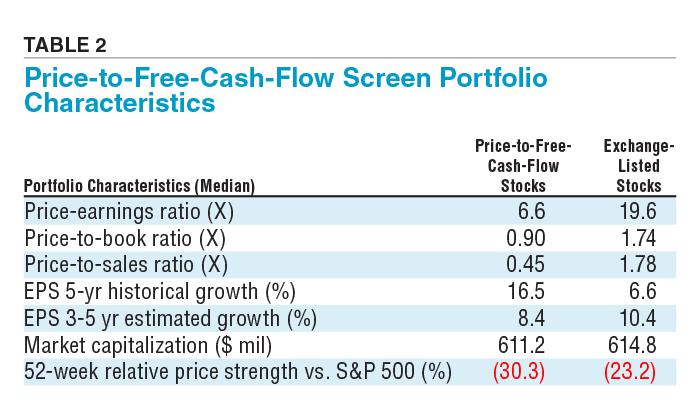
The price-to-free-cash-flow screen is a value-oriented approach; this is reflected in the significantly lower median price-earnings multiple for the passing companies than the typical exchange-listed stock (6.6 versus 19.6). It is interesting that, while all of the passing companies have positive free cash flow, only 14 have positive earnings. The value orientation is confirmed in the low median price-to-book ratio for the current group of passing companies (0.90), which is lower than the median for all exchange-listed stocks (1.74).
The passing companies have exhibited higher historical earnings growth (16.5%) compared to the median for all exchange-listed stocks (6.6%). However, the median expected annual earnings growth rate over the next three to five years is lower for the passing companies than the typical exchange-listed stock (8.4% versus 10.4%).
The median market cap for the passing companies is $611.2 million compared to $614.8 million for all exchange-listed firms. Broadcasting company Warner Bros Discovery Inc. (WBD) is the behemoth of the group with a market cap of $21.6 billion. In contrast, Cumulus Media Inc. (CMLS), also a broadcasting company, just clears the screen’s $50 million market-cap hurdle at $64 million.
The 52-week relative price strength index highlights the underperformance of these stocks as a group compared to the S&P 500 over the year. The passing companies have underperformed the S&P 500 by a median value of 30.3%, compared to the 23.2% median underperformance for all exchange-listed stocks.
The analysis of a company’s cash flow is a very revealing study of a firm. The free cash flow measure highlights the effectiveness (or lack thereof) of company operations, including factors such as sales, inventory control, production and employee costs, accounts receivable management, interest payment levels, product development and capex.
Screening for firms with attractive levels of price to free cash flow is a useful technique to highlight more value stocks worthy of further study.
Financial Statements

Stock Strategies

Richard M from MI posted over 2 years ago:
JOHN L from NJ posted over 2 years ago:
You need to log in as a registered AAII user before commenting.
Log InCreate an account