

Related

ETFs and Mutual Funds
Combining small-cap value and the S&P 500 can provide higher returns and a less painful ride over the long term.

Paul Merriman leads a class in AAII's new Essential Investing Video Course. Go to https://www.aaii.com/ves for more information and to subscribe.
Most serious students of investing are aware of two important things:
This leads to an interesting question: Why, if small-cap value stocks are so much better, don’t investors put more of their money into them?
The short answer, also well-known, is that small-cap value stocks have a history of dishing up more pain in the form of volatility and short-term losses than large caps. (Throughout this discussion I refer to small-cap value stocks as an asset class category, not as individual stocks.)
But what if that pain could be significantly reduced, without ditching the benefits to be had from small-cap value stocks? If that possibility interests you, then the following will be worth your time.
There’s good news and bad news. The bad news is that I can’t offer you any new “magic bullet” that gets rid of all the pain while keeping all the gain.
The good news is that what I’m about to outline is credible and reliable. Plus, I’m not inclined to overpromise. Therefore, I have used deliberately conservative projections in order to make my case.
I suppose the other piece of bad news is that short-term investors can’t rely on higher returns from small-cap value stocks. If you’re after an advantage you can count on this year, or next year, or even over the next 10 years, this won’t do it.
However, over a long period of accumulation, small-cap value stocks are likely to bring higher returns—and more money in your portfolio when you retire. Furthermore, during your retirement, this asset class category can provide you with more money to spend and more to leave to your heirs.
In this article, I intend to show you four things:
Small-cap value stocks occupy what you could think of as one corner of the stock-market style box you’ll find at Morningstar and other financial websites. At the top of these style boxes are large-cap stocks and at the bottom are small-cap stocks. At the right are growth stocks, while at the left are value stocks.
Relatively few investors are comfortable owning nothing but small-cap value stocks. But when this asset class is held together with the S&P 500, it can act like a turbo-booster.
This asset class combines the benefits of owning small-cap stocks—representing companies with the potential for exponential growth—and value stocks—which are available at bargain prices for one reason or another.
Since 1928, small-cap value stocks have been the undisputed champions of the stock market, at least for long-term investors. Using extremely long-term numbers and assuming that dividends and capital gains were reinvested, a $100 investment in 1928 would have grown to $917,319 in the S&P 500 by the end of 2021. Invested in small-cap value stocks, that initial $100 would have grown to $13,233,052.
Through 2021, small-cap value stocks had 65 profitable years. In 45 of those years, small-cap value gained more than 20%. In 19 of those years, they gained more than 40%.
That’s the gain side. The pain side seems daunting at first. In the four years from 1929 through 1932, the S&P 500 lost 64.8% of its value; small-cap value stocks were down 85.8%. Over the whole period of 1928 through 2021, small-cap value stocks lost money in about one of every three years. The other calendar years ended up with positive returns. Plus, on average, returns from the positive years were twice as good as the returns from negative years were bad.
One year at a time isn’t the best way to look at investment returns. My focus in this discussion is on long-term performance. Let’s consider 40-year periods.
From 1928 through 2021, there were 55 such periods. In the average 40-year period, small-cap value stocks had a compound annual growth rate (CAGR) of more than 16%. The very worst 40-year period started in 1929 and still produced a CAGR of 11.6%.
That worst-case scenario for small-cap value was noticeably better than the average 40-year return of the S&P 500 (11.0%).
And since we’re on the subject, the worst 40-year period for the 50%/50% equity combination I’m suggesting (equal parts S&P 500 and small-cap value) was 13.8%.
How about 15-year periods? For small-cap value stocks, only five of all 15-year periods had CAGRs under 10%. The best was a CAGR of 26.4%. The worst was a CAGR of –1.6%.
What can small-cap value stocks do for somebody accumulating assets? Imagine the following scenario.
Think of twins, a brother and sister named Roger and Sheila. Through their lives they stay in close touch and remain friends.
When they are 25, they both begin setting aside money in Roth IRAs. Each contributes $6,000 every year for 40 years, and each maintains a 70%/30% allocation of stocks and bonds.
Roger’s equities are all in the S&P 500. That’s what he’s comfortable with, and he is confident that he’ll do fine over the long run.
Sheila is a bit more adventurous. She splits her equities 50%/50% between the S&P 500 and small-cap value stocks.
Over the years, they invest identical amounts: a total of $240,000. Once in a while they compare notes. After a period of time, Roger notices that his sister’s account is noticeably larger than his.
Now of course you want to see the numbers. This imaginary comparison is hypothetical, and that gives me license to tweak the numbers and make them more conservative.
Since 1970, the long-term CAGR of a 70%/30% portfolio with all equities in the S&P 500 (Roger’s portfolio) was 10.1%. For the same 70%/30% allocation, with equities split between the S&P 500 and small-cap value (Sheila’s portfolio) the CAGR was 11.3%.
However, it’s possible that those returns are unrealistically high to project into the future. Therefore, for the sake of the following comparison I decided to knock two percentage points off each compounded return.
I assumed that Roger’s return during the 40 years of his accumulation stage was 8.1%, while his sister Sheila had a CAGR of 9.3%.
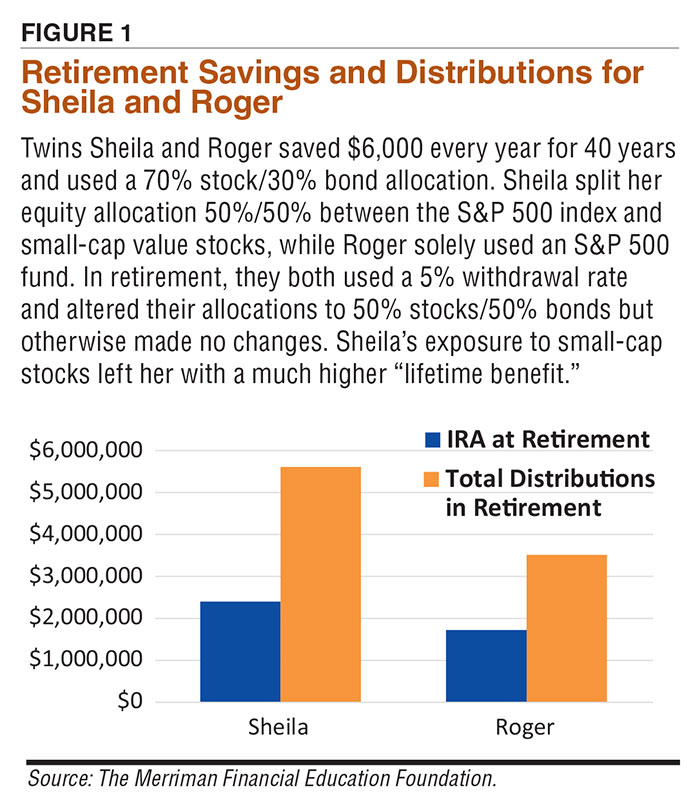
That might not seem like a dramatic difference. But after 40 years, Sheila could retire with an IRA worth $2,401,748; Roger’s would be worth $1,725,102 (Figure 1).
At age 65, Sheila had $676,646 more than Roger—about 39% more. That is more than twice as much as all the money they each contributed over the years.
All that extra money, by the way, was the result of making only one simple change in 35% of Sheila’s overall portfolio. The bonds were the same in both portfolios, and both invested in the S&P 500.
Next, I imagined that these twins, Roger and Sheila, each lived (happily, I hoped) in retirement for 30 years.
In this part of the scenario, I assumed they pulled back on their equity allocations. Each maintained a comfortable 50%/50% split between equities and bonds. I also assumed that every year they each withdrew 5% of their portfolios’ value.
Leaving all his equity allocation in the S&P 500, Roger attained a retirement CAGR of 7.4%. (Again, that is two percentage points below the post-1970 track record of such a portfolio). The comparable CAGR for Sheila was 8.3%.
Over 30 years, this produced total distributions of $3,515,693 for Roger, which was certainly a very gratifying return on the $240,000 he had invested. Sheila had nearly 40% more to spend: $5,607,952. (I’m hoping that when they went out to dinner, she graciously offered to pick up the check.)
At the end of 30 years of retirement, Roger’s IRA would be worth $3,152,474; Sheila’s would be worth $5,637,537.
Sheila, who over a very long period kept half her equities in small-cap value stocks, ended up with a “total lifetime benefit” (retirement withdrawals plus what was left to heirs) of $11,245,488. Her more conservative brother still did very well from his $240,000 savings. Roger’s total lifetime benefit was $6,668,167.
Ultimately, Shelia’s portfolio produced $4.5 million more than her brother’s portfolio. That difference had only one cause: the way she allocated half of her equities.
Of course, these ultimate results could not have been known when Roger and Sheila began saving for retirement.
Roger was skittish about small-cap value; his twin sister was willing to take the extra risk. So you would probably expect that she had a bumpier ride along the way, right?
Well, maybe. But maybe not.
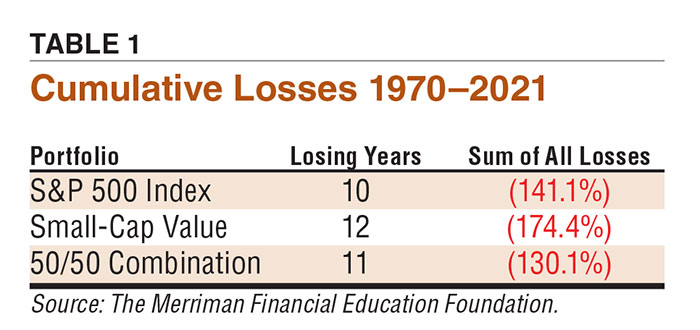
One way to measure the “pain” of any investment is to look at the returns in money-losing years. Over a period of time, those cumulative losses add up, even though the losses are likely to be recouped by investors who stay in the game.
Table 1 shows a surprising picture, based on market returns over 52 calendar years.
As expected, small-cap value stocks had more losing years than the S&P 500, and larger total losses. But putting small-cap value and the S&P 500 together resulted in lower total losses than each one individually.
This should not be a total surprise. It’s a fortunate result of diversification.
In the real world, this lower cumulative risk would probably never be noticed. Most investors would rather do just about anything other than add up all the money they’ve lost over the years. But statistically, those figures show that the combination of small-cap value and the S&P 500 provided a less painful ride than either category alone.
I think at this point that I’ve made my case. I believe most readers of this article have at least 15 years of investing ahead of them, including their retirement years.
If you fall into this category and your equity portfolio is dominated by the S&P 500, I think you will likely benefit over the long term by using small-cap value stocks as a booster.
One of the coolest tools to come to the aid of investors in recent years is in the category of online calculators. If you know where to look on the web, you may be able to finally stash that battery-powered financial calculator in the same dusty drawer that holds your slide rule and your PalmPilot.
With the help of a talented volunteer, Craig Appl, the Merriman Financial Education Foundation has created a calculator that allows you to slice and dice the past 52 years of investment results into literally millions of combinations.
With this free Lifetime Investment Calculator, you can “try out” almost unlimited variations of 12 equity strategies we suggest (in addition to the S&P 500 index by itself) and see how they would have performed year by year since 1970. You choose the strategy, the number of years and the contributions and/or distributions you want to assume. You set the starting year, the initial investment and the time period you want to measure.
It’s a fascinating tool and not hard to use. One interesting feature lets you try out a scenario with different starting years. Imagine, for example, an initial one-time investment of $10,000 in the U.S. four-fund strategy, without any bonds and without any additions or subtractions. How would that have performed if left alone for 20 years?
If you were lucky enough to start in 1975, after 20 years you’d have $1,007,473. But had you started 15 years later, in 1990, your portfolio would have grown to only $284,068 in 20 years. The only change: the timing. The lesson is that the sequence of returns has a huge effect on ultimate investment performance.
Unfortunately, this calculator is limited to revealing returns from the past. Still, if you’re curious enough, this tool has many fascinating lessons to teach.
I always get (and welcome) feedback and questions from investors. The following is a question I wouldn’t be surprised to receive.
I have been following your writing for many years, Mr. Merriman, and with all respect, I’m confused by your complete about-face. Year after year, you told us that we needed to have 10 stock asset classes; you called it the Ultimate Buy and Hold Strategy. Now you’re advocating just two of those asset classes, implying this is all we need.
Are you admitting that you were wrong for all those years? Or is there something bad you’re not telling us about the eight asset classes that you’re leaving out?
My response would be that this is a very good question, and I’m glad you brought it up. First of all, I had to chuckle at your suggestion that I’m trying to hide something about eight asset classes. My goal is always just the opposite, to provide lots of information that’s reliable and transparent.
You are right that for many years I have advocated the Ultimate Buy and Hold Strategy, which relies on 10 asset classes. I update that recommendation every year with current data. (See https://paulmerriman.com/ultimate-buy-and-hold-strategy.)
I still believe this 10-fund strategy is the “ultimate” way to diversify a long-term investment portfolio. And this approach is the basis for the way that the majority of my own portfolio is invested.
But, regardless of however good it is, the Ultimate Buy and Hold Strategy is difficult to implement and maintain. You can’t get it in any single fund. Plus, rebalancing 10 funds isn’t something most investors would do.
Many people are interested in reading about this strategy. But I have met very few who told me they are actually putting it into practice.
A few years ago, Chris Pedersen joined our team at The Merriman Financial Education Foundation. He loved the Ultimate Buy and Hold Strategy and decided to see if he could find a way to capture its benefits using only a few funds.
His solution led to a book that Richard Buck and I wrote: “We’re Talking Millions! 12 Simple Ways to Supercharge Your Retirement” (The Merriman Financial Education Foundation, 2020). Chris also described his research in depth in his book, “2 Funds for Life” (The Merriman Financial Education Foundation, 2021). What I’m proposing in this article is similar to what we advocate in that book.
To sum it up, I’m pleased that you’ve been following my work. I haven’t changed my recommendations. What I have done is found a much easier way to put small-cap value stocks to work.
When you combine the S&P 500 and small-cap value, you’re of course not limited to a 50/50 split. That’s only one of nine combinations ranging from 10% small-cap value/90% S&P 500 to 90% small-cap value/10% S&P 500. For every additional 10% of the equity portfolio that you shift from the S&P 500 to small-cap value, you gain an additional 0.2 to 0.4 percentage points of long-term return. Even shifting 20% of your equities from the S&P 500 to small-cap value could make a big difference in the long term.
Here’s another question I have been asked: Do you think small-cap value stocks are likely to retain their premium in the future?
Everything I have learned from the best academic research indicates that small-cap value stocks can be expected to keep outperforming large-cap growth stocks. The reasons for this haven’t changed.
So, yes, I’m confident that small-cap value stocks will do better than large-cap growth stocks, which dominate the S&P 500. How much better? It’s impossible to know.
Over the past 94 years, the average 40-year period showed small-cap value stocks with a premium of more than five percentage points. This premium was “discovered” about half a century ago, and since 1970, the average 40-year premium for small-cap value stocks has been only about three percentage points.
Personally, I like to err on the side of being conservative. Accordingly, I have set my own expectations on a future premium of two percentage points. But that’s only an educated guess. Even if the long-term premium turns out to be only 1%, that’s enough to make an enormous difference over a lifetime.
ETFs and Mutual Funds

Portfolio Strategies

AAII Model Portfolios

Sneha J from IND posted over 4 years ago:
Paul M from FL posted over 4 years ago:
ROBERT A from NC posted over 4 years ago:
JIM L from MI posted over 4 years ago:
TOM E from CA posted over 3 years ago:
You need to log in as a registered AAII user before commenting.
Log InCreate an account