


Related

AAII Stock Ideas
The key valuation measurements of low price to earnings, low price to book value and high dividend yield are used to find stocks that have long-term value.

Value investing aims to find stocks that are “cheap” relative to their potential. Too often investors buy popular and overpriced stocks with the possibility for future growth. Many value-based strategies of the past try to overcome the trap of overpaying for stocks by investing in stocks that are undervalued. As it turns out, using the most basic valuation metrics can be extremely useful for capturing long-term performance. In this article, we discuss a new screening strategy based on the long-term value strategies used by fund manager Jim Cullen.
Jim Cullen founded Schafer Cullen Capital Management in 1983 and specializes in low price-earnings research. With over 50 years of investing experience, he serves as CEO of the firm and is a comanager of the Cullen Value Fund  (CVLEX). Cullen uses a low valuation strategy to find companies that deliver long-term capital appreciation with significantly less volatility. Based on his book, “The Case for Long-Term Value Investing” (Harriman House, 2022), AAII developed a screening strategy that looks for companies with the potential for long-term outperformance. The approach seeks companies with low valuations relative to the market and with high dividend yields. Cullen’s research suggests that these types of companies will have better performance over three- to five-year time spans than most other U.S.-listed stocks.
Cullen’s long-term value strategy builds upon the roots of value-based investing outlined by Benjamin Graham. Graham, known to some as the father of value investing, found that focusing on three fundamental data points was the key to investing in the long term. First, the price-earnings (P/E) ratio must be low relative to the overall market. Second, the price-to-book-value (P/B) ratio must also be relatively low compared to the market. Third, a company must have an outstanding track record of dividend payments. Companies with these fundamentals have outperformed others over the long term.
In Cullen’s book, he analyzed S&P 500 index stocks ranking in the bottom 20% by price-earnings ratio and price-to-book ratio, as well as the top 20% in terms of dividend yield. The annual performance of stocks in each of these three categories were found to perform better than the S&P 500 in most years since 1968. From 1968 to 2020, the average annualized total performances of stocks from these three categories were all higher than the average annual S&P 500 performance. Going further, the five-year performance of stocks in the bottom 20% for price-earnings ratio only realized one period of negative performance (1969–1973).
In developing AAII’s interpretation of this strategy, the primary criteria for our screening universe include all three of the previously mentioned factors. Rather than focusing on specific indexes, all U.S. exchange-listed stocks were included. [Excluded were companies traded on the over-the-counter (OTC) market and American depositary receipts (ADRs), securities that represent stock of a foreign company and that trade on U.S. exchanges.]
However, an attractive valuation is not enough. There are important financial leverage factors to consider when looking at stocks with low valuations. This helps with identifying companies that are capable of higher performance when the market takes a downward turn, since they can cover their obligations over the short term and long term.
In creating a screen based on Cullen’s strategy, we considered both his valuation criteria as well as his suggested metrics for analyzing a company’s underlying financial strength.
The price-earnings ratio is the cornerstone of many value-based strategies. It measures a company’s stock price relative to its earnings per share over the past 12 months. The price-earnings ratio is commonly used because it allows investors to compare a company’s valuation to the overall market. As previously stated, stocks with a low price-earnings ratio relative to the rest of the market have tended to realize better performance over the long term.
Cullen recommends screening for stocks that are trading with price-earnings ratios that are at a 20% to 50% discount to the overall market. It’s crucial to understand that for any value-based strategy a relative price-earnings ratio often works better than an absolute limit. Since the overall market’s price-earnings ratio fluctuates, the relative price-earnings criterion finds companies that are potentially undervalued in the prevailing environment.
Though the price-to-book ratio has come under criticism in more recent years, Cullen’s research suggests it is still a useful measure of valuation. Book value is defined as a company’s assets minus its liabilities as reported on the balance sheet.
It can be difficult to accurately evaluate the asset value of some companies. For example, the balance sheet for a company with a well-known brand or significant intellectual property may understate the company’s total asset value relative to a materials company with physical inventory. Furthermore, the reported value of a company’s assets may differ from their market value due to accounting principles. Thus, book value isn’t always reliable for analyzing some companies.
Generally speaking, price-to-book ratios are more useful when comparing companies of the same type. Median price-to-book ratios can be widely different across industries and sectors.
Cullen states in his book that for certain sectors, book value (and the price-to-book ratio) is a more reliable measure of a stock’s value than the price-earnings ratio. Specific examples include cyclical companies like airlines, metals, energy and commodity stocks. On the other hand, technology, health care and consumer sectors all have larger ranges and generally much higher median price-to-book ratios than other sectors. If we stick to comparing company price-to-book ratios within their respective sectors, then we can identify stocks that are potentially undervalued relative to their peers. For our screen, a company must have a price-to-book ratio less than or equal to the median price-to-book ratio for its sector.
Dividends are an important part of the strategy for multiple reasons. A dividend is a steady source of income and adds return. In addition, one of the most basic and effective protections against inflation is generating dividend income from your portfolio. The Cullen strategy aims to find companies with strong financials to carry them through any market downtrends. Usually, companies that pay dividends have the financial strength to do so. They are also loath to cut or suspend their dividends when the economy takes a turn for the worse.
The screen we developed looks for stocks of companies with dividend yields in the top 25% of the stock universe. Cullen specifically looks for stocks that pay an annual dividend of 3% or more per share. However, we found this to be more restrictive than seeking out companies that pay high dividends relative to the overall universe of exchange-traded stocks.
Even though dividend-paying companies are good for a portfolio, Cullen also looks for companies that grow their dividends. Growing dividends can increase returns over time by boosting the income investors receive relative to the purchase price of stock. Our screen does not specifically look for companies with growing dividends, but it is something to consider when adding stocks to a portfolio.
Because some companies are cheap for a reason, value-based investors must determine if companies are financially stable enough to withstand economic downturns. The long-term debt-to-equity ratio evaluates a company’s leverage by dividing its amount of long-term debt by shareholder’s equity. Shareholder’s equity is total assets minus total liabilities and both preferred and redeemable preferred stock.
Typically, companies with higher debt ratios, or higher leverage, struggle when the economy takes a turn for the worse. By analyzing company leverage, we get a sense of how reliant a company is on debt financing. For the Cullen approach, he suggests companies with long-term debt-to-equity ratios of 50% or less.
The times interest earned (TIE) ratio is equally as important to consider as leverage. No matter how much debt a company has, it must be able to make interest payments even if it is struggling. This ratio is a measure of how many times earnings covers the annual interest expense; it is sometimes known as the interest coverage ratio. It is calculated by dividing a company’s earnings before interest and taxes (EBIT) by its interest expense.
For example, a company with annual interest payments of $100 that earns $300 before it pays interest or taxes has a times interest earned ratio of 3.0. A high times interest earned ratio indicates that the company has more financial flexibility and can potentially use its income to grow the business.
The Cullen approach screens for companies with times interest earned ratios of 3.0 or higher. This means the company is generating three times as much earnings as is needed to pay off its debt.
One thing to consider when using times interest earned in a screen is when earnings turn negative for a company. During a recession or bear market, companies may announce negative earnings, or their net income is negative for that period. Also, earnings may be lower relative to prior periods. Thus, a declining period in the market may result in fewer companies passing this screen.
The current ratio is also useful in determining the financial strength of a company. Sometimes referred to as the working capital ratio, it measures the short-term liquidity of a company. Calculated by dividing current assets by current liabilities, the current ratio tells us the capabilities of a company to pay any debts, payables or expenses incurred over the short term, meaning within the last 12 months. The Cullen strategy identifies companies that have the ability to cover not only their long-term debt but their short-term obligations as well.
Cullen suggests screening for companies with a current ratio of at least 2.0. This means that a company’s current assets—such as cash, accounts receivable and inventories—are double that of its current liabilities. Examples of current liabilities include accounts payable and short-term debt (debt to be paid off within a year).
The current ratio can be misleading in certain situations. One would be if the company is holding a large amount of inventory that it cannot sell. Since the reported value of the inventory on the balance sheet would be higher than its current value, the current ratio would also be overstated. This specific situation makes it important to understand where the company is in its business and product cycle as well as to look out for any potential write-downs.
 Jim Cullen seeks investment in stocks of companies with low price-earnings ratios relative to the market and price-to-book ratios less than their respective sector medians. Cullen used Benjamin Graham’s three key valuation measurements of low price to earnings, low price to book value and high dividend yield to find stocks with long-term value. After conducting research over many decades of market data, he found that these types of stocks performed better than the S&P 500 index in most years and over long periods of time.
The approach looks at all U.S. exchange-listed stocks, excluding over-the-counter (OTC) stocks and ADR/ADS stocks.
Criteria for Initial Consideration
Screening Tips/Secondary Factors
Cullen reinforced his strategy with the idea of a three-point fix that goes back to his days serving in the U.S. Navy. The term is used to describe the chances for navigational success when a ship is stuck in a dense fog at sea. You can find your bearings in the fog by fixing your location to several points, like a lighthouse or buoy. If you could fix your location on three points, your navigation through the fog would be a success.
He adapted this idea to his investment strategy by making stock selections based on three navigational fixes. Specifically, one point would be that a stock has an attractive valuation such as a low price-earnings or price-to-book ratio relative to its peers and with a high dividend yield. A second point could be that the company has a strong story. The story generally relates to a company’s unique product or service, management changes or anything else that might cause the stock price to move upward. The third fix Cullen recommends has two parts: The stock is oversold relative to the S&P 500 and momentum is turning upward. Momentum, in this case, is an increase in the stock’s price over time. Cullen believes that these three conditions can improve the chances for success when choosing stocks for a long-term value portfolio.
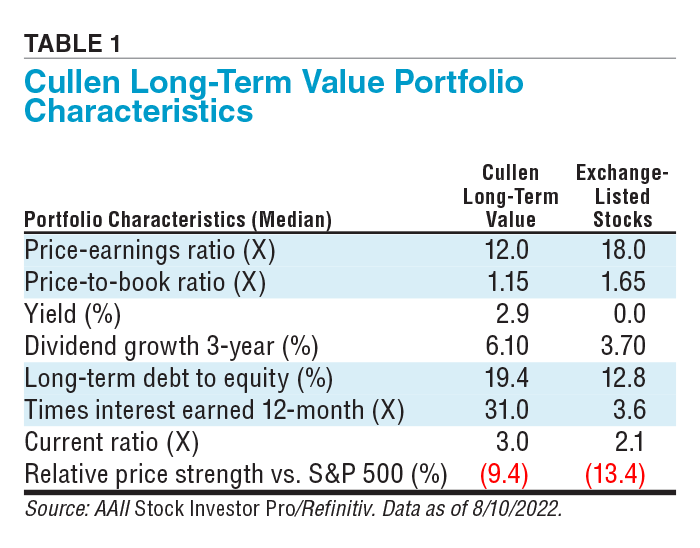
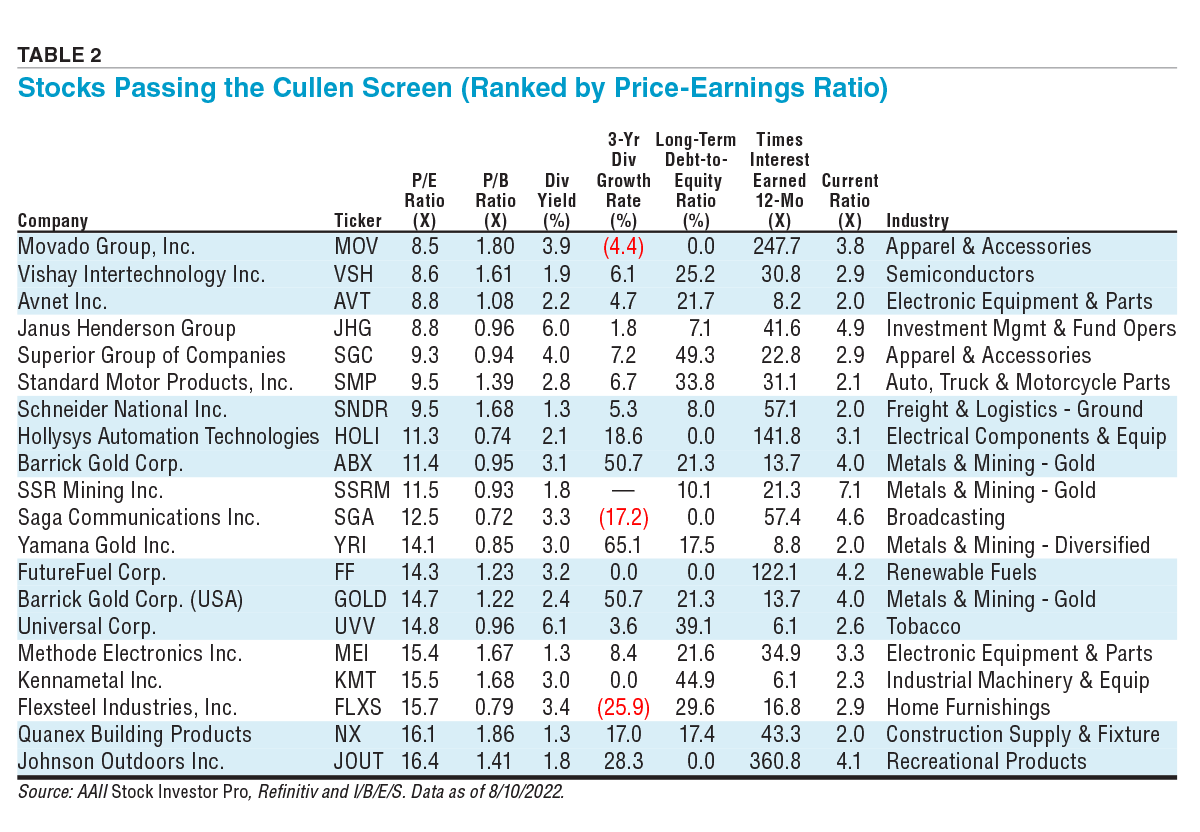
Table 1 highlights the characteristics of stocks meeting the Cullen Long-Term Value screening criteria as of August 10, 2022, and Table 2 lists the passing stocks ranked by price-earnings ratio.
The stocks meeting the criteria of the Cullen Long-Term Value approach do not represent a “recommended” or “buy” list. It is important to perform due diligence to verify the financial strength of the passing companies and to identify those stocks that match your investing tolerances and constraints before committing your investment dollars. Keep in mind that no matter how well a stock screening methodology has performed (or how badly it has underperformed) over the long term, stock screening is only the first step in the stock selection process.
In developing this screen, we found that applying all the criteria outlined in Cullen’s book was overly restrictive in terms of the types of companies that passed. Therefore, some of the criteria were made less restrictive to increase the number of passing companies. Investors desiring an even larger number of passing companies can alter the criteria further.
The dividend yield filter looks for companies with yields in the top 25% of the stock universe. This can be changed to include all dividend-paying stocks rather than only those that are top-ranking. Simply change the criterion to a yield greater than zero to boost the number of passing companies.
Times interest earned can be restrictive, especially during down periods in the market, as previously discussed. For example, we ran the screen at the end of 2008 and found that only 10 companies passed. Be wary of making this criterion too restrictive during bear markets and recessions.
The price-earnings ratio of the stock universe is constantly fluctuating. As such, companies passing the screen will have different price-earnings ranges over time. Some stocks may have a high price-earnings ratio relative to the universe of all stocks, but a low price-earnings ratio compared to their sector and industry averages. Therefore, widening the price-earnings range can increase the number of passing companies, but at the risk of including more companies with price-earnings ratios greater than their respective industry averages. Still, keep in mind that the goal of the strategy is to uncover stocks that are relatively undervalued.
The price-to-book ratio currently limits passing companies to those undervalued relative to their respective sector medians. As discussed earlier, the book value of a company may not be entirely reliable due to intangibles such as intellectual assets whose true value is not recognized on the balance sheet. This especially applies to industries with large amounts of intangible assets, such as software companies. Eliminating the price-to-book ratio from the screen will produce many more passing companies and possibly reveal undervalued companies with high price-to-book ratios.
AAII’s Cullen Long-Term Value strategy employs our interpretation of Cullen’s philosophy of undervalued companies that outperform the market over most periods. Cullen used Graham’s three key valuation measurements of low price to earnings, low price to book value and high dividend yield to find stocks that have long-term value.
After conducting research using many decades of market data, Cullen found that these types of stocks performed better than the S&P 500 in most years and over long periods of time. Coupling this philosophy with a screen for financial strength pinpoints the companies that can sustain during economic turmoil.
AAII Stock Ideas

Stock Strategies

Financial Statements

ROBERT A from NC posted over 4 years ago:
You need to log in as a registered AAII user before commenting.
Log InCreate an account