


Derek Hageman leads a class in AAII's new Essential Investing Video Course. Go to https://www.aaii.com/ves for more information and to subscribe.
AAII’s dividend investing philosophy seeks stocks that have the potential to rise in price and boost their dividends in the future—a total-return strategy. To achieve these goals, income investors should consider focusing on the three pillars of dividend investing when making dividend investment decisions.
The pillars of dividend investing are a firm’s valuation, growth trends and financial strength/quality. They represent a summary of a company’s fundamentals and give you a quick overview of how attractive a dividend-paying stock is. All three pillars provide useful metrics for judging whether a dividend-paying stock is attractive or not.
In this article, we explain the logic behind the pillars and the grades. Both AAII’s Dividend Grader, which shows specific company grades, and the AAII Dividend Screener, which identifies dividend-paying stocks with specific grades, are exclusive benefits for AAII Dividend Investing (DI) subscribers. The tools allow DI subscribers to identify stocks with particular letter grades for the three pillars of Dividend Investing: valuation, growth and strength. The screening tool is powered by AAII’s fundamental stock screening and research database program Stock Investor Pro, which underlies the screens you’ve seen featured in past issues of the AAII Journal.
Figure 1 shows the stock universe’s distribution across letter grades for each of the three dividend investment factors. Grades are assigned to dividend stocks based on how their valuation, growth and strength compare to all other dividend stocks. Each grade represents a quintile. Grades of A reflect the best 20% and grades of F reflect the worst 20% for a given pillar. Quintiles and other percentile rankings are commonly used in the investment industry to provide relative comparisons of stocks. Research shows advantages to buying stocks whose characteristics compare favorably to other stocks, such as a low valuation and strong underlying fundamental strength.
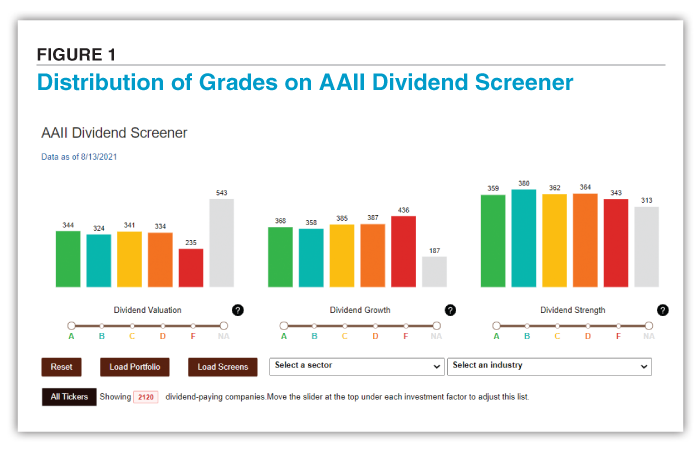
Less than 40% of all exchange-listed stocks pay dividends. As of mid-August 2021, there are 2,120 exchange-listed dividend payers. Dividend stocks as a group tend to be larger companies, but this is not universally the case. Dividend payers can be found across market capitalizations and across sectors as well.
Key Metrics for Analyzing Dividend Stocks
Successful dividend-paying stocks should possess good business models, strong balance sheets, growth in sales and earnings, positive free cash flow, attractive valuations and a history of rising dividend payments. In creating the Dividend Grader, we purposely sought metrics shown to be predictive of strong dividend growth, safety, consistency and attractive relative valuations.
To ensure the validity of those metrics used, we backtested the results of the scoring system across all letter grades (A to F) for the period of 1998 through 2019.
Our goal was to develop a quantitative approach using research-backed criteria to determine how stocks stack up against the major tenets of Dividend Investing’s three pillars. An advantage of quantitative methods is that they provide objective feedback on a stock’s underlying characteristics. Such approaches are useful for evaluating or getting a second opinion on stocks you own or are considering buying or selling.
The Dividend Valuation Grade is based on the score from the percentile rank of the average of the percentile ranks of the relative dividend yield and shareholder yield (buyback yield plus dividend yield). The score is not variable, meaning it must consider both relative dividend yield and shareholder yield to be valid. Though often viewed as a measure of income, yield is also an effective valuation measure. Lower relative yields signal a more expensive valuation, while higher yields signal a cheaper valuation.
The Dividend Growth Grade is based on the score from the percentile rank of the average of the percentile ranks of growth in cash flow from operations, return on assets (ROA) compared to its sector median, dividend growth rate for the last 12 months and average annualized dividend growth rate over the last five years. This metric looks for companies that have been growing their dividend and have funded the growth through improved profitability and cash flow.
The Dividend Strength Grade is based on the score from the percentile rank of the average of the percentile ranks of the earnings payout ratio compared to its sector median, ratio of total liabilities to total assets, times interest earned ratio compared to its sector median and the dividend sustainability score. The first three assess the company’s fundamental ability to continue paying a dividend. The last one, sustainability, considers whether a company has maintained its dividend (a positive) or cut it (a negative) over the past several years.
For the Dividend Growth and Dividend Strength Grades, the scores are variable, meaning they can consider all four components or, should any of the four components not be valid, the remaining components that are valid. Allowing this variability in a quantitative measure prevents it from being overly strict—and significantly limiting the number of passing stocks.
Seeking Companies With Strong Dividend Grades
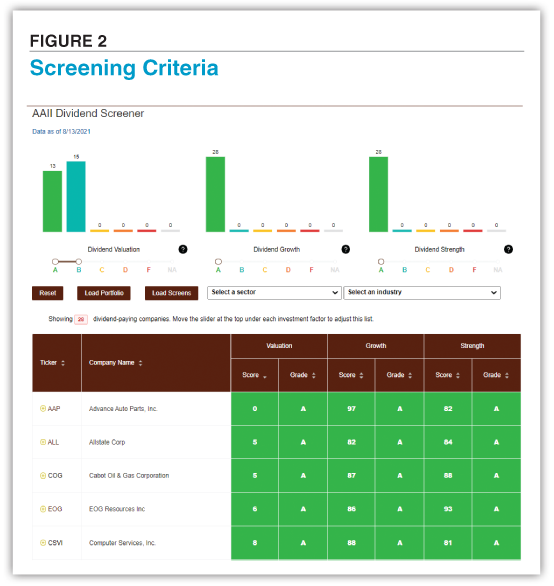
The starting point for this screen is a table of all the U.S.-listed dividend-paying companies in the Dividend Screener universe (roughly 2,100 companies). There are grade sliders below each of the three investment factors on the Dividend Screener. The grade slider starts in a “wide-open” position from a grade of A to NA. For this screen, we want to isolate only those dividend-paying stocks with Dividend Growth and Dividend Strength Grades of A and Dividend Valuation Grades of B or better.
To filter for companies with Dividend Valuation Grades of B or better, we move the slider from the right to the left until the range of A to B is highlighted. We follow a similar process to isolate stocks with Dividend Growth and Dividend Strength Grades of A by moving the slider to only highlight A grades. There are 28 companies that met these parameters as of the close on August 13, 2021, down from over 2,100 companies at the beginning. Figure 2 shows a subset of those companies, ranked in ascending order by Dividend Valuation Score.
Profile of Passing Companies
Table 1 highlights the characteristics of stocks meeting AAII’s Dividend Screener filter criteria with strong dividend grades as of August 13, 2021.
Table 1. Characteristics of Stocks With Strong Dividend Grades
Many of AAII’s screening approaches search for stocks that are attractively priced relative to some measure of intrinsic worth. These screens usually incorporate traditional valuation metrics such as price-earnings ratio or price-to-book-value ratio as primary screening criteria. The Dividend Screener does not use these traditional valuation metrics, but rather, the Dividend Valuation Grade is based on the score from the percentile rank of the average of the percentile ranks of the relative dividend yield and shareholder yield (buyback yield plus dividend yield). For comparison purposes, it is still interesting to see how all exchange-listed stocks stack up against the companies currently passing the Dividend Screener criteria.
For the stocks currently matching the Dividend Screener criteria presented in Table 1, the median value of the price-to-book ratio of 1.99 is significantly below the 2.32 median value for all exchange-listed stocks. The median values of the price-earnings ratio and price-to-sales ratio are also well below the median values of these metrics for all exchange-listed stocks. The median value of the historical earnings per share growth rate for the Dividend Screener criteria of 14.2% is above the 5.3% median value for all exchange-listed stocks. The median values for the estimated earnings per share growth rate favors all exchange-listed stocks by a wide margin. The average yield for the companies passing the Dividend Screener criteria is 1.7%.
The 28 companies that met the Dividend Screener criteria as of August 13, 2021, are listed in Table 2 ranked by highest dividend yield.
Table 2. Companies Currently Passing AAII’s Dividend Screener With Strong Dividend Grades
(Ranked by Dividend Yield)
Not a Buy or Sell List
 You may be wondering if the dividend-paying stocks meeting the criteria used here are “buys” and stocks with grades of D’s and F’s are “sells.” The companies passing a screen should not be viewed as a buy or sell list. As my AAII colleague Wayne Thorp is fond of saying, “We view the grade results as a stoplight.” If we see a stock that we own that has a lot of reds (meaning grades of D of F), that definitely signals to us that we should do some additional due diligence and analysis before making buy and sell decisions. Likewise, if we see a stock we own with a lot of greens, we feel more comfortable, but it doesn’t necessarily mean it should be added to our portfolio.
You can use the criteria underlying Dividend Investing grades to identify stocks that may warrant further research and potentially spend less time on those dividend payers that appear to be less attractive. The Dividend Screener and the Dividend Grades are useful quantitative tools for narrowing down the universe of dividend stocks, but it is the methodology underlying them that helps investors to determine which stocks may be better potential candidates.
AAII’s Approach to Assessing Dividend-Paying Stocks Video
We think you’d like this related webinar! Dividend Investing: Idea Discovery Made Simple

Related

Investor Professor
Three Pillars for Successful Dividend Investing
Related

Stock Strategies
A Dividend Approach to Judging the Value of Stocks
Discussion
FREE REPORT

Get your free copy of our special
report analyzing the tech stocks
most likely to outperform the
market.
GEOFFREY S from NJ posted over 5 years ago:
DAVID P from AL posted over 5 years ago:
You need to log in as a registered AAII user before commenting.
Log InCreate an account