


Related

The Big Question
A robust framework for identifying growth stocks with the potential for high returns.
by Wayne A. Thorp | June 2024

Wayne Thorp leads a class in AAII's new Essential Investing Video Course. Go to https://www.aaii.com/ves for more information and to subscribe.
Martin Zweig, a prominent stock picker of the 1990s and founder of the Zweig Fund, oversaw a stock recommendation newsletter that delivered an average annual return of 15.9% over 15 years. Zweig’s strategy integrated multiple fundamental and technical components to identify stocks and time the market effectively.
Zweig, who passed away in 2013, championed a growth-focused strategy detailed in his seminal work, “Martin Zweig’s Winning on Wall Street” (Warner Books, 1997). The approach targets companies demonstrating robust earnings and sales growth, reasonable price-earnings (P/E) ratios, minimal insider selling and strong price performance.
Zweig’s method is distinct in its blend of qualitative analysis and quantitative screening, allowing investors to manage a broad portfolio effectively. His methodology emphasizes the importance of strong and persistent earnings and sales growth, a reasonable price-earnings ratio considering the company’s growth rate, insider purchasing activities and robust price performance. He divided his stock-picking strategy into two main approaches:
Zweig favored the “shotgun approach” to identifying attractive investment candidates. This method entails screening publicly available data for several stocks using predetermined criteria. This more mechanical approach allows individuals to follow many stocks at once, spending a limited amount of time on any one company.
AAII created a Zweig screen based on our interpretation of Zweig’s approach as outlined in his book. Stock Investor Pro, AAII’s fundamental stock screening and research database program, was used to build the screen, and it is programmed into the software for subscribers. The list of companies passing the Zweig screen is updated daily in the Stock Ideas area of AAII.com for all AAII members.
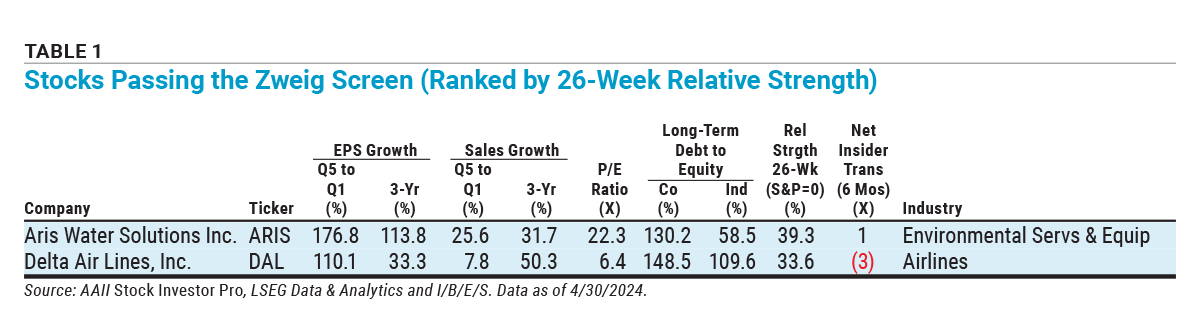
The passing companies using data as of April 30 are presented in Table 1.
The cornerstone of the screen revolves around what Zweig terms “reasonable gains in sales and earnings.” To this end, the screen examines both absolute levels and growth from various angles.
Zweig began his search by examining quarterly earnings and sales. Here, the AAII Zweig screen requires positive growth in earnings per share between the most recent fiscal quarter and the same quarter one year ago. Same-quarter growth is a better benchmark than sequential-quarter growth because seasonal patterns are less likely to be an influence.
The two companies passing the AAII Zweig screen as of April 30—Aris Water Solutions Inc.  (ARIS) and Delta Air Lines Inc. (DAL)—reported latest-quarter earnings growth of more than 100% year over year (176.8% and 110.1%, respectively). However, Delta Air Lines’ growth was skewed since it went from negative earnings of $0.568 per share for the quarter ended March 31, 2023, to positive $0.057 per share as of March 31, 2024.
The screen also requires positive same-quarter growth in earnings per share going back three additional quarters. Zweig warned of stocks with negative or “skimpy” growth rates on a same-quarter basis.
Since sales drive earnings, Zweig was also interested in companies that maintain their sales and those with increasing sales growth. To identify such companies, the AAII Zweig screen first requires a company to have positive year-over-year sales growth for the latest quarter.
Here, Aris Water again has higher year-over-year sales growth of 25.6% for its latest quarter, compared to 7.8% for Delta Air Lines.
To identify companies with accelerating sales growth, the AAII Zweig screen also seeks out companies whose year-over-year sales growth for the latest quarter is greater than that of the prior quarter’s growth.
Zweig also looked for companies with persistent, rising earnings on an annual basis. Here, our screen requires that a company’s earnings per share for the last four quarters (trailing 12 months) be greater than or equal to the earnings per share for the last fiscal year, as well as requiring year-to-year increases in earnings per share for each of the last two fiscal years. Zweig was also impressed with stocks that exhibit “strong” longer-term growth rates. Therefore, the AAII Zweig screen requires average annualized sales and earnings growth of at least 15% over the past three years.
Both Aris Water and Delta Air Lines easily surpass the three-year growth requirements. Aris Water has posted average annual sales growth of 31.7% over the past three years, while earnings have grown by an average of 113.8%. Delta Air Lines’ three-year sales growth is 50.3% and earnings have risen 33.3% per year over the past three years.
Zweig understood the relationship between sales growth and earnings growth. He stated that without further study, one cannot draw any negative conclusions when earnings do not grow as fast as sales. He pointed to competition and price-cutting as potential culprits, but the expenses required to introduce a new product may also serve as an explanation.
On the other hand, he was cautious of situations where earnings growth far outstrips sales. While it may be possible in the short term for a company to improve earnings through cost cutting, ultimately, increases in sales are what drive long-term earnings growth. If you see a company with a long-term growth rate in earnings substantially greater than the growth rate in sales, this is a red flag warning to study the sustainable nature of the growth. In the interim, however, a company can increase its earnings at a rate higher than sales due to operating efficiencies, financial leverage, etc. For this reason, a screen that would require sales growth to outpace earnings growth could punish good companies.
The next element Zweig looked for was increasing momentum in earnings growth, both over the short term and the longer term.
The AAII Zweig screen compares the growth rate in earnings between the last fiscal quarter and the same quarter one year ago to the growth in earnings between the sum total of the prior three fiscal quarters and the same three quarters one year ago.
Zweig did make an exception here, not wanting to exclude companies that had experienced strong growth in earnings per share for the last quarter, especially if they could continue that growth going forward. For that reason, the screen also accepts companies whose same-quarter growth rate for the most recent quarter is at least 30%.
The screen also compares the growth in same-quarter earnings for the last fiscal quarter to the longer-term growth, hoping to find companies with higher quarterly growth rates.
The criteria that make up the AAII Zweig screen will return companies benefiting from the current business cycle and market environment. As economic and market conditions change over time, the industries that make up most of the passing companies will probably change as well.
The other key element of Zweig’s stock selection is the price-earnings ratio. Zweig avoided living on the edge—he believed that a price-earnings ratio could be too high or too low.
On the low end, he felt there are two types of companies—those experiencing financial difficulties and those in neglected industries. In Zweig’s opinion, the risks of investing in financially troubled firms were too great to justify their investment since the risk of these firms going under overshadows any potential “value” in these stocks.
On the other hand, the market ignores neglected stocks because of bad news surrounding the company itself or the industry in which it operates. This overly negative view sometimes subsides, and the stock continues to enjoy above-average price appreciation. Studies have shown that these stocks tend to outperform higher price-earnings ratio stocks in the long run.
However, due to the nature of the AAII Zweig screen, it is doubtful you will run across any neglected companies in the list of passing stocks.
Zweig noted that if you find a company with a very low price-earnings ratio, given the growth requirements of the screen, you should immediately examine the balance sheet for any potential problems.
On the other end of the spectrum, Zweig got nervous about stocks with very high price-earnings ratios. These stocks run the risk of facing the wrath of the market should they fail to meet expectations. The higher the price-earnings ratio, the higher the expectation for that company, and the more painful the fall should it fail to meet them. Ideally, he selected stocks whose price-earnings ratios are near or slightly above the “market” average. He avoided stating an absolute ceiling, citing that the market price-earnings ratio rises and falls over time.
The AAII Zweig screen sets a minimum price-earnings ratio greater than 5.0, while at the high end, passing companies must have a price-earnings ratio lower than 1.5 times the median price-earnings ratio for the stock universe. As of April 30, 2024, the median price-earnings ratio for the stock universe was 18.1, making the cutoff 27.2. Aris Water was flirting with the ceiling with its price-earnings ratio of 22.3. On the other hand, Delta Air Lines is hovering just above the floor with its price-earnings ratio of 6.4.
In his book, Zweig spent a good amount of time discussing price action and the relative price strength of individual companies.
At a minimum, Zweig compared the market’s movement with that of the individual stocks. He was searching for companies that had outperformed the overall market. A stock may be rising in price, but you are still losing out if it fails to rise at the same rate as the overall market. For that reason, the AAII Zweig screen eliminates companies that have been underperforming the market over the past 26 weeks (six months). He theorized that if a company is as good as it appears, it should perform at least as well as the overall market.
Aris Water and Delta Air Lines handily beat the S&P 500 index over the 26 weeks ending April 30. Aris Water outperformed the S&P 500 by 39.3 percentage points, while Delta Air Lines’ relative strength over that period was 33.6%.
Lastly, the screen addresses the difficulty that can arise when investing in stocks lacking liquidity—they have relatively low daily trading volume. While Zweig believed that the average investor would not run into liquidity problems, establishing a minimum daily trading volume is a good idea. Therefore, the AAII Zweig screen requires that the average three-month trading volume of a company ranks in the top 75% of the stock universe.
To round out the AAII Zweig screen, supplemental filters are applied to the stock universe to further ensure the integrity of the passing companies. The first eliminates those companies traded as American depositary receipts (ADRs), which are foreign-listed companies traded on U.S. exchanges.
The AAII Zweig screen also excludes investment holding companies and real estate firms, usually consisting of closed-end mutual funds and real estate investment trusts (REITs).
Figure 1 shows the performance of the AAII Zweig screen. With monthly rebalancing, the screen’s long-term performance has been impressive, yielding an annual increase of 12.7% since its 1998 inception, compared to the S&P 500’s annual rise of 6.5% during the same period. The screen, however, has been 76% more volatile than the S&P 500, as captured by the risk index of 1.76. This volatility reduces the risk-adjusted return to 11.1%, indicating that the performance compares favorably even with the extra volatility.
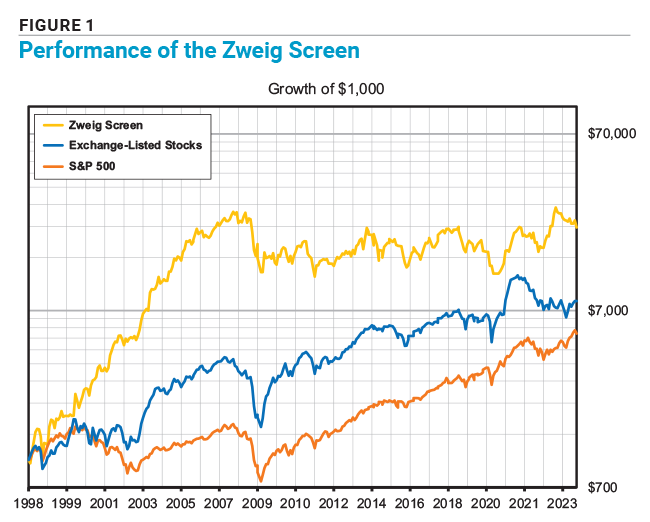

It is worth pointing out the struggles of the Zweig screen over the last five- and 10-year periods, in which it has underperformed the S&P 500 by a wide margin. Like most approaches, the strategy has not outperformed the market in all stages of the market cycle. Examining the year-by-year returns is essential to see how strongly the screen’s performance can vary over time.
The characteristics of the stocks passing the AAII Zweig screen are presented in Table 2.
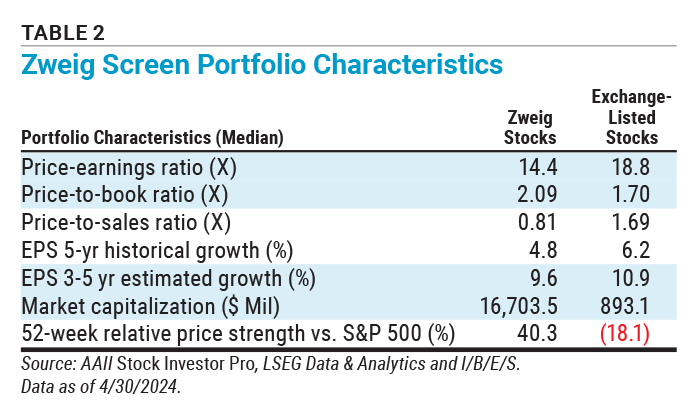
The AAII Zweig screen’s “conservative growth” approach is reflected in the lower median price-earnings multiple for the passing companies than the typical exchange-listed stock (14.4 versus 18.8). While the median price-to-book-value (P/B) ratio for the current group of passing companies (2.09) is above the median for all exchange-listed stocks (1.70), the price-to-sales (P/S) ratio of the passing companies is significantly lower than the median for all exchange-listed companies (0.81 versus 1.69).
The passing companies lagged that of the typical exchange-listed company in terms of historical earnings growth—4.8% compared to 6.2%. Also, the median expected annual earnings growth rate over the next three to five years is lower for the passing companies than the typical exchange-listed stock (9.6% versus 10.9%).
The median market capitalization for the passing companies is $16.7 billion compared to $893.1 million for all exchange-listed firms. Delta Air Lines’ market cap of $32.6 billion ranks in the top 6% of the stock universe, while Aris Water’s market cap of $851 million is in the 60th percentile of all stocks.
The 52-week relative price strength index highlights the outperformance of these stocks as a group compared to the S&P 500 over the last year. The passing companies outperformed the S&P 500 by a median value of 40.3%, compared to the 18.1% median underperformance for all exchange-listed stocks.
Zweig’s investing strategy provides a robust framework for identifying growth stocks with the potential for high returns. By focusing on earnings growth, reasonable valuations, insider confidence and market strength, investors can refine their portfolios to include stocks that are performing well and poised for future success.
This approach, while systematic, requires vigilance and adaptability, as market conditions can quickly alter the attractiveness of stocks that once passed all screening criteria. Investors are encouraged to use Zweig’s criteria as a starting point and to continuously monitor their investments in the context of changing market dynamics.
The Big Question



BARRY J from TX posted over 2 years ago:
Charles J from MD posted over 2 years ago:
MARY M from CA posted over 2 years ago:
WILLIAM J from SC posted over 2 years ago:
You need to log in as a registered AAII user before commenting.
Log InCreate an account