



Related

AAII Stock Ideas
Price-earnings relatives help to establish benchmark comparisons to identify firms that have deviated from their normal valuation level.

The price-earnings ratio, or earnings multiple, is one of the most popular measures of company value. It is computed by dividing the current stock price by earnings per share for the most recent 12 months. It is followed so closely because it relates the market’s expectation of future company performance—embedded in the price component of the equation—to the company’s actual recent earnings performance. The greater the expectation, the higher the multiple of current earnings that investors are willing to pay for the promise of future earnings. Value investors analyze companies with low price-earnings ratios hoping to find stocks mispriced because of market neglect or overreaction to bad news.
Comparisons can help gauge if a company’s price-earnings ratio is reasonable. The relative price-earnings ratio approach looks at the relationship of a stock’s price-earnings ratio to the price-earnings ratio of the overall market or of the company’s industry.
AAII developed a stock screen based on the price-earnings relative to help identify promising firms that have fallen out of favor. As Figure 1 shows, the P/E Relative approach has outperformed the S&P 500 index since inception in 1998. The screen has generated a compound annual price gain of 13.6% over the period from January 1998 through August 2022, while the S&P 500 is up 5.5% annually over the same period.

The price-earnings relative used in the screen is determined by dividing a company’s price-earnings ratio by that of the market. Based on relative growth and risk expectations, companies trade at multiples greater or less than that of the market multiple. One would expect a company with prospects better than the market, or with lower risk, or both, to have a higher price-earnings ratio than the market. Comparing a firm to its industry is an equally useful technique that has the benefit of isolating candidates within a specific industry.
Changes in the relative levels of the price-earnings ratio may signal that the market, for whatever reason, is changing its expectations about the future earnings potential of a firm, or not paying attention and mispricing the security. It may also signal that a short-term change has already occurred or is expected to occur. The price-earnings relative valuation model, however, assumes that the long-term growth and risk profile of the firm has not fundamentally changed over time. A careful evaluation of each firm’s relative price-earnings ratio must be undertaken before investing to determine if it represents a reasonable relationship to the market going forward.
A price-earnings relative average above 1.00 would indicate that a company’s price-earnings ratio is typically above the market’s price-earnings ratio, while a price-earnings relative average below 1.00 would indicate that a company’s price-earnings ratio tends to be lower than that of the market. Changes in price-earnings relatives compared to average levels may indicate a misvaluation.
AAII’s Stock Investor Pro fundamental stock screening and research database is used for running the screen. To ensure reasonable liquidity, the first screen looks for stocks trading on Nasdaq, the New York Stock Exchange and the American Stock Exchange. American depositary receipts (ADRs), which are foreign companies that are traded on U.S. exchanges, are excluded.
Firms are required to have five years of data and positive earnings per share for each of the last five years. A price-earnings ratio can only be calculated with positive earnings per share.
Beyond negative earnings, which lead to meaningless price-earnings ratios, unusually low earnings may also throw off standard price-earnings ratio screens. Short-term drops in earnings due to incidents such as extraordinary events or in some cases even recessions may lead to unusually high price-earnings ratios. As long as the market interprets the earnings decrease as temporary, the stock price may not fall as dramatically as the earnings, resulting in a high price-earnings ratio. Because the average price-earnings relative model relies on a normal situation, these “outlier” price-earnings ratios should be excluded.
When performing a hands-on evaluation, you can manually exclude years with negative earnings or unusually high price-earnings ratios. However, when screening a large universe of stocks, it is best to establish criteria that try to eliminate companies with extreme price-earnings ratios. For the P/E Relative screen, companies with ratios above 100 for any of the last five fiscal years are excluded. If you want to be more conservative, a tighter requirement such as excluding ratios above 40 or 50 might be specified.
We do not screen for minimum historical or expected growth rates. It is important to remember that the growth rate is a raw growth figure that does not necessarily divulge any change in trend or indicate the variability of earnings. The easiest and most direct way to judge earnings is to examine the earnings directly year by year, looking for stability and accelerating growth. As a basic screen, positive earnings per share from continuing operations for the most recent 12 months and each of the last five years are required. Screens that are more stringent would require increases in each of the last five years or even an increase in the year-to-year growth rate for each of the last five years.
It is important to look at factors leading to the growth and determine if the growth is sustainable. When examining a firm’s earnings patterns, it is necessary to carefully read both quarterly and annual reports, which can clue you into possible explanations of the earnings growth pattern. Was a significant portion of the earnings growth achieved through acquisition or internal growth? Did earnings growth from franchises come from increases in same-store sales or the opening of new stores? Did currency translations impact earnings? Are competitive conditions changing within the industry? Are margins increasing or decreasing?
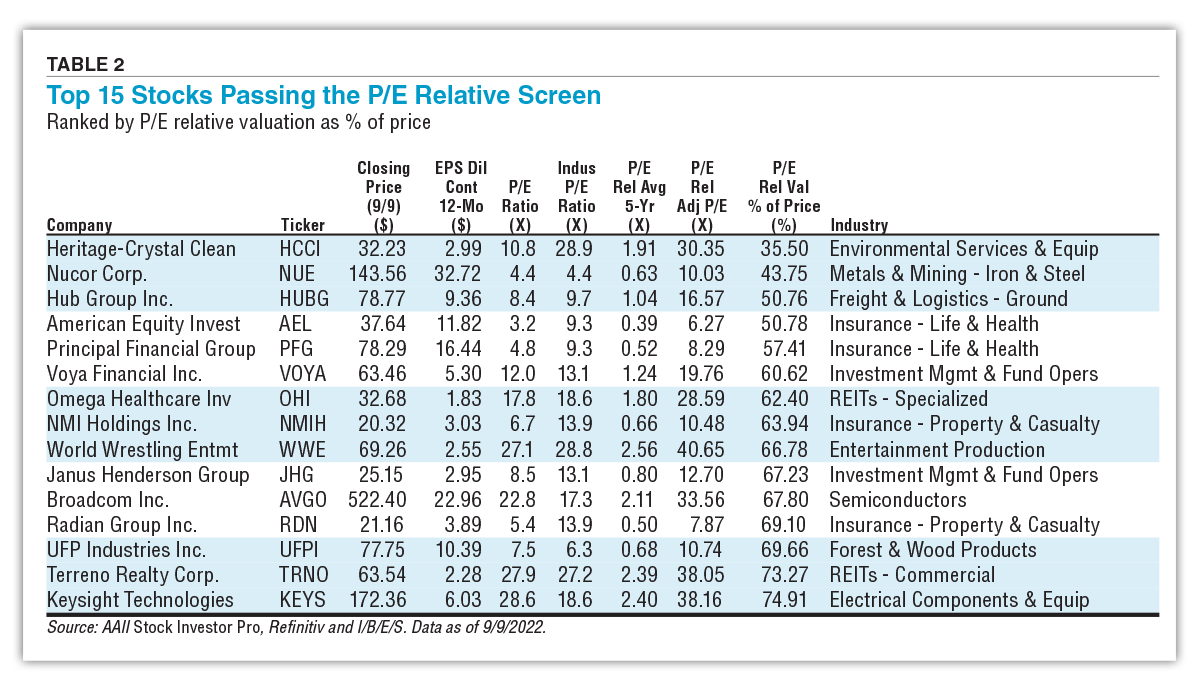
To arrive at a price-earnings relative valuation estimate, the earnings per share for the last 12 months is multiplied by a price-earnings ratio that is adjusted based on the stock’s five-year average price-earnings relative. For example, Nucor Corp.  (NUE) currently has a very low price-earnings ratio of 4.4 times trailing earnings, which matches the median 4.4 ratio for its industry. Over the last five years, Nucor’s price-earnings ratio has traded at a discount to the typical stock—0.63 times the median for all domestic stocks. Multiplying the price-earnings relative by the current median market price-earnings ratio provides a price-earnings relative adjusted company price-earnings ratio of 10.03 (0.63 (NUE) 15.91). You can then estimate a “fair” valuation of $328.18 by multiplying the earnings per share by this adjusted ratio ($32.72 (NUE) 10.03 = $328.18). With a current price of $143.56, Nucor is trading at a 43.75% relative level to its valuation of $328.18.
Investors often look for a catalyst to help attract attention to a company and boost its stock price. The stock prices of many attractively priced stocks often languish until investors find a reason to reevaluate the prospects of the firm or its industry. Upward earnings revisions and positive earnings surprises are events that make investors take notice of a company. Revisions to earnings estimates lead to price adjustments. When earnings estimates are revised significantly, stocks tend to show above-average performance. Stock prices of firms with downward revisions tend to show below-average performance after the adjustment. Changes in estimates reflect changes in expectations of future performance. For our screen, we require upward revisions to current and next year’s earnings over the last month.
Price momentum is often used as a signal that the market has recognized that the stock price is reacting to either proven performance or an increase in expectations. Investors look for stock price performance superior to that of other stocks with the belief that the rising price will attract other investors, who will drive up the price even more. Although not a screen requirement, the current market price as a percentage of the 52-week high price is a popular measure of price strength and momentum. If a firm’s stock price continues to be strong, it should be trading near its 52-week high.
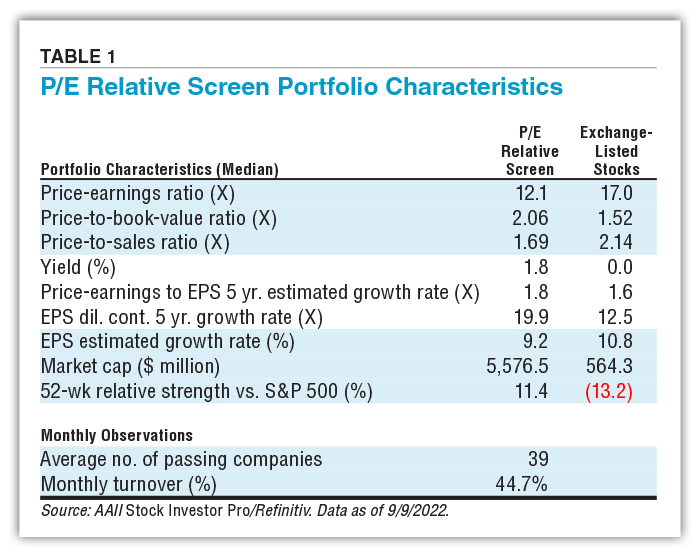
As shown in Table 1, stocks passing the P/E Relative screen have a lower median price-earnings ratio of 12.1 than the universe of all exchange-listed stocks at 17.0, along with a higher median five-year earnings growth rate of 19.9% than exchange-listed stocks at 12.5%. The stocks passing the screen have a median market capitalization (share price times shares outstanding) of over $5.5 billion. The typical exchange-listed company is trading with a market cap of $564 million. While the stocks currently passing the screen have outperformed the S&P 500 by 11.4% over the last 52 weeks, the typical exchange-listed stock has underperformed the S&P 500 by 13.2% over the same period.
Table 2 shows the top 15 the companies passing the P/E Relative screen as September 9, 2022. The stocks are sorted by their price-earnings relative valuation as a percentage of price. This is calculated by dividing the current market price by the price-earnings relative valuation. Looking at the stocks in the table, 10 of the top 15 passing stocks have a price-earnings ratio less than their respective industry average.
Go to the P/E Relative Screen webpage for an updated list of stocks passing this screen.
Screening for stocks by looking at price-earnings ratios can help highlight firms that have fallen out of favor. Price-earnings relatives help to establish benchmark comparisons to identify firms that have deviated from their normal valuation level—with the critical assumption that nothing fundamental to the company, industry or market has changed significantly. The analysis can highlight companies worthy of further analysis given the expectation they will move back to their typical levels.
In constructing screening criteria, you may wish to include a number of conditioning criteria that help indicate items such as the future earnings potential of the firm, the financial strength of the firm and the strength of the firm within its industry. Investing in low price-earnings stocks can be rewarding, but caution is required.
AAII Stock Ideas

Stock Strategies


No comments have been added yet. Add your thoughts to the discussion!
You need to log in as a registered AAII user before commenting.
Log InCreate an account