


Related

ETFs and Mutual Funds
Some high-yield equity funds use derivative income or covered calls to produce extra income. See how these riskier funds compare to high-yield equity funds that use conventional strategies.

“Boomer candy” has been a hot buzzword in the financial services industry. Chocolate bars, gummy bears, Bottle Caps anyone? In investing, the sugar craze is from exchange-traded funds (ETFs) that offer both stock exposure and income payouts. Due to the high-income potential, those who are retired or nearing retirement have been adding these products to their portfolios with the speed and intensity with which Halloween candy is consumed each year.
The boomer-candy catchphrase has become synonymous with these funds because of their appeal to the baby boomer demographic. Exploring what is behind this trend felt like a trip to my local candy store for those hard-to-find items that gave me sugar highs during my childhood.
The ETFs receiving the bulk of the attention are derivative income or covered call funds. These ETFs use derivatives to produce extra income or protect against losses while simultaneously investing in a portfolio of equities.
In covered call funds, fund managers will sell options to sweeten the income distributions. The covered call strategy involves selling, or “writing,” call options on stocks that are owned. The strategy is also known as “buy-write.” With these strategies, investors forfeit equity growth for the potential of receiving bountiful income payouts.
In addition to income, covered call ETFs can be pitched as providing a buffer against the unpredictability of the stock market. The equity component stays in the stock market while the call options provide income.
Yields have matched or exceeded balanced mutual funds and ETFs with moderate allocations. Balanced funds include a mix of stocks and bonds that roughly mimic a portfolio composed of 60% stock and 40% fixed income. A 60% stock/40% bond portfolio is representative of a moderate allocation. The average yield for balanced mutual funds and ETFs is approximately 2.9%. Yields range from 0.18% to 11.70% for moderate allocation ETFs and 0.5% to 4.6% for mutual funds.
Since income is the primary allure of boomer-candy funds, we cast a wider net to find high-yielding equity mutual funds and ETFs beyond those just offering derivative income. AAII’s mutual fund and ETF screeners were used to filter for large-, mid- and small-cap categories with high yields. Sector equity and derivative income were also screened for. Inverse and leveraged mutual funds and ETFs were excluded.
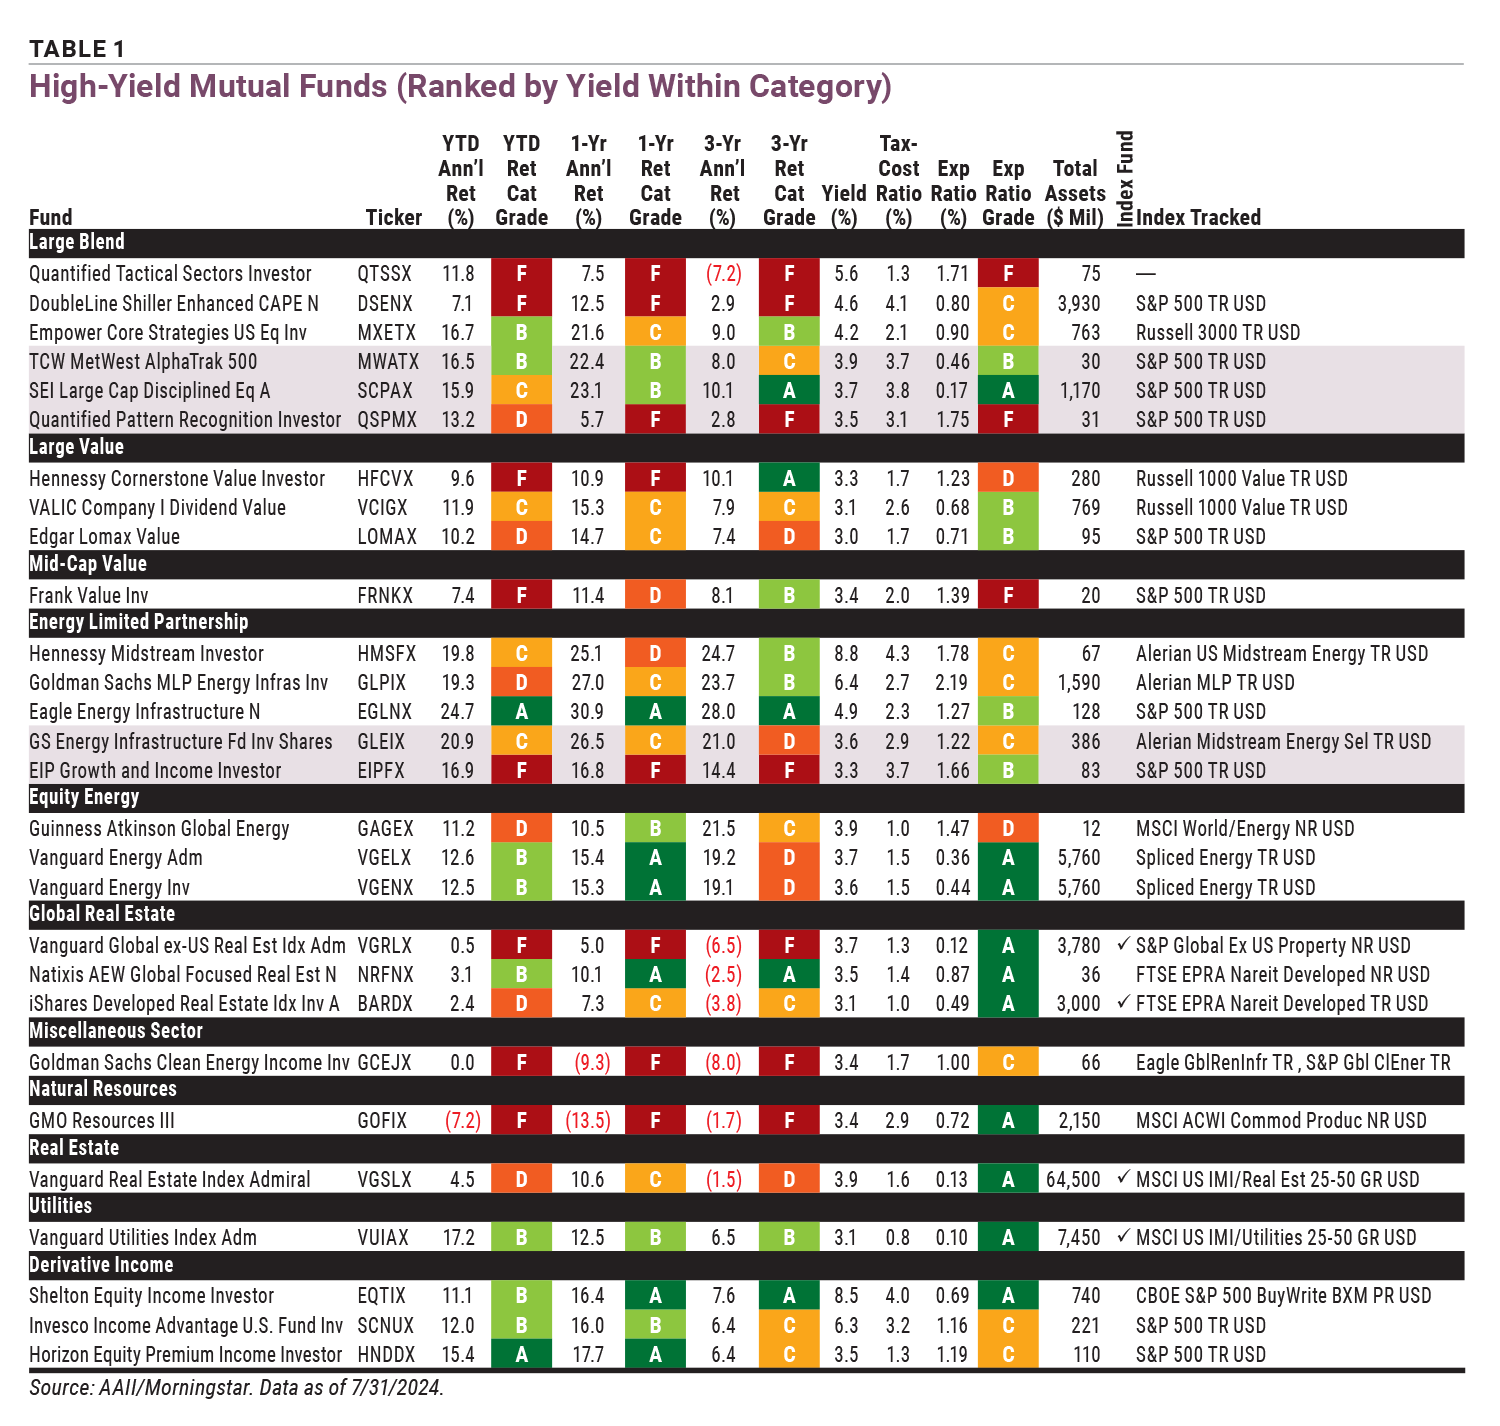
For mutual funds, yields were required to be greater than 3%. We excluded those closed to new investors and those with retirement, advisor, institutional, other and S share classes. Only no-load funds are shown in Table 1.
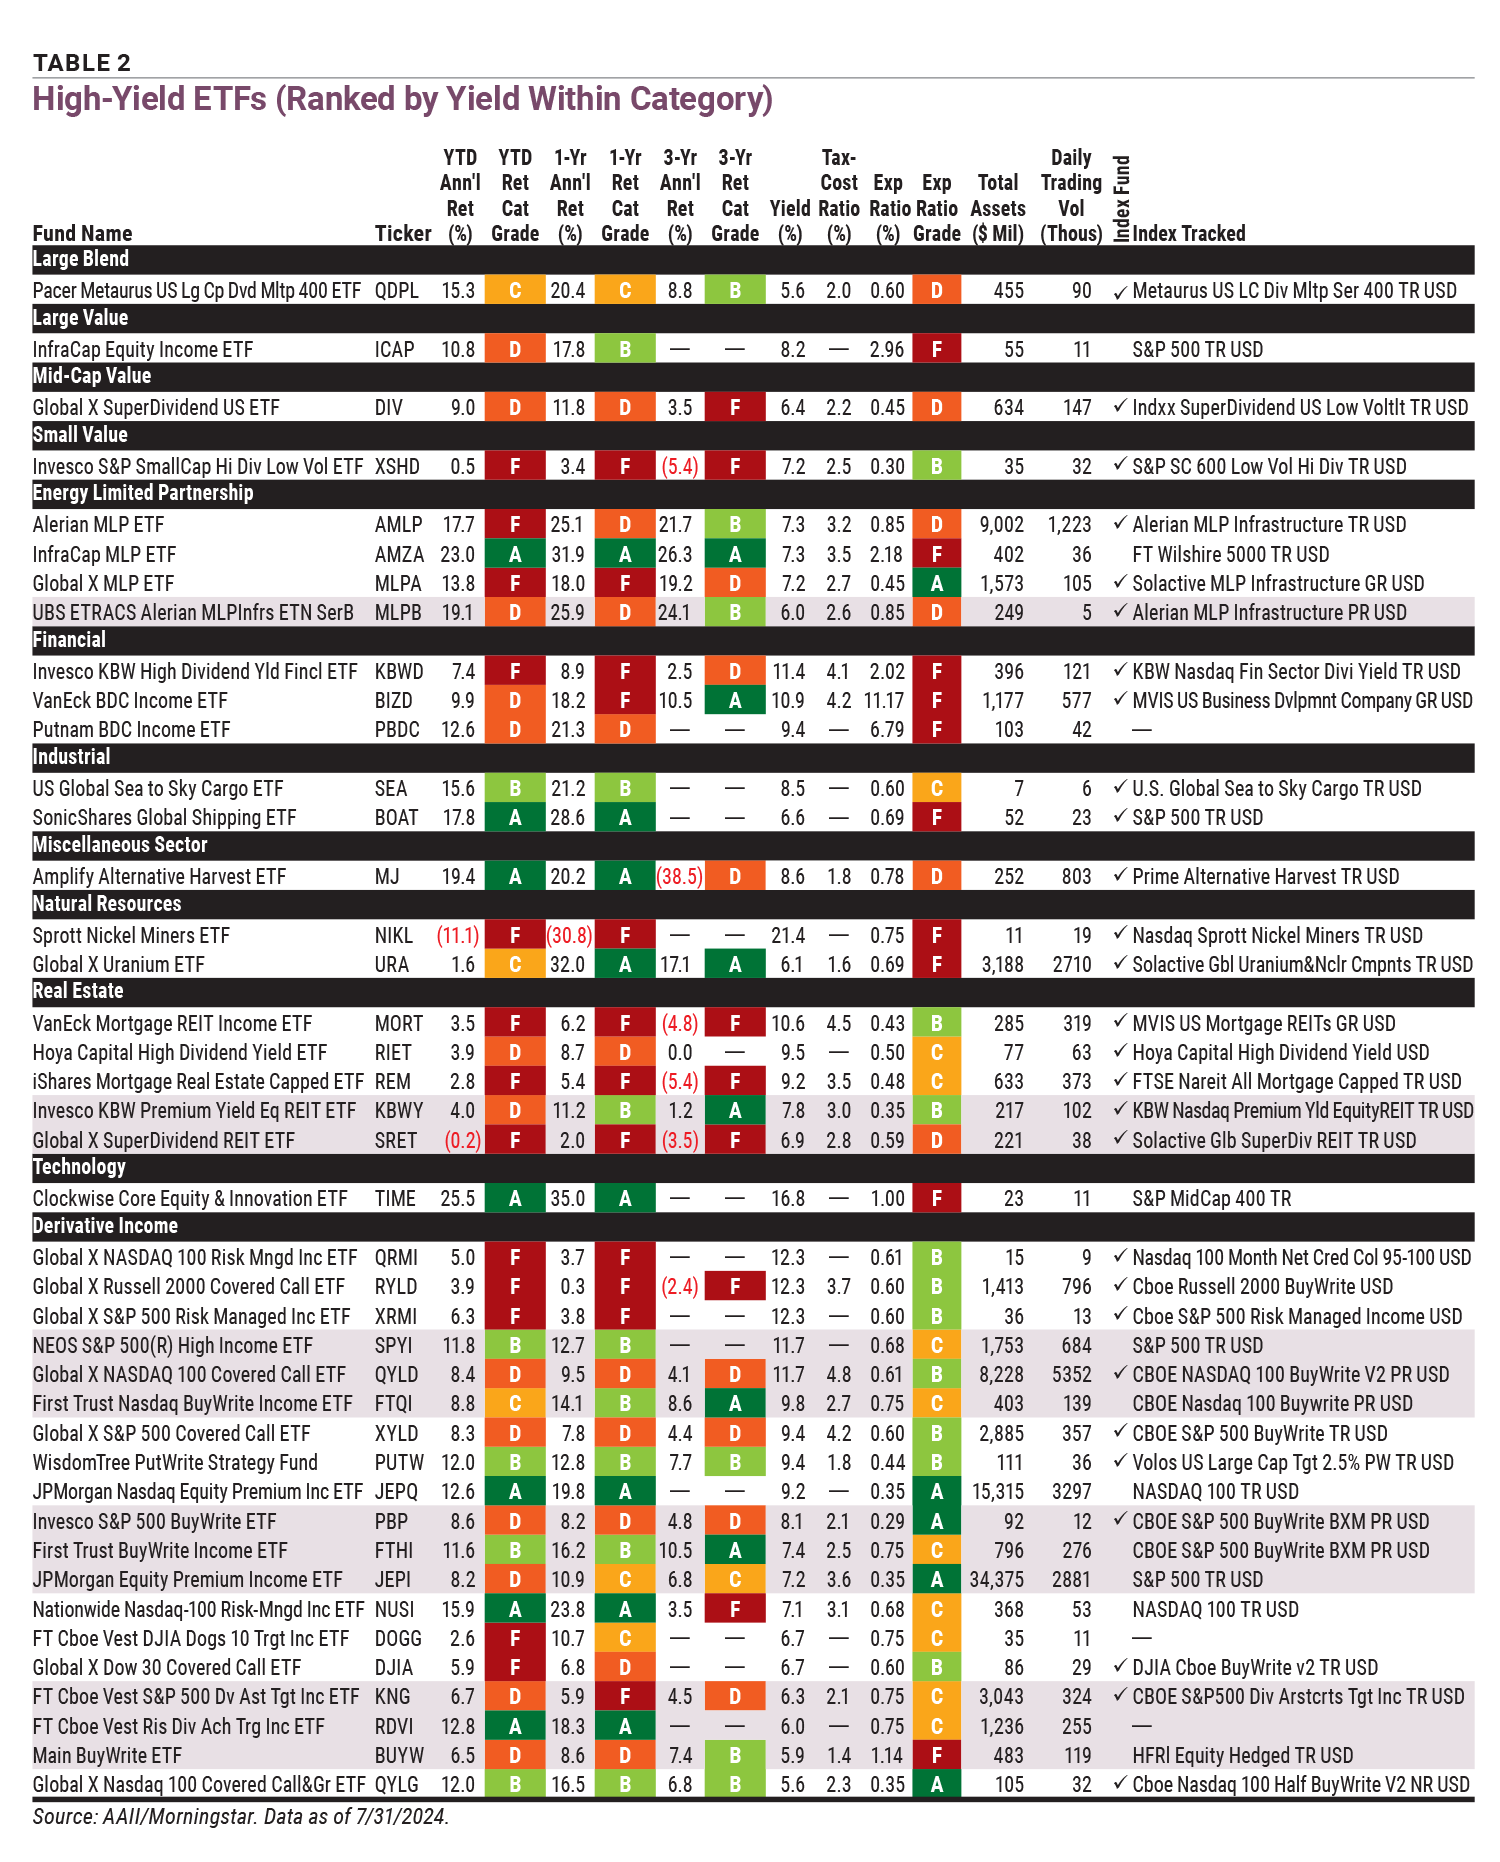
The yields of ETFs in Table 2 were required to be greater than 5%, due to the larger number of passing funds. All ETFs were also required to have an average daily trading volume of greater than 5,000 shares.
Yield is calculated as income for the most recent 12 months divided by the month-end net asset value (NAV). The average yield for the mutual funds shown in Table 1 is 4.2%. The average yield for the ETFs shown in Table 2 is 8.9%.
Download the Excel spreadsheet for Table 1.
Since these high-yielding mutual funds and ETFs obtain their attractive yields through distributions, the tax-cost ratio is an applicable metric to consider. The tax-cost ratio measures how much a mutual fund or ETF’s annualized return is reduced by taxes investors pay on distributions. A 2.0% tax-cost ratio would reduce a fund’s 10.0% return to 8.0% on an aftertax basis. The higher the tax-cost ratio, the greater an investor’s tax bill will be from owning such funds.
The average tax-cost ratio for the mutual funds shown in Table 1 is 2.3%. The average tax-cost ratio for the ETFs shown in Table 2 is 2.9%.
The tax-cost ratio matters to investors holding funds in taxable accounts. It does not apply when a fund is held in a tax-preferred account like an individual retirement account (IRA) or Roth IRA.
The strategies used by the mutual funds in Table 1 vary greatly as do their returns and corresponding AAII A+ Investor Grades. Categories run the gamut. Those considered boomer candy are grouped under derivative income mutual funds in the last section of the table. Most of the mutual funds are actively managed.
The Quantified Tactical Sectors Investor fund  (QTSSX) falls into the large blend mutual fund category. It has a yield of 5.6%, the highest for large blend mutual funds that are open and widely available to individual investors. This yield does not come cheap—the Quantified Tactical Sectors Investor has an expense ratio of 1.71%, the second-highest expense ratio in Table 1. The actively managed fund uses a tactical asset allocation that shifts the percentage of assets held in various sectors the fund’s subadviser believes are the strongest. The fund invests primarily in common and preferred stocks through direct investment or through ETFs and other investment companies. Despite this momentum strategy, the year-to-date, one-year and three-year annualized returns rank in the bottom 20% for the large blend category (A+ Investor Grades of F).
The DoubleLine Shiller Enhanced CAPE Class N fund (DSENX) yields 4.6%. It is also categorized as a large blend mutual fund, even though it incorporates global fixed-income sector rotation and U.S. equity sector rotation through the index it tracks. The rotation is meant to provide exposure to undervalued sectors. Derivatives and direct investments are used to achieve total returns over a full market cycle. Year-to-date and one-year and three-year annualized returns also equate to A+ Investor Grades of F. Its expense ratio of 0.80% is average.
Among the large blend mutual funds, the TCW MetWest AlphaTrak 500 fund (MWATX) and the SEI Large Cap Disciplined Equity Class A fund (SCPAX) offer the best historical returns with below-average (cheap) expense ratios. An initial investment in the SEI Large Cap Disciplined Equity Class A will set you back $100,000, while an initial investment in the TCW MetWest AlphaTrak 500 is $5,000. Both funds have a high portfolio turnover and don’t strictly invest in equities but use other assets. The TCW MetWest AlphaTrak 500 uses S&P 500 index futures and yields 3.9%. The SEI Large Cap Disciplined Equity Class A yields 3.7%.
The Hennessy Midstream Investor fund (HMSFX) is the highest-yielding mutual fund in Table 1. It yields 8.8%. The fund also has the highest tax-cost ratio at 4.3%. Investments primarily consist of master limited partnerships (MLPs) and common stocks. MLPs tend to generate higher yields because they pass their earnings as well as return of capital through to shareholders. The Eagle Energy Infrastructure Class N fund (EGLNX) is the only fund in Table 1 to receive all AAII A+ Investor Grades of A for the return periods shown. The fund’s yield is 4.9% and its tax-cost ratio is 2.3%
The Shelton Equity Income Investor fund (EQTIX) is a derivative income fund and has the second-highest yield (8.5%) in Table 1. The fund invests in income-producing equity securities. It also can sell covered call options to generate additional cash flow income and enhance distribution rates to shareholders. Its returns and expense ratio equate to above-average AAII A+ Investor Grades.
Dividends bring up an interesting point about derivative income funds. Dividends paid by public companies are generally qualified and thus taxed at the favorable 0%, 15% and 20% rates through 2025. This doesn’t include the additional 3.8% net investment income (NII) tax for high earners. Option income can be taxed at the ordinary income rate if the holding period is less than one year. Furthermore, dividends may lose their qualified status due to the trading strategy used by covered call funds. This occurs when the stock is not held for 61 consecutive days during the 121-day period that starts 60 days before the ex-dividend date. To this point, the Shelton Equity Income Investor has a 4.0% tax-cost ratio.
In contrast to the high-yield mutual funds, most of the ETFs depicted in Table 2 are passively managed. You will also observe a greater number of derivative income products that passed the screen. High-yielding ETFs also include those from the financial and industrials equity sectors. Sector ETFs focus on a narrow and specific market segment.
Download the Excel spreadsheet for Table 2.
As you review the yield column, your eyes might pop a bit when you see the Sprott Nickel Miners ETF’s (NIKL) yield of 21.4%. This ETF invests in nickel mining companies and companies that invest in or supply nickel. It was incepted in March 2023 and despite the high yield, its returns are among the lowest in the natural resources category (A+ Investor Grades of F). The expense ratio of 0.75% is among the highest. Tax-cost ratios require a three-year period for calculation, so one is not yet available for this ETF.
The financial sector ETFs in Table 2 have the highest expense ratios of all the ETFs shown in Table 2. While their yields are high, their returns are poor.
Two of the ETFs shown hold business development companies (BDCs). BDCs make investments in the debt and/or equity of small to midsize companies predominantly in the U.S. BDCs may be registered as regulated investment companies (RIC), potentially giving investors a tax advantage. RICs must distribute 90% of their income to investors, allowing the corporate entity to be exempt from federal taxes. Thus, they trade with higher yields.
The VanEck BDC Income ETF (BIZD) yields 10.9%. Notably, this is lower than its expense ratio of 11.17%. According to the ETF’s prospectus, this expense ratio accounts for both the expenses that the fund pays directly out of its assets (direct expenses) and the expense ratios of the underlying funds in which it invests, including the BDCs. These indirect expenses are called acquired fund fees. Acquired fund fees are 10.75% for the VanEck BDC Income.
Derivative income ETFs have yields ranging from 5.6% to 12.3%. They exemplify the boomer-candy moniker. Many shown in Table 2 use buy-write (covered call) strategies and some lack a three-year return history.
The Invesco S&P 500 BuyWrite ETF (PBP) has the longest history, launched in 2007. It yields 8.1% but has below-average returns (A+ Investor Grades of D).
The JPMorgan Equity Premium Income ETF (JEPI) has the most assets under management (AUM) in the table at $34.4 billion. Its yield and tax-cost ratio are somewhere in the middle at 7.2% and 3.6%, respectively. It was launched in May 2020 during the height of the coronavirus pandemic and spurred other issuers to launch similar products.
The Global X NASDAQ 100 Covered Call ETF (QYLD) has the highest tax-cost ratio shown in Table 2 of 4.8%. Its yield is 11.7%. It writes call options on the Nasdaq-100 index and pays distributions monthly.
Most ETFs in the derivative income category have the objective of seeking current income while maintaining the opportunity for capital appreciation.
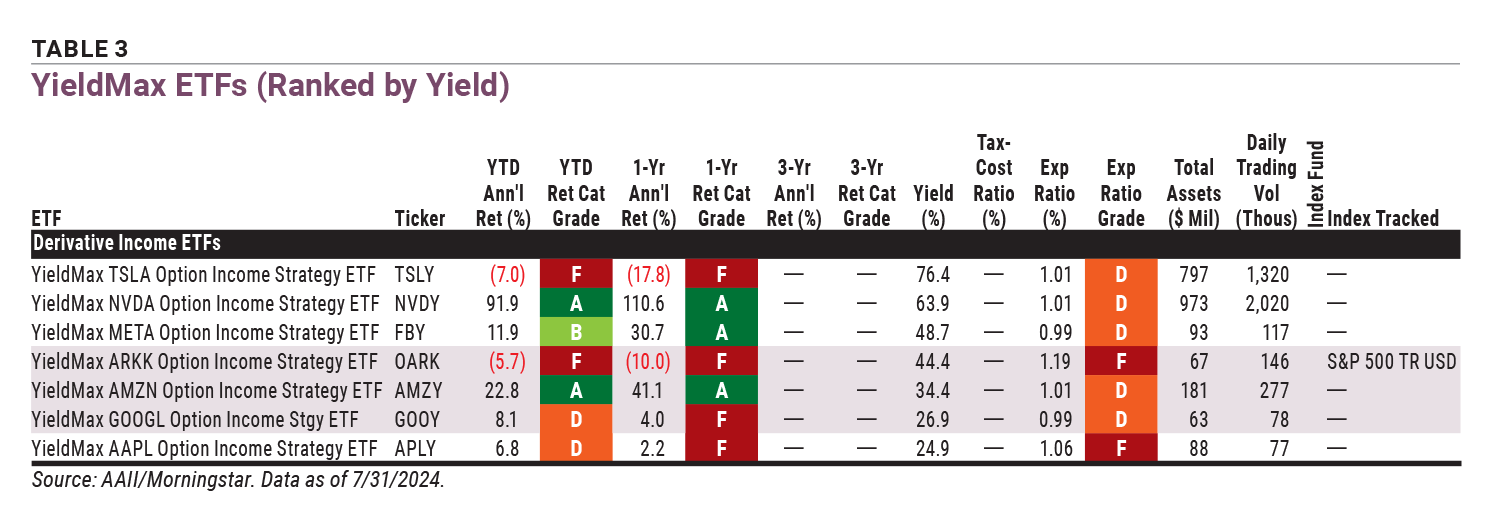
The ETFs in Table 3 are YieldMax ETFs. These are shown separately because most track a single stock. While all of the YieldMax ETFs have very high yields, they are also nondiversified and complex ETFs.
Download the Excel spreadsheet for Table 3.
YieldMax ETFs generate monthly income by pursuing options-based strategies based on the appreciation of a single stock or another ETF. The stocks tracked by the ETFs in Table 3 are all subsets of the Magnificent Seven large-cap technology stocks. The YieldMax ARKK Option Income Strategy ETF (OARK) tracks the ARK Innovation ETF (ARKK). Per the YieldMax ARKK Option Income Strategy prospectus, the ETF is subject to a limit on potential investment gains of the underlying security (the ARK Innovation in this case). These YieldMax ETFs do not invest directly in the underlying stocks or ETF. Monthly income is also created from options premiums.
High-yielding mutual funds and ETFs offer investors options but also require special consideration and some hefty homework. Understanding the strategy and what conditions it will perform well in is a first step. The performance shown in the tables is very uneven. Breaking down the yield and knowing how each of those parts is taxed is another step. Also understanding whether it is best to hold the particular mutual fund or ETF in a taxable or tax-advantaged account is important. We always encourage investors to investigate expense ratios and see how they compare for the given category.
Plus, keep in mind that boomer candy and similar high-yielding investment products are like Skittles. They are fantastic until the sugar high wears off.
ETFs and Mutual Funds

ETFs and Mutual Funds

Investor Professor

BARRY J from TX posted over 2 years ago:
SESHADRI N from NJ posted over 2 years ago:
ROBERT A from NC posted over 2 years ago:
DAVE G from TX posted over 2 years ago:
JOHN K from AZ posted over 2 years ago:
KENNETH A from AL posted over 2 years ago:
JOHN L from NJ posted over 2 years ago:
NICK D from NY posted over 2 years ago:
GARY T from WI posted about 1 year ago:
Cynthia M from IL posted about 1 year ago:
You need to log in as a registered AAII user before commenting.
Log InCreate an account