


Related

Portfolio Strategies
When evaluating active strategies, consider manager tenure, differentiated strategies and segments with less competition for active managers.

The active-passive debate within the realm of mutual funds and exchange-traded funds (ETFs) is a perennial battleground where investment philosophies clash.
An actively managed fund uses a fund manager or team of managers to select and trade investments in an effort to outperform the benchmark. This strategy hinges on the belief that skillful analysis and timely decisions can yield superior returns, transcending the performance of passive strategies.
On the flip side, passive management champions a hands-off approach, seeking to replicate the performance of a chosen market index. Instead of frequently buying and selling securities, passive funds maintain a portfolio that mirrors the index’s composition. Passive management eschews costly research and star managers. Passive funds tend to be far less expensive than their active brethren, which is advantageous for fund shareholders.
Proponents of passive investing cite empirical evidence showcasing its ability to deliver competitive returns over the long term while offering lower fees, a factor often emphasized in an era increasingly conscious of investment costs. Advocates of active management argue that skilled fund managers can exploit market inefficiencies, adapt to changing conditions and generate outperformance attributable to skill (alpha) by selecting specific securities.
Active management also lends itself to strategies that target a certain market event or condition. Such strategies can include opportunistically rotating into specific sectors or investments or adjusting market exposure. Some active managers may also make use of leverage, utilize options or otherwise use approaches that are meant to hedge or mitigate the risk of a changing market and/or economic conditions.
This debate transpires across both the mutual fund and ETF landscapes. However, mutual funds have traditionally dominated the active space. For many years, actively managed ETFs were considered an oddity.
A catalyst for changing this was the U.S. Securities and Exchange Commission’s (SEC) approval of rule 6c-11 in 2019. Known as the ETF rule, this legislation allowed fund providers to create and redeem ETF shares with so-called custom baskets. Custom baskets allow authorized participants (APs)—typically large trading firms like market makers—to exchange assets with the ETF that do not perfectly match the portfolio the ETF has. This is in contrast with a standard basket that matches the ETF’s portfolio.
The exchange of baskets between the APs and the ETF helps to keep the ETF trading at a price equal to or close to the value of its underlying assets. The process also works to create new shares or eliminate shares based on prevailing demand for them.
The advent of the SEC ETF rule spurred product development in the ETF industry by allowing for a level of opacity between the fund’s manager and the APs. Prior to the rule’s passage, active managers had concerns about revealing intended portfolio changes before having the chance to make them.
With the rule, converting a mutual fund into an ETF became comparatively more appealing. The opportunity to benefit from the greater tax efficiency of ETFs was requested by investors of various mutual funds. According to Morningstar Direct, as of May 2, 2024, there are 75 actively managed ETFs that started their lives as mutual funds. These include U.S.-domiciled ETFs converted from open-ended mutual funds.
There are a couple of reasons why active ETFs have become popular.
Investors prefer cheaper funds, and ETFs tend to be cheaper than mutual funds. Consider the T. Rowe Price Blue Chip Growth fund  (TRBCX) and the T. Rowe Price Blue Chip Growth ETF (TCHP). The ETF version has an expense ratio of 0.57% while the mutual fund has an expense ratio of 0.70%. This 13-basis-point difference may not seem like much, but over time, it adds up.
Active ETFs also rank well on transparency and ease of trading. ETFs disclose their holdings daily, whereas mutual funds tend to release a list of holdings on a quarterly basis. ETFs trade on exchanges and are not subject to minimum investment amounts, as many mutual funds are. Investors can trade ETFs during exchange hours. Mutual fund transactions are processed once per day after the market closes.
One key advantage that mutual funds have is that fund managers can close a fund to new investors. This may happen when the size of a fund becomes so large that it begins to interfere with the ability to execute the strategy.
S&P Dow Jones Indices’ SPIVA U.S. Scorecard provides an ongoing comparison of how active managers have performed relative to their passive counterparts. According to this report, the majority of active funds have consistently underperformed their benchmarks over just about any time period you’d care to consider. Time frames of one, three, five, 10, 15 and 20 years are presented. The report found that 60% of all active large-cap U.S. equity funds underperformed the S&P 500 index.
The SPIVA scorecard provides performance on both an absolute and risk-adjusted basis. While the S&P 500 is the best-known benchmark, measuring a fund’s performance against it doesn’t always tell the full story. Therefore, benchmarks appropriate for a particular fund’s category are used by the SPIVA report to provide more of an apples-to-apples comparison.
When reviewing performance, it is helpful to consider both shorter and longer time periods that capture multiple economic cycles. It is also helpful to consider performance within a mutual fund or ETF’s given category. For this article, we screened mutual funds and ETFs with returns that ranked in the 41% to 100% range within their category for one-year, three-year, five-year and 10-year periods. The higher the percentage, the better a fund fared relative to its category peers, with 50% being average.
We excluded leveraged and inverse funds. For mutual funds, we specified no loads and no 12b-1 fees. Institutional, retirement and adviser share classes were excluded. ETFs included have an average daily trading volume greater than 5,000. Finally, we attempted to include funds in the asset classes most used in individual investors’ portfolios.
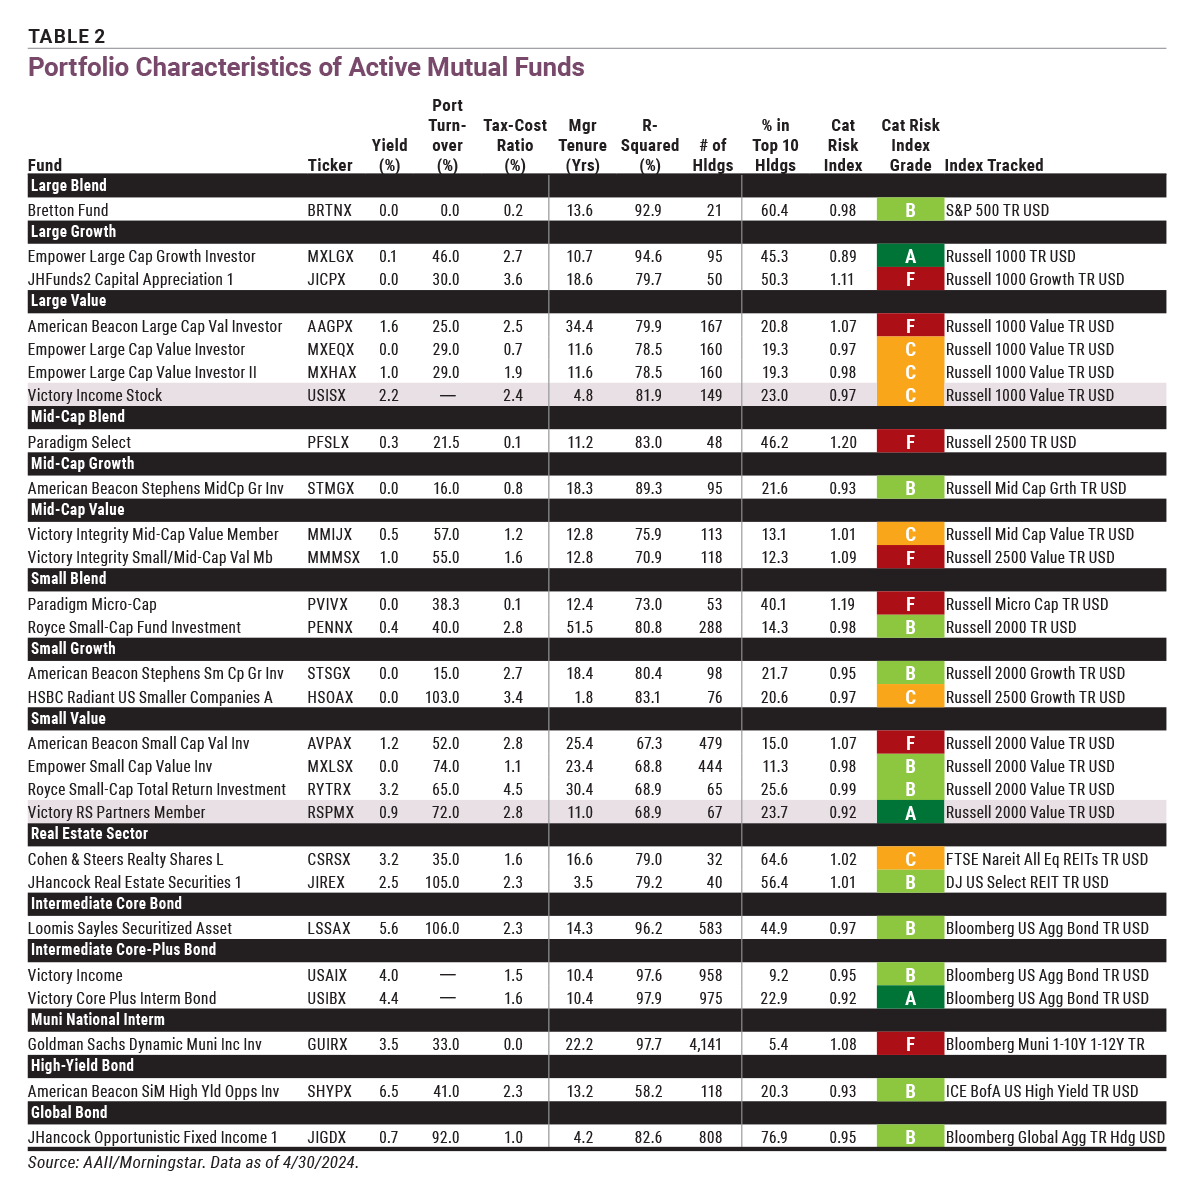
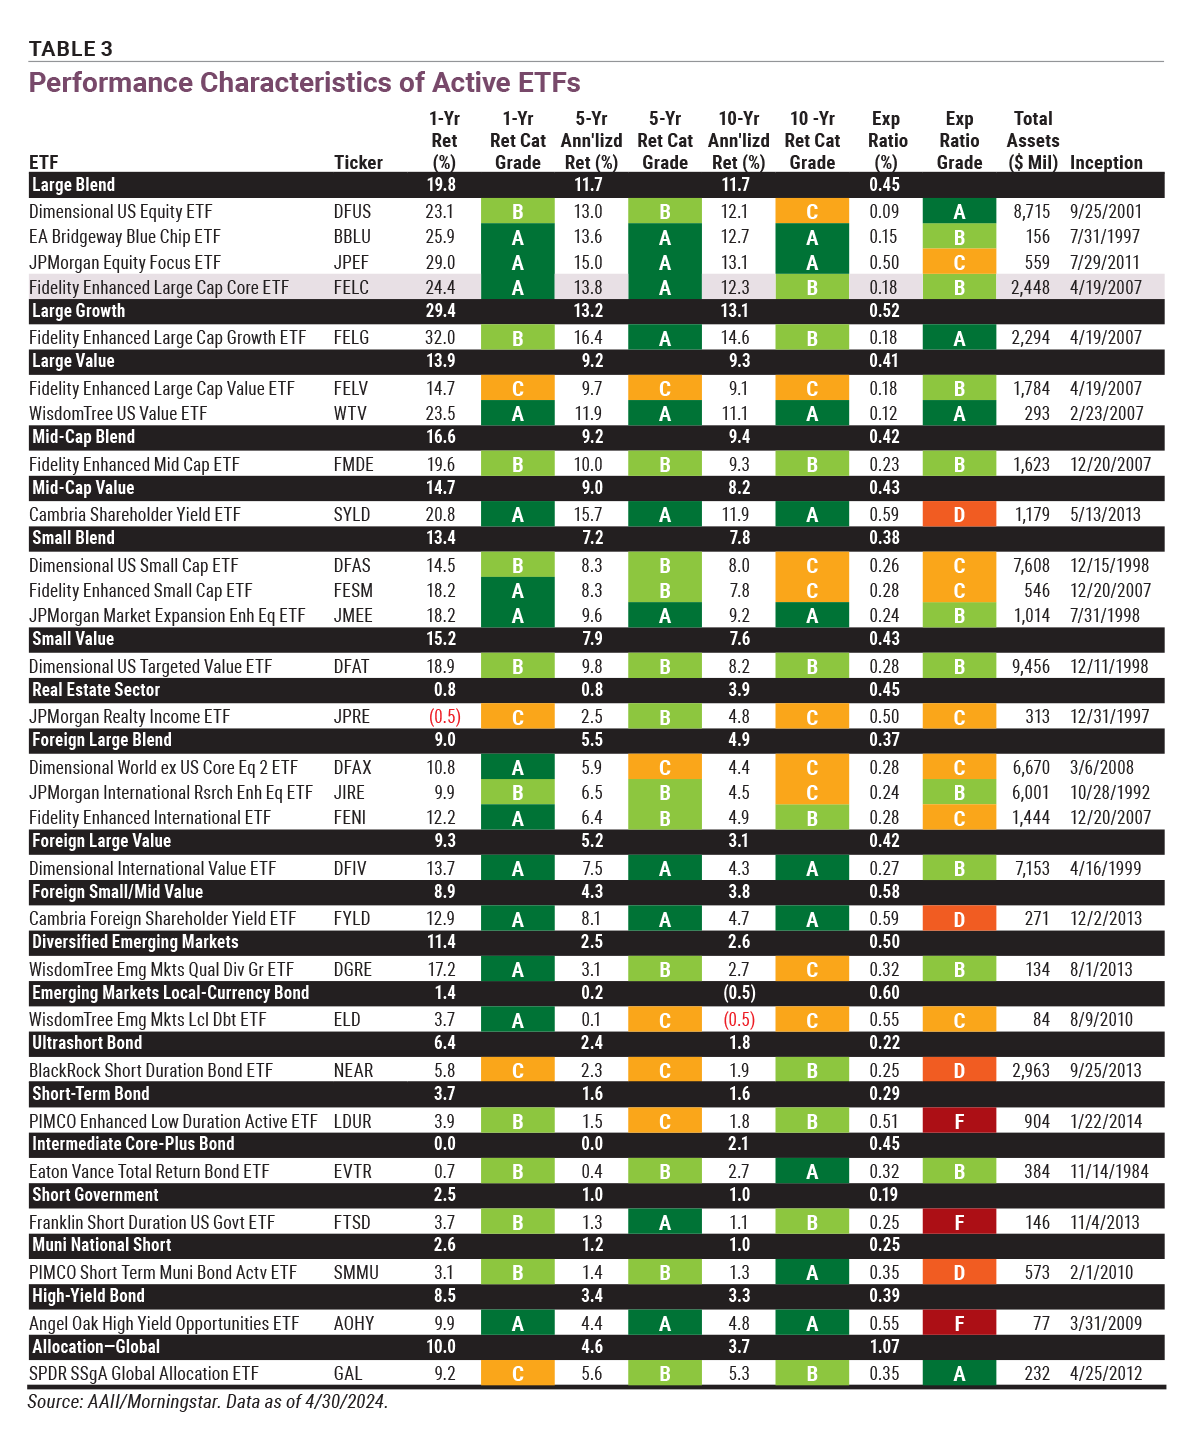
Table 1 and Table 3 show return data for the active mutual funds and ETFs, respectively, that made the cut. Category average returns are shown for comparison. Table 2 and Table 4 show additional characteristics that offer portfolio insights into those mutual funds and ETFs.
Large blend funds are a staple in many individual investors’ portfolios but they are one category where active managers may be challenged to add value above and beyond index funds. This is because of the large number of portfolio managers, analysts and investors looking at such stocks.
The Bretton fund (BRTNX) is one fund that has outperformed its category average on a one-year basis, returning 27.9%, compared to 20.8% for the average large blend stock fund. It also ranks in the top quintile for its category on a three- and five-year return basis. The fund does have a comparatively high expense ratio of 1.35%, however. The average for the funds shown in Table 1 is 0.95%.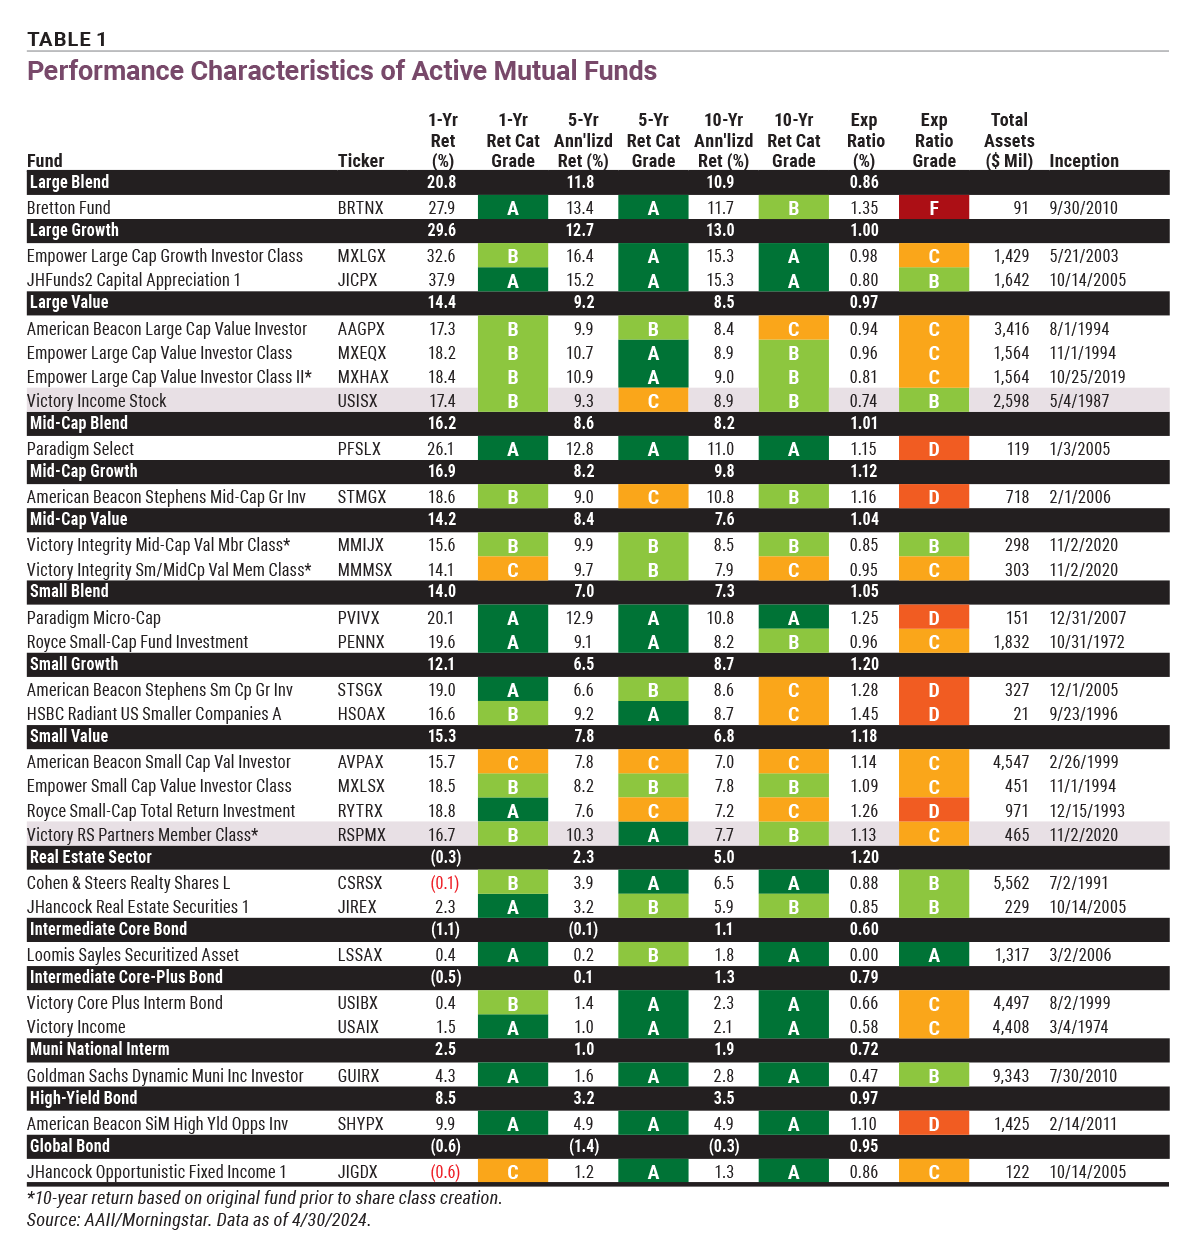
Download the Excel Spreadsheet for Tables 1 and 2.
The tax-cost ratio measures how much a fund’s annualized return is reduced by the taxes paid on distributions, assuming the maximum marginal tax rate. The Royce Small-Cap Total Return Investment fund (RYTRX) had the highest tax-cost ratio at 4.5%. The average for funds in Table 2 is 1.9%.
Since benchmarking is important with active management, R-squared is shown in Table 2. It represents the percentage of a fund’s movement that can be explained by movements in the S&P 500. The numbers can range from 0% to 100%. The more closely the return matches the S&P 500 over the last three years, the higher the R-squared value. Many funds that don’t track the S&P 500 and have a lower R-squared had industry or special concentrations. The lower the R-squared, the greater the chance that the fund’s return will not follow the S&P 500.
Download the Excel Spreadsheet for Tables 1 and 2.
R-squared values range from 97.9% to 58.2% for the active mutual funds. With the exception of the Bretton fund, none of the funds covered track the S&P 500, which helps to explain the differences, particularly in fixed-income funds. The Bretton fund’s R-squared is 92.9%—which is slightly below the average for large blend stock funds (94.8%).
Concentration risk is a particular concern with active funds. In Table 2, this is measured as the percentage of the fund’s value in the top 10 holdings. The average concentration risk of the active mutual funds in the table is 29.8%. The John Hancock Opportunistic Fixed Income 1 fund (JIGDX) in the global bond category has the highest percentage in its top 10 holdings at 76.9%. The higher the number, the bigger impact the largest fund holdings have on a fund’s returns.
The category risk index provides a relative measure of risk by calculating the variation in total return for a fund over the last three years compared to the typical variation in return for all funds in its category. Values above 1.00 are riskier than average and values below 1.00 denote less risk than average for the category. Ten of the active mutual funds in Table 2 have above-average category risk. Greater volatility in returns can be worthwhile because it can lead to proportionately larger three-year annualized returns. (Three years is the period the category risk ratio is measured over.)
Manager tenure often matters when it comes to active mutual funds. The loss of a star manager can create risks that the past outperformance will not continue into the future. The average tenure of portfolio managers for the mutual funds covered here is 15.9 years. The Royce Small-Cap Investment fund (PENNX) is an outlier with a tenure of 51.5 years. Charles Royce has served as manager since the fund originally launched in 1972 (the inception date in Table 1 refers to the investment class shares).
All Fidelity active ETFs represented in Table 3 and Table 4 were converted from mutual funds in late 2023. The active Dimensional Fund Advisors ETFs shown were converted in 2021. The Angel Oak High Yield Opportunities ETF (AOHY) was converted earlier this year. All retained their original track record and thus have 10-year returns.
Download the Excel Spreadsheet for Tables 3 and 4.
A larger number of active ETFs than mutual funds passed the screen. Expense ratios are much lower, with an average of 0.32% compared to 0.95% for the active mutual funds. Concentration risk is in line with that of the mutual funds, averaging 30.9%. The average manager tenure for the active ETFs is 14.6 years, which is slightly lower than the average active mutual fund manager tenure. R-squared values range from 99.7% for active large blend ETFs to 47.0% for the active high-yield bond ETF in Table 4.

Download the Excel Spreadsheet for Tables 3 and 4.
Active mutual funds and ETFs in the large blend stock category hold some of the most widely followed securities in the world. There are fewer pricing inefficiencies to exploit, making it harder to outperform.
The SPIVA data shows a higher percentage of actively managed funds outperforming in categories such as emerging markets equities, small-cap equities and high-yield bonds. These areas of the market are not followed as closely. They are also more difficult to track with an index fund because of less liquidity and smaller total dollar size.
When evaluating active strategies, investors should consider manager tenure, differentiated strategies and segments with less competition for active managers. Costs and portfolio efficiency should be examined as well.
Portfolio Strategies

ETFs and Mutual Funds

AAII How-To

BARRY J from TX posted over 2 years ago:
BARRY J from TX posted over 2 years ago:
ROBERT A from NC posted over 2 years ago:
Cynthia M from IL posted over 2 years ago:
SCOTT R from CA posted over 2 years ago:
Cynthia M from IL posted over 2 years ago:
You need to log in as a registered AAII user before commenting.
Log InCreate an account