



- Fluctuating investor sentiment is driving market leadership shifts between small and large stocks
- A quarterly review of model portfolio holdings leads to removing one stock for exceeding the size limit and another for negative earnings
- Thirteen candidates from the Ideas list were examined to choose two replacement stocks
Investor sentiment has fluctuated widely as investors reassess the strength of the economy and the direction of interest rates. We saw major shifts in market leadership recently, with small-cap stocks shining briefly until signs of economic weakness pushed investor preference toward larger defensive companies.
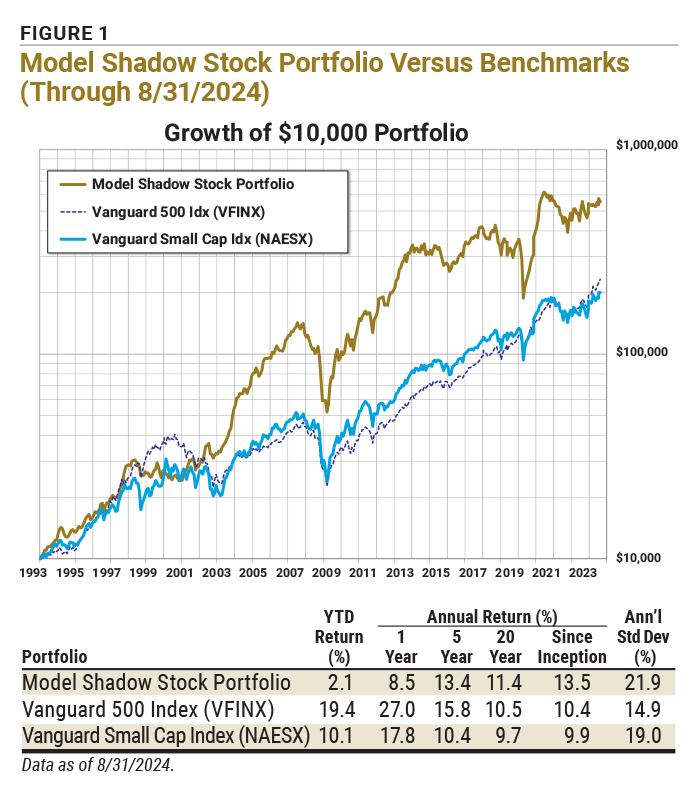
The Model Shadow Stock Portfolio is up 2.1% for the year as of August 31. The S&P 500 index, as measured by the performance of the Vanguard 500 Index fund  (VFINX), is up 19.4% for the first eight months of the year, while the Vanguard Small Cap Index fund (NAESX) is up 10.1% for the year.
In the large-cap segment, growth stocks are up 24.6% year to date, while value stocks are up 14.1%. Mid-cap growth stocks are up 15.5% for the year, while mid-cap value stocks are up 8.7%. Small-cap growth stocks are up 11.7% year to date, while small-cap value stocks are up 5.1%.
Since its inception in 1993, the AAII Model Shadow Stock Portfolio has a compound annual average return of 13.5%, versus the Vanguard 500 Index fund’s gain of 10.4% per year on average over the same period. Over the same period, the Vanguard Small Cap Index fund has an average annual gain of 9.9%. Figure 1 shows performance over other time periods.
Quarterly Review and Deletions
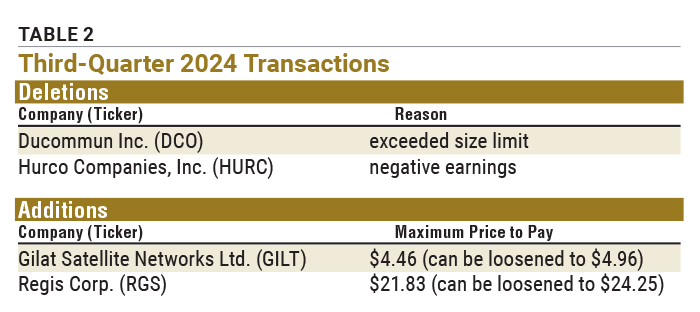
Table 1 shows the stocks currently comprising the model portfolio. The Model Shadow Stock Portfolio is reviewed quarterly to determine portfolio deletions and additions, a practice put in place at the portfolio’s inception. After conducting the quarterly review of the Model Shadow Stock Portfolio, there are two deletions and two additions, as summarized in Table 2.
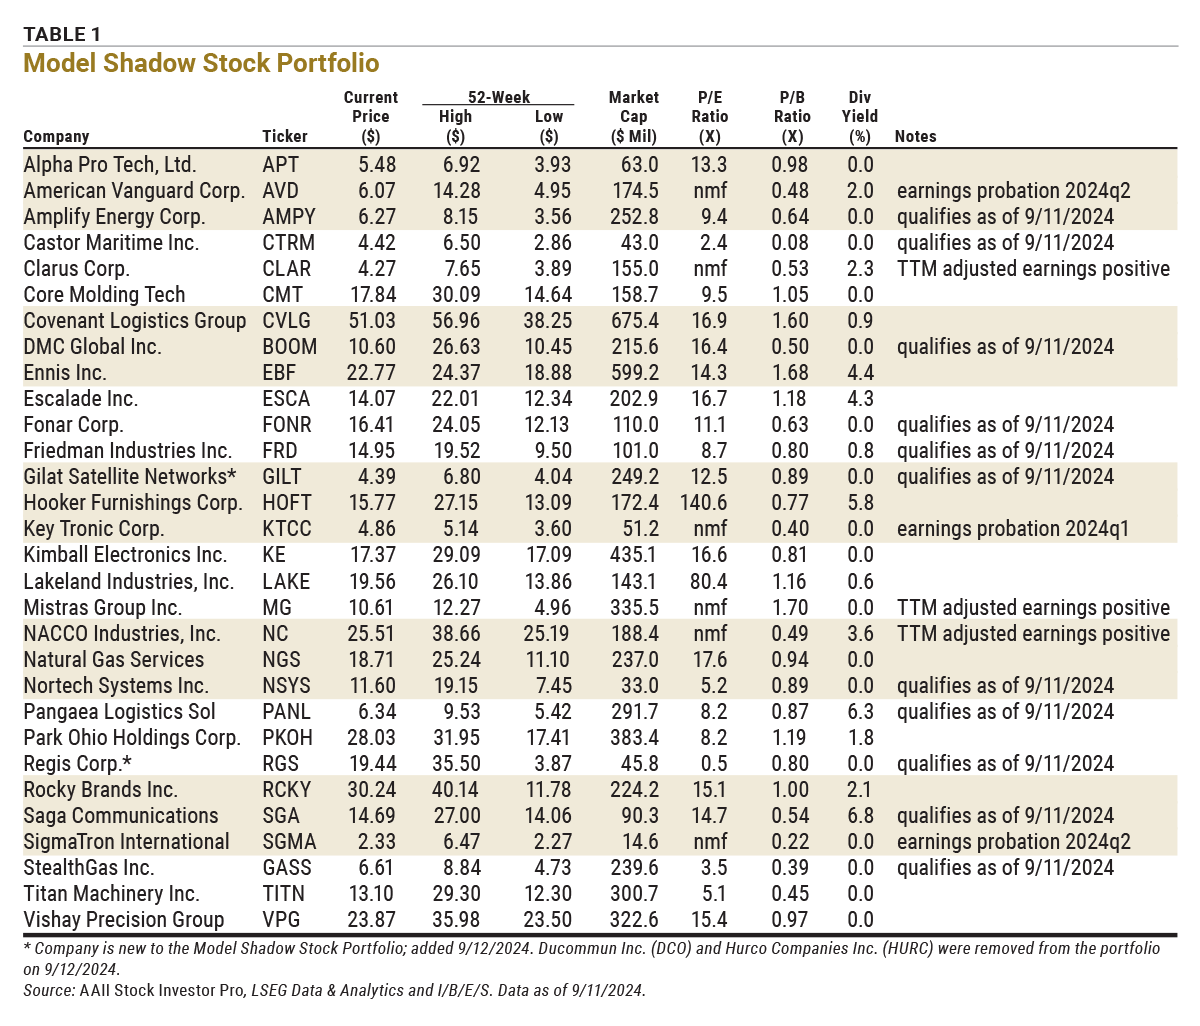
- Approaching Size Limit: Stocks are sold if their market capitalization goes above three times the initial maximum criterion and there is a stock to replace it. The current market capitalization maximum for initial screening is $300 million. Stocks are marked “approaching size limit” if their current market cap exceeds 2½ times the initial criterion, or $750 million.
- Approaching Value Limit: Stocks are sold once their price-to-book-value (P/B) ratio goes above three times the initial criterion and there is a stock to replace it. The current initial price-to-book ceiling is 0.90. Stocks are marked “approaching value limit” if their current price-to-book ratio exceeds 2½ times the initial criterion, or 2.25.
- Earnings Probation: If the last 12 months’ earnings are negative, the stock is put on probation; if a subsequent quarter has negative earnings prior to 12-month earnings becoming positive, the stock is sold. When available, adjusted (non-GAAP) earnings are used to put stocks on probation or remove them. Otherwise, earnings from continuing operations are used. The date is the calendar quarter during which the company first reported negative trailing 12-month earnings.
- Qualifies as of: Stock still qualified as an addition when the screen was run with current data. Stocks that don’t currently qualify as an addition are held until they meet one of the deletion rules.
- TTM Adjusted Earnings Positive: Trailing four-quarter GAAP earnings are negative, resulting in no meaningful figure for the price-earnings (P/E) ratio. However, adjusted earnings for the period are positive.
The review begins with an examination of the prevailing valuation segments of the marketplace. The Model Shadow Stock Portfolio selection criteria target the “cheapest” 10% of domestic stocks as measured by the price-to-book-value (P/B) ratio. The decile breakpoint for value is determined by examining price-to-book levels of domestic companies listed on the New York Stock Exchange (NYSE) and then using the price-to-book breakpoint for stocks listed on all domestic exchanges.
Value Analysis
The price-to-book cutoff has increased slightly from 0.83 in June to 0.85. The current initial qualifying maximum price-to-book ratio is 0.90 and we left it unchanged. Qualifying stocks must have a price-to-book ratio of 0.90 or lower when added to the model portfolio. There are currently 1,170 exchange-listed securities with a price-to-book ratio less than or equal to 0.90, down from 1,197 in June. Stocks in the model portfolio are removed for valuation if they exceed three times the initial maximum price-to-book ratio at the time of a quarterly portfolio review.
Mistras Group Inc. (MG) had the highest price-to-book ratio in the model portfolio of 1.70 as of September 11. No stocks in the model portfolio exceeded the maximum price-to-book ratio at the time of review.
Size Analysis
We examined the market-capitalization levels of domestic companies listed on the NYSE to determine the size cutoff for the lowest decile when adding stocks to the model portfolio. The lowest decile market-cap level increased from $287 million in June to $299 million. We left the maximum initial qualifying market-cap value unchanged at $300 million. There are currently 1,348 exchange-listed securities with a market cap between $30 million and $300 million, down from 1,443 in June. Holdings are removed if their market cap goes above three times the initial criterion at the time of the quarterly review.
Portfolio Deletion: Ducommun Inc.
Ducommun Inc. (DCO) had the largest market cap in the model portfolio of $938.0 million as of September 11, above the $900 million maximum level (3 (AVD) $300 million).
Ducommun is being removed from the model portfolio because it exceeded the maximum market cap at the time of review. Ducommun was added to the Model Shadow Stock Portfolio on March 7, 2012, at a price of $14.97 per share. It was removed on September 12, 2024, at $63.20 per share, for a price gain of 322.2%.
Earnings Analysis
The other factor that leads to portfolio turnover is tied to negative earnings. If a company has negative trailing 12-month earnings from continuing operations, the stock is placed on probation; if a subsequent quarter has negative earnings prior to trailing 12-month earnings becoming positive, the stock is removed from the portfolio.
When available, adjusted (non-GAAP) earnings are used to put stocks on probation or remove them. These are earnings that have been adjusted to eliminate the impact of nonrecurring events such as inventory markdowns or goodwill. These are earnings reported in the press and by firms that compile consensus earnings estimates. The LSEG I/B/E/S adjusted earnings reported in AAII’s Stock Investor Pro fundamental stock screening and research database are used for Model Shadow Stock Portfolio decisions when they are available. If the company is not tracked by LSEG I/B/E/S analysts, then the normalized earnings, as determined by LSEG Data & Analytics and reported in Stock Investor Pro, are used.
During the second quarter of 2024, American Vanguard Corp. (AVD) and SigmaTron International Inc. (SGMA) reported adjusted losses that pushed their trailing 12-month adjusted earnings into the red. They have been placed on earnings probation.
Hurco Companies Inc. (HURC) and Key Tronic Corp. (KTCC) were on earnings probation at the start of the latest earnings season.
Key Tronic went on earnings probation when it reported an adjusted loss of $0.21 per share for its fiscal third-quarter 2024 ended March 30, which pushed its trailing 12-month adjusted earnings into the red. Key Tronic reported an adjusted gain of $0.10 per share for its fiscal fourth-quarter 2024 ended June 29. We will continue to keep an eye on Key Tronic’s earnings.
Portfolio Deletion: Hurco Companies Inc.
Hurco Companies (HURC) went on earnings probation when it reported an adjusted loss of $0.61 per share for its fiscal second-quarter 2024 ended April 30, which pushed its trailing 12-month adjusted earnings into the red. Hurco Companies reported a loss of $1.47 per share for its fiscal third-quarter 2024 ended July 31.
Hurco Companies is being removed from the portfolio due to negative earnings. Hurco Companies was added to the Model Shadow Stock Portfolio on September 6, 2019, at a price of $31.97 per share. It was removed on September 12, 2024, at $17.90 per share, for a price loss of 44.0%.
Quarterly Additions
As of September 11, 22 stocks met the initial selection criteria for the Model Shadow Stock Portfolio, up from 17 last month. AAII members can see and research which companies are currently passing the initial selection criteria in the Shadow Stock Ideas table on AAII.com. The list of new Shadow Stock Ideas is updated daily—Tuesday through Saturday.
Of the 22 qualifying companies, nine were already in the Model Shadow Stock Portfolio at the time of the review. The remaining 13 stocks were examined to ensure adequate liquidity, timely financial filings, and appropriate industry and foreign considerations. The Shadow Stock Portfolio Rules provide guidance on factors to consider when selecting stocks for your portfolio.
With the proceeds from the deletions, as well as the cash held in the portfolio, the portfolio was able to take positions in two new companies.
Portfolio Addition: Gilat Satellite Networks Ltd.
Gilat Satellite Networks Ltd. (GILT) is an Israel-based provider of satellite-based broadband communications. The company operates through three segments: commercial, mobility and services divisions. Gilat Satellite designs and manufactures satellite ground segment and networking communications equipment, which it sells to its customers either as network components—modems, block upconverters (BUCs), antennas—or as complete network solutions (which include hubs and related terminals and services) or turnkey projects. The equipment that the company develops includes commercial very small aperture terminal (VSAT) systems, defense and homeland security satellite communications systems, solid-state power amplifiers (SSPAs), BUCs, low-profile antennas, on-the-move/on-the-pause terminals, and modems. The company’s equipment is used by satellite operators, service providers, telecommunications operators, system integrators, government and defense organizations, large corporations, and enterprises.
Gilat Satellite has a book value per share of $4.96 as of June 30, 2024. If you wish to stay within the 0.90 price-to-book maximum, you should pay no more than $4.46 per share ($4.96 (AVD) 0.90). However, if the stock price has moved up since passing the Shadow Stock screen, you can still purchase the stock unless the price-to-book ratio goes above 1.00, which equates to a price of $4.96 per share. To calculate the maximum purchase price based on the maximum desired price-to-book ratio, multiply the current book value per share ($4.96 for Gilat Satellite) by the maximum price-to-book ratio to be considered for the Model Shadow Stock Portfolio (currently 0.90, or 1.00 for loosened consideration).
Portfolio Addition: Regis Corp.
Regis Corp. (RGS) is a hair care company that franchises and owns hair care salons. The company operates through two segments: franchise salons and company-owned salons. The franchise segment consists of 4,391 salons located mainly in strip center locations and Walmart stores. Franchise salons offer hair care and beauty services and retail products. This segment operates primarily in the U.S., Puerto Rico and Canada. It includes the Supercuts, SmartStyle, Cost Cutters, First Choice Haircutters, Roosters and Magicuts concepts.
Regis has a book value per share of $24.25 as of June 30, 2024. If you wish to stay within the 0.90 price-to-book maximum, you should pay no more than $21.83 per share ($24.25 x 0.90). However, if the stock price has moved up since passing the Shadow Stock screen, you can still purchase Regis unless the price-to-book ratio goes above 1.00, which equates to a price of $24.25 per share.
Next Portfolio Review
The next quarterly review of the Model Shadow Stock Portfolio will take place in early December 2024. Any changes to the portfolio will be announced at the time they are made in a special Model Shadow Stock Portfolio Update email (sign up at www.aaii.com/email).
Discussion
FREE REPORT

JOHN L from NJ posted over 2 years ago:
DAVID R from WI posted over 2 years ago:
You need to log in as a registered AAII user before commenting.
Log InCreate an account