

Related

Portfolio Strategies
Although none of us, or our portfolios, can succeed all the time in all circumstances, we can all strive to improve our fit.

When I was young, my loving parents, hoping to inspire aspirations and dreams, told me that I could do anything if I really tried. The unspoken corollary was that I couldn’t do everything.
As a retiree, I sometimes agonize over some of my more embarrassing career blunders. That’s unsurprising since we feel and remember our failures more than our successes. The more compassionate perspective I’ve tried to embrace is that our successes and failures are largely situational. No one would expect the world’s best tennis player to perform a successful heart transplant, so why would we expect to have thrived in every career situation we ever faced? If we were lucky enough to experience some success and be rewarded, we should be grateful and try to learn from the rest.
Many of us have similarly unrealistic expectations of our investing portfolios. Even if we accept that our balance won’t always go up, we’d like a portfolio asset allocation that works in as many circumstances as possible. Maybe we want it to work just as well when we’re young as when we’re old. Or maybe we want it to give us full returns in a bull market while protecting us from losses in a bear market.
Sadly, portfolios are more like people in this regard. Their performance depends largely on the situation; none are good at everything.
To illustrate, let’s take a look at four very simple-to-implement portfolios that have dramatically different asset allocations:
Why use these allocations? Because they explore a wide range of investments and can be implemented with just one or two funds.
The pure target-date fund allocations are conventional, conservative, one-size-fits-all solutions. Target-date funds are meant to be used for a lifetime. They start with a high equity allocation when retirement is decades away, then shift toward holding more fixed income approaching and entering retirement.
Investors don’t have to use them that way. We can also use target-date funds as a convenient means to invest in a globally diversified portfolio of stocks and bonds. If the allocation we want is in the middle years of the glide path, we will need to change funds periodically to stabilize the allocation, but that’s a once-every-five-years task. That’s how we’ll look at them here: as easy-to-access fixed asset allocations.
The allocations with 50% small-cap value equities, though aligned with academic research, are very different from what many would consider “safe” or “reasonable.” Still, as we’ll see, they have some surprising advantages. Smaller, cheaper (value) companies, as a group, have historically delivered higher long-term returns. Moreover, their returns weren’t synchronized with the market at large, so they provided meaningful diversification.
If you’re young and lucky enough to have a 401(k) with a company match, you are also likely to have access to a target-date fund. You may even find that your employer automatically withholds money and invests in it for you unless you opt out. Given that, one might expect such a fund to have the best historical backtests for accumulation scenarios. Let’s see if that’s true.
The results can be seen in Table 1. The compound annual growth rate (CAGR) and worst drawdown are based on lump-sum backtesting of monthly returns.
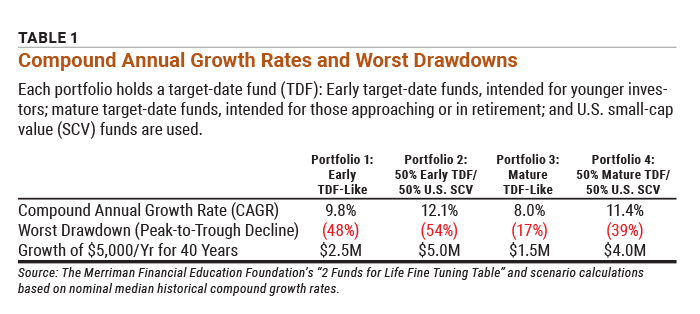
It is easy to see why Portfolio 3, the mature target-date fund allocation, is not the best for a young accumulator since it has the smallest balance after 40 years of saving. It’s harder to see why Portfolio 1, the early target-date fund, is the default investment in many retirement savings plans. Both Portfolios 2 and 4 produced higher growth rates, leading to much higher ending balances. Plus, Portfolio 4 did it with much less risk.
Why then would Portfolio 1 be seen as the prudent default? Two reasons come to mind: convention and compliance.
Employers must offer employees something that will satisfy their fiduciary responsibility and be easily understood by as many employee investors as possible. The target-date fund satisfies both of these requirements. It’s a great choice for the average investor who likely has no idea why it might be advantageous to own a portfolio that behaves differently than the market at large. That doesn’t mean that it’s best for everyone.
For young investors willing to take the time to learn about different equity types, the Portfolio 2 backtest suggests that adding a small-cap value allocation to their portfolio might help. Young investors interested in maximizing their return per unit of risk might even consider Portfolio 4 since it delivered much of the benefit with less risk. In both cases, to be successful, those investors would need to have enough knowledge to provide the conviction to stick with the portfolio through periods of underperformance.
None of these choices are likely to consistently outperform throughout an investor’s investment time horizon. Just like us, the portfolios will do better and worse under different circumstances.
Small-cap value has underperformed expectations for many years now. Does that mean it’s about to outperform? No one can say for sure.
What is certain is that selling assets when they’re underperforming and buying assets when they’re doing well is a great way to lower your returns. In that sense, picking the asset allocation you will stick with is more important than picking the one that’s performed best in the past.
Retirement brings on new concerns. I remember my wife nervously asking shortly after I retired, “Where is the money going to come from?” Transitioning from a regular paycheck to living off of investments can be nerve-wracking.
Most retirees’ first worry is running out of money. In my experience, that concern rarely disappears completely. For oversavers, though, it eventually becomes secondary to their desire to continue growing investments for charity, gifting and legacy.
With that in mind, let’s look at our four portfolios in terms that matter most to retirees: safe withdrawal rates, worst-case drawdowns with regular withdrawals, compound annual growth rates and legacy balances.
Table 2 shows the backtesting results. Once again, the compound annual growth rate and worst drawdowns are based on lump-sum backtesting of monthly returns. The worst drawdowns including cash flows assume that the 5% annual withdrawal is taken in the worst month possible when the account balance is smallest. Finally, the 30-year safe withdrawal rates assume that the percentage is used for the first year’s withdrawal in retirement. Then, that dollar amount is increased by inflation in succeeding years to determine their annual withdrawal amounts. It represents the highest withdrawal rate the portfolio could sustain without running out of money.
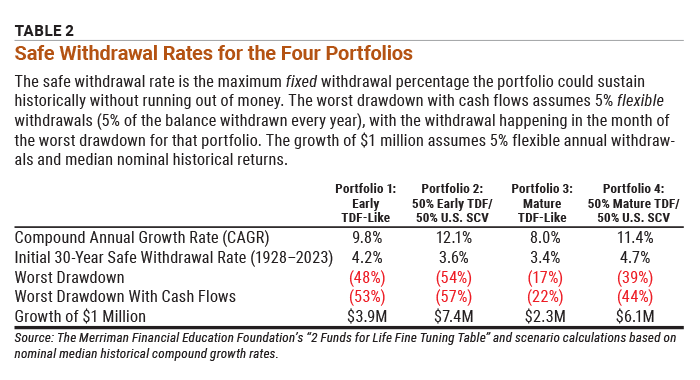
We might expect Portfolio 3 to do the best on these metrics since it is the default investment for many retirees in 401(k) programs. Surprisingly, it has the lowest safe withdrawal rate (3.4%) of all four test portfolios. Admittedly, this allocation isn’t reached until seven years into retirement, so maybe the planners aren’t expecting retirees to live another 30 years at that point.
Regardless, it’s clear that Portfolio 4’s safe withdrawal rate of 4.7% is much higher. That says the portfolio allocation of 50% in a mature target-date fund and 50% in U.S. small-cap value was historically more resilient to sequence-of-returns risk. Put another way, every historical period tested allowed retirees a 17.5% pay increase, compared to the traditional 4.0% fixed safe withdrawal rate, without running out of money.
There was a cost, though. Portfolio 4 was more volatile. It had a 44% worst-case drawdown when taking cash flows, compared to Portfolio 3, with only a 22% decline.
For investors more interested in the smoothness of the ride than in growing their nest egg, Portfolio 3 meets that need. There was a cost for that as well. Since the safe withdrawal rate was lower, there was a higher likelihood of running out of money, especially if you lived longer and used a 4% fixed withdrawal rate. It’s not an obvious choice since we don’t know how long we’ll live.
For the oversaver whose concern for running out of money takes a back seat to growing their legacy, Portfolio 2 might be the preferred choice from this set. Alternatively, perhaps that’s what they’d choose for the part of their portfolio they know they won’t spend.
It all comes down to what an investor needs, wants, and can tolerate in terms of risk and reward.
We’ve discussed the ends, but what about the middle?
Many investors adjust their portfolios nearing retirement. Typically, this is the point where our invested assets are becoming large and we become more concerned with losing them than growing them. It’s also the point when we start to wonder if we have enough to retire. Potential drawdowns or losses loom large since they represent the possibility of suddenly needing to work longer and retire later.
So, which of our test portfolios best meets the needs of an investor approaching retirement?
It’s tempting to jump straight to Portfolio 3 since it has the smallest historical drawdown, –17% (without cash flows), but it also had the lowest compound annual growth rate of 8.0%.
Though it’s not one of our examples, the typical allocation for a target-date fund five years before retirement has had a drawdown risk of –31% with a compound annual growth rate of 9.0%. That’s probably comfortable for many investors, but for investors willing to take a little more risk for a higher expected return, Portfolio 4 might be better. It had a 2.4 percentage-point higher return at 11.4%, with a –39% worst-case drawdown. Yes, that introduces a higher uncertainty in the size of their nest egg at retirement, but it also introduces a higher likelihood of it growing.
Any of these three options could be a reasonable choice for someone approaching retirement.
For someone who’s lived with a target-date fund up until this point and has confidence in it, the five-years-to-retirement target-date fund represents moderate risk and reward.
For someone with enough money to retire who is primarily concerned with protecting their wealth, Portfolio 3, the mature target-date fund, offers relative safety and security.
Portfolio 4 offers the highest historical return with a small increase in risk, but it’s not for everyone. Being that different requires conviction, and conviction comes from knowledge. For the investor willing to study and learn from past returns, the increase in expected returns might be worth the increase in risk.
Considering every circumstance is impossible, so we have created a table exploring an even wider range of allocations using a target-date fund and a U.S. small-cap value fund. You could implement these portfolios with individual stocks and bonds, but it’s a lot easier to use exchange-traded funds (ETFs) and mutual funds.
The table includes the allocations and backtests we have used in this article and others that use different target-date fund vintages and U.S. small-cap value allocations.
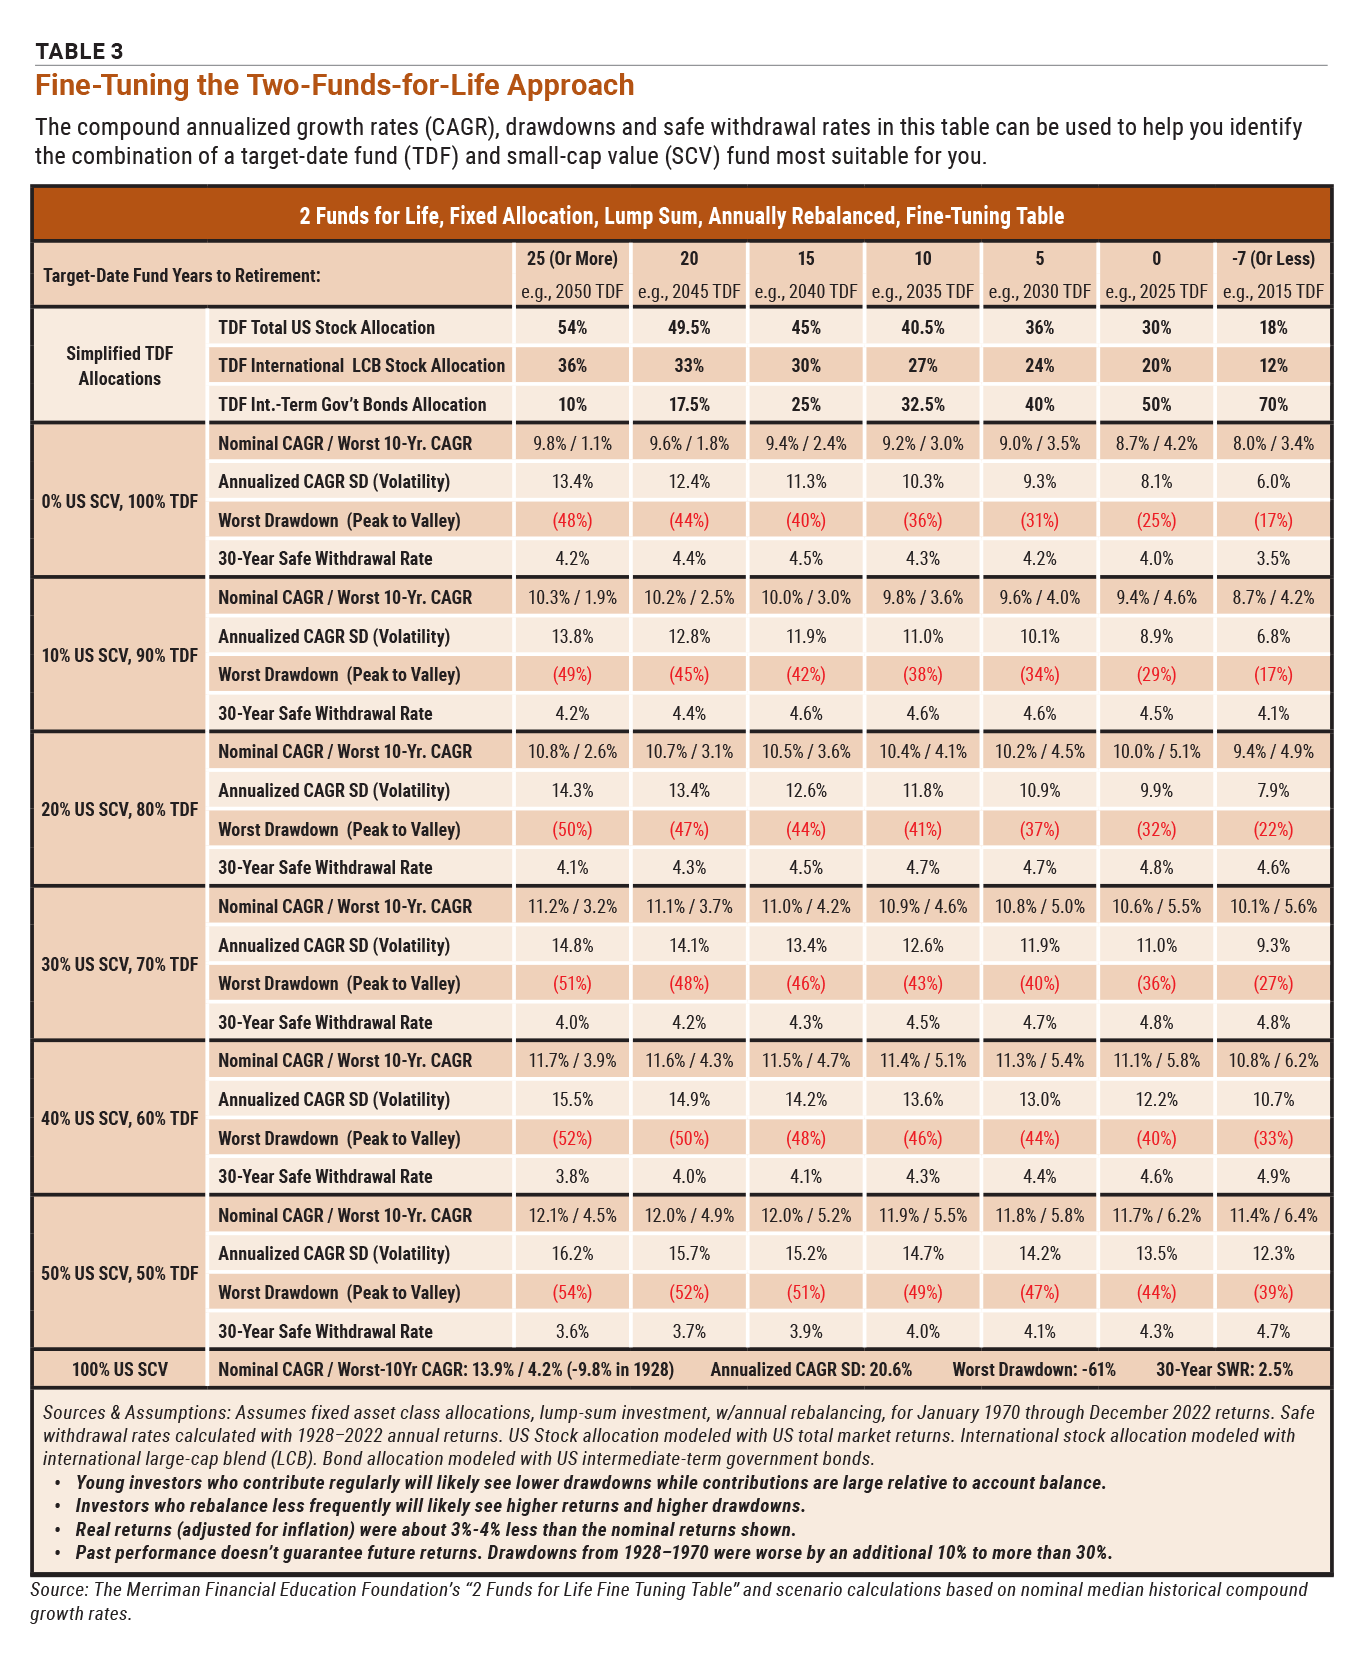
Whether you decide to use two funds or many to invest, the lessons in Table 3 might help you choose an allocation to meet your needs. Asset allocations matter. They determine the returns and volatility we are likely to experience and the portfolio’s resilience to sequence-of-returns risk (see safe withdrawal rates).
Although none of us, or our portfolios, can succeed all the time in all circumstances, we can all strive to improve our fit.
Individually, we can adapt and grow. We can celebrate our successes and learn from our mistakes.
We can’t optimize our investment portfolios for everything, but we can tune them for what we need. We can be patient with them when they experience drawdowns and stick with them, knowing their time to thrive again will likely come.
Whether you use one, two or over 50 funds or stocks, you have a lot of control over the amount of risk you take, the kind of returns you can expect and the resilience you’ll likely experience.
Perhaps the greatest lesson is that it helps to zoom out to see the big picture, whether for our personal successes and failures or for those of our investments. For most of us, the big picture is positive. Yes, the market might be down today, but the longer we’ve been invested, the more likely it is that our long-term return will be positive. That is something to be grateful for and a source of conviction to stay the course, which should lead to higher returns.
Portfolio Strategies



CRAIG B from WI posted almost 2 years ago:
ROBERT A from NC posted almost 2 years ago:
BARRY J from TX posted almost 2 years ago:
JIM L from MI posted almost 2 years ago:
STEPHEN B from MA posted almost 2 years ago:
Greg F from AR posted over 1 year ago:
You need to log in as a registered AAII user before commenting.
Log InCreate an account