


Related

ETFs and Mutual Funds
Active bond mutual funds and ETFs can be an effective part of an investor’s fixed-income toolkit.

In the ongoing interest rate environment, bond funds can provide a source of portfolio income for investors. The yields offered by the actively managed bond mutual funds and exchange-traded funds (ETFs) featured in this article exceed the dividend yield of most stocks.
We chose to focus on actively managed bond funds because of the complexities within the bond market. Changing market conditions, difficulties with fully replicating bond indexes and identifying specific opportunities can be advantageous for active managers. Though not all active managers outperform, there are active bond mutual funds and ETFs with A+ Investor Grades of A (top 20%) and B (top 21% to 40%) for their year-to-date, three-year and five-year returns.
Active managers can make changes in anticipation of or reaction to changes in monetary policy and the credit cycle. Fixed-income markets are fragmented, with trading volumes varying widely from bond to bond. Thus, price dislocations can exist and be exploited by active managers.
Differences exist between bonds. A basic fixed-income allocation can be likened to a camel-colored blazer in a wardrobe. It is an essential component of a well-diversified portfolio, offering income, capital preservation and a buffer against overall stock market volatility. Those who prefer to take fashion risks with a more colorful blazer can improve their portfolio income by holding funds targeting bonds with lower credit quality. Similarly, those who prefer fast fashion can opt for short-term bond funds that are more sensitive to interest rates.
We used AAII’s mutual fund and ETF screeners to identify active fixed-income bond funds. For mutual funds, we limited the universe to true no-load funds available in share classes that individual investors can purchase. We placed an emphasis on seeking funds with higher yields.
Performance and costs were also considered. All funds were required to have A+ Investor Grades of C or higher (average or better) for five-year net asset value (NAV) returns. For mutual funds, the expense ratio is required to be between 0% and 40% (least expensive). We loosened the expense ratio requirements for ETFs to eliminate those funds with expense ratios ranked in the most expensive 20% in order to include more ETFs. All ETFs were also required to have an average daily trading volume of greater than 5,000 shares.
Yield is calculated as income for the most recent 12 months divided by the month-end NAV. The average yield for the mutual funds shown in Table 1 is 5.4%. The average yield for the ETFs shown in Table 2 is 5.5%.
Yield for bond funds reflects both the duration (interest rate sensitivity) and credit quality of the bonds they hold. AAA/AAa is the highest credit rating, while ratings of CCC/Caa or lower are given to bonds whose issuers are at risk of missing payments or are in default. It is not unusual for bonds in lower-rated funds to be backed by mortgages, auto loans or credit card receivables.
Expense ratios for active fixed-income mutual funds are higher than their passive counterparts. The average actively managed bond mutual fund included in Table 1 has an expense ratio of 0.49%. Five mutual funds have expense ratios of just 0.10%: they are all Vanguard funds with varying strategies.
The average actively managed bond ETF included in Table 2 has an expense ratio of 0.36%. The iShares Ultra Short-Term Bond Active ETF  (ICSH) has the lowest expense ratio at 0.08%.
The tax-cost ratio measures how much a mutual fund or ETF’s annualized return is reduced by federal taxes investors pay on distributions. The TCW Flexible Income ETF (FLXR) has the highest tax-cost ratio of any fund listed in Table 1 or Table 2 at 2.9%.
The fixed-income mutual funds in Table 1 represent a variety of categories with yields ranging from 4.2% to 10.3%.
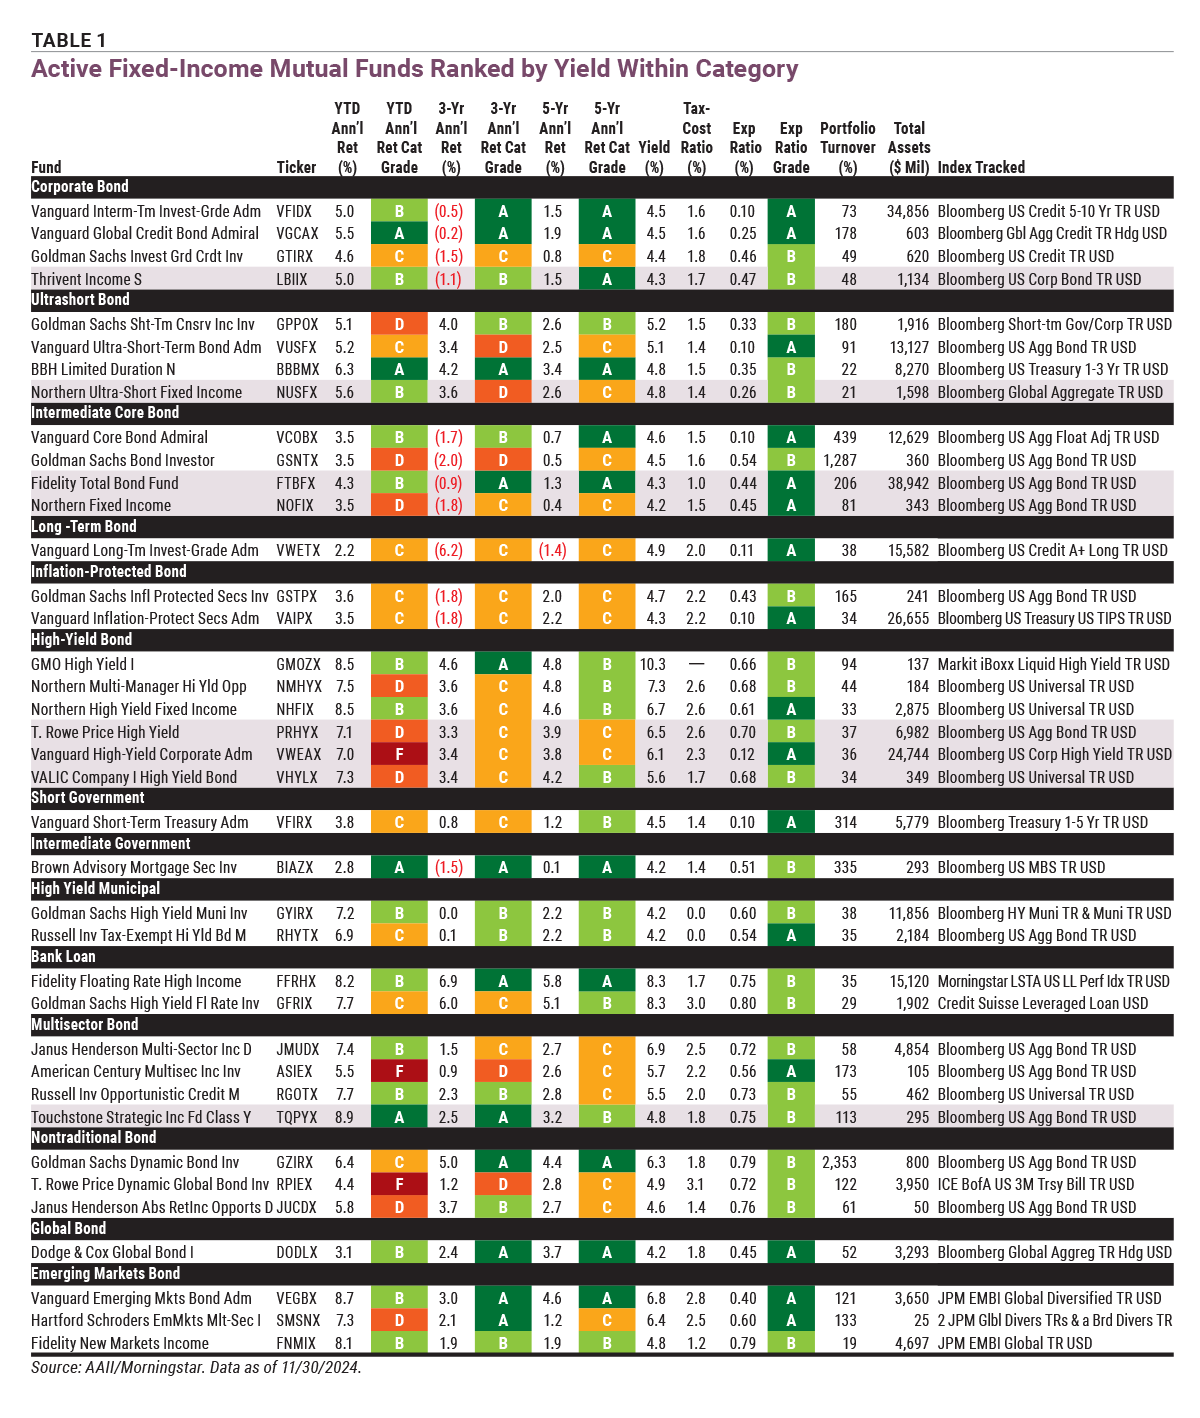
Download the Excel spreadsheet of Table 1.
The GMO High Yield Class I fund (GMOZX) is the highest-yielding mutual fund. Its 10.3% yield is also well above the 6.3% average for its high-yield bond peers. The fund follows a quantitative approach, seeking to capture what GMO describes as “structural market inefficiencies.”
The majority of its holdings have issuers with either a BB (51.5%) or B (35.4%) credit rating. These ratings are at the top end of the non-investment-grade range. Such issuers are judged to be at greater risk of missing interest payments in the future relative to their investment-grade counterparts. Investors are compensated for this added risk with higher yields.
Bank loan mutual funds are the other high yielders in Table 1. Bank loan funds are made up of senior secure loans made by banks. The interest payments of these loans are floating and are typically reset every 30 to 90 days. Senior loans hold priority over all unsecured claims and are either senior to or on equal footing with other secured claims. In the event of bankruptcy, senior loans, along with other first-lien claims, have the right to be repaid first from the proceeds of the assets securing the loans.
The two funds in the bank loan category, the Fidelity Floating Rate High Income fund (FFRHX) and the Goldman Sachs High Yield Floating Rate Investor fund (GFRIX), both yield 8.3%. The Fidelity Floating Rate High Income has a lower expense ratio and better performance over the year-to-date, three-year and five-year periods shown. The Goldman Sachs High Yield Floating Rate Investor also ranks worse when it comes to taxes. Its tax-cost ratio of 3.0% is the highest of all mutual funds listed in Table 1.
Multisector bond funds are known for providing diversification. Since they are not tied to any specific sector, their holdings can vary greatly. The Janus Henderson Multi-Sector Income Class D fund (JMUDX) looks for what it considers to be the best risk-adjusted opportunities across fixed-income sectors. Its largest allocation (as of November 30) is to mortgage-backed securities, followed by asset-backed securities and high-yield corporates. The fund’s credit rating exposure mostly ranges from top-tier Aaa to non-investment-grade B. A very small percentage of its portfolio is in very high-risk Caa and Ca bonds.
In contrast, the largest holding for the Touchstone Strategic Income Fund Class Y fund (TQPYX) is U.S. Treasury notes (28.8%) followed by investment-grade corporate bonds (27.2%). This fund sticks mostly to investment-grade bonds, with less than 15% of its portfolio in non-investment-grade bonds.
The two high-yield municipal bond funds in Table 1 have 0.0% tax-cost ratios. Interest paid by municipal bonds is exempt from federal tax, which the ratio considers, and state taxes in the state the bond was issued. The Goldman Sachs High Yield Municipal Investor fund (GYIRX) seeks income across the credit spectrum. It has high allocation to non-rated bonds (45%), likely due to the decision by the issuing municipalities not to have their bonds rated.
The Russell Investments Tax-Exempt High Yield Bond Class M fund (RHYTX) has a similar yield, though its year-to-date return lagged that of the Goldman Sachs High Yield Municipal Investor (6.9% versus 7.2%). Its exposure to non-rated bonds is 33.2%.
The nontraditional bond category uses strategies that may have limited constraints on exposure to credit, sectors, currency or interest-rate sensitivity. Three of the funds are included in Table 1. As an example, the T. Rowe Price Dynamic Global Bond Investor fund (RPIEX) seeks to offer some protection against rising interest rates and provide a low correlation with the equity markets.
Funds and ETFs within this category are only actively managed, thus high expense ratios and tax-cost ratios are characteristic. The T. Rowe Price Dynamic Global Bond Investor carries an expense ratio of 0.72%. Though this expense ratio seems high compared to other mutual funds, it is below average for the category.
Yields for active fixed-income ETFs in Table 2 range from 3.9% to 8.3%. Similar to the mutual funds, the highest-yielding ETFs are in the bank loan and high-yield bond categories.
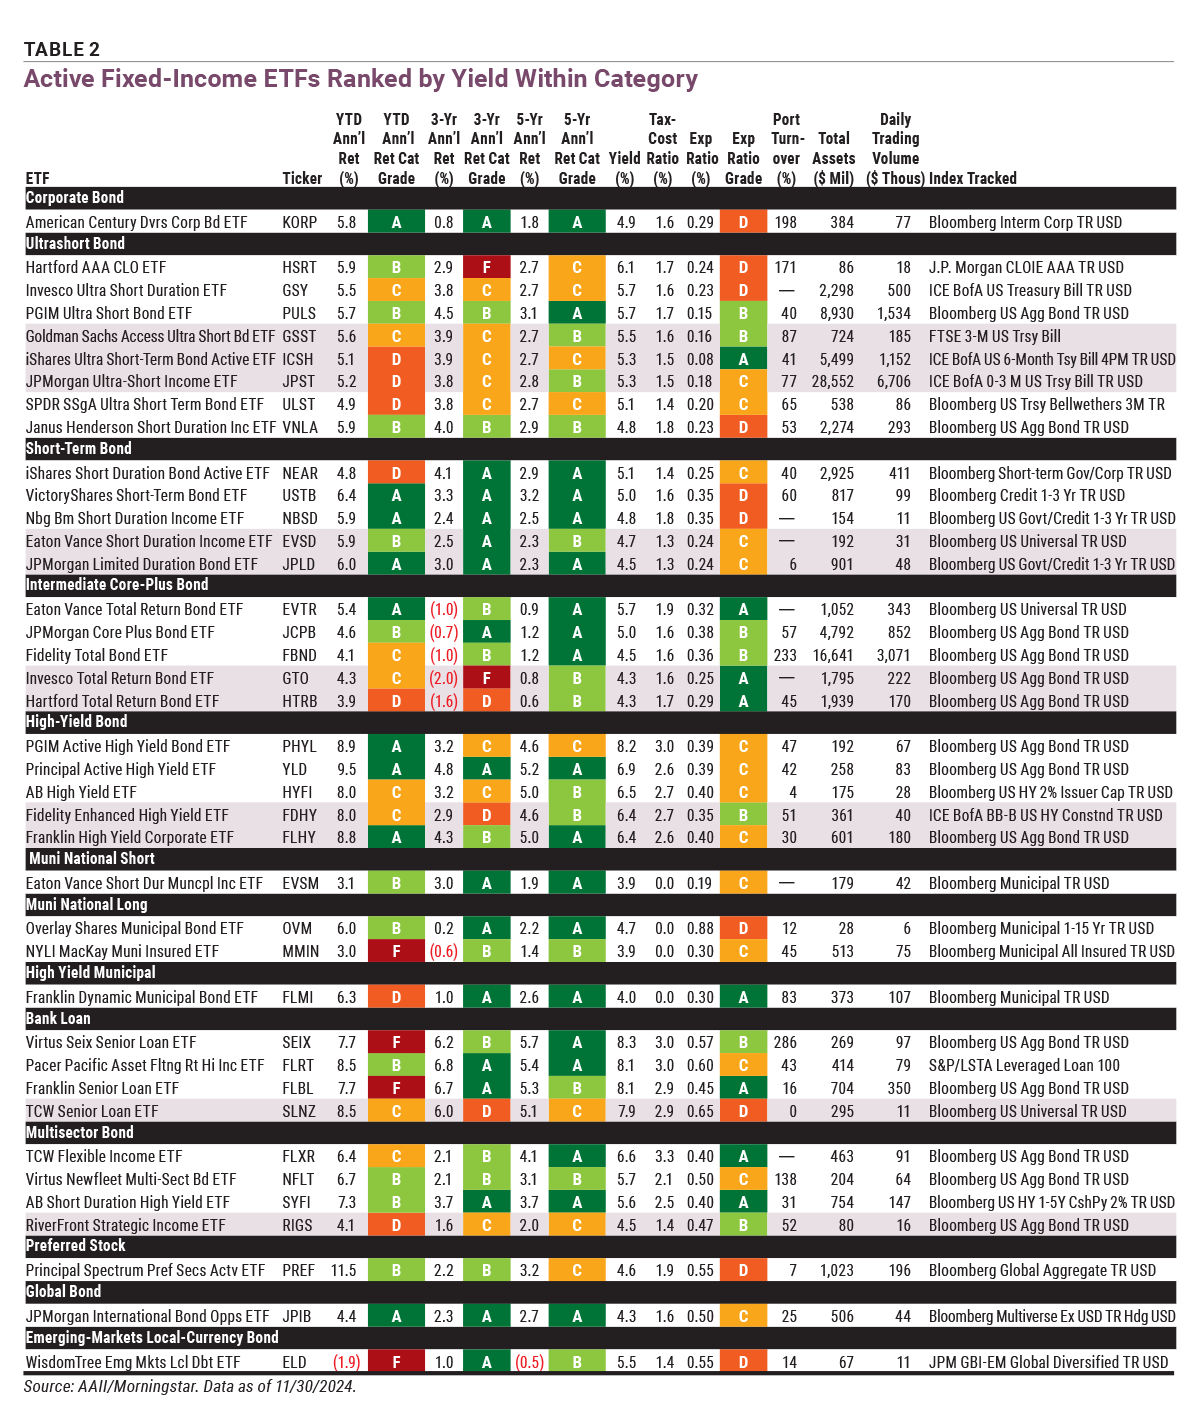
Download the Excel spreadsheet of Table 2.
The Virtus Seix Senior Loan ETF (SEIX) yields 8.3%. The ETF invests in senior-secured, floating-rate leveraged loans. Its largest allocation (62%) is to B-rated debt. A credit rating of B is two notches below investment-grade. Its weighted average maturity of 3.81 years implies the ETF’s managers are focused on short-term debt.
The bank loan category, which the Virtus Seix Senior Loan belongs to, carries high tax-cost ratios. The Virtus Seix Senior Loan’s tax-cost ratio is 3.0%. The TCW Flexible Income, which has the highest tax-cost ratio of all ETFs and mutual funds listed at 3.3%, is in the multisector bond category. Though ETFs are generally tax-efficient, these two funds show that this is not universally the case.
ETFs aren’t all cheap when it comes to expense ratios. The Overlay Shares Municipal Bond ETF’s (OVM) expense ratio of 0.88% is the highest of the funds in both tables. The fund takes a unique approach with an “overlay” that generates cash through index option investing.
Its yield of 4.7% is below the 5.5% average for the ETFs shown in Table 2, but the tax-cost ratio is 0.0%. This results in the ETF’s tax-equivalent yield (which adjusts yield for taxes on the income) to be higher than some other ETFs that hold taxable bonds. The fund has $28 million in assets, which is the smallest in Table 2.
We’ll point out that most of the ultrashort bond ETFs included in Table 2 have yields above 5% as of the end of November. These funds are very sensitive to changes in interest rates. The JPMorgan Ultra-Short Income ETF (JPST), which is the largest ETF listed with assets of almost $28.6 billion, yields 5.3%. More than 60% of its portfolio is allocated to bonds maturing in less than one year.
Investors should understand that the liquidity of the securities held within ETFs is important. It may be difficult for ETF managers to trade their bonds quickly depending on the type of bond and prevailing market conditions.
ETFs and Mutual Funds

ETFs and Mutual Funds

ETFs and Mutual Funds

Kevin J from TX posted almost 2 years ago:
JOHN C from MA posted almost 2 years ago:
ROBERT A from NC posted almost 2 years ago:
DAVID H from NV posted over 1 year ago:
TOM G from VA posted over 1 year ago:
You need to log in as a registered AAII user before commenting.
Log InCreate an account