Returns for Asset Class Groups: Big Back-to-Back Gains for Large-Cap Stocks

For the first time in nearly a quarter of a century, large-cap stocks rose by more than 20% during each of the last two years.

Charles Rotblut leads a class in AAII's new Essential Investing Video Course. Go to https://www.aaii.com/ves for more information and to subscribe.

Featured Tickers:

Large-cap stocks rose by more than 20% during both 2023 and 2024. This was the first time large-cap stocks have done this in nearly a quarter of a century. It was also just the ninth time they have realized such back-to-back gains over the past 100 years.

Annual returns for large-cap stocks are displayed below in the royal blue boxes on the updated “heat map.” Their returns are based on the performance of the Vanguard 500 Index Admiral fund (VFIAX). The heat map shows how the returns for the seven asset class groups that comprise the AAII Asset Allocation Models have compared over the past several years. 

Each asset class group is ranked by its calendar-year performance in descending order from left to right. The groups are color coded so you can track their relative performance.

Returns for large-cap stocks following the previous eight occurrences of consecutive 20% gains have been mixed. Large-company stocks fell during four of the years that followed such periods: 1929, 1937, 1977 and 2000. During the other four years—1944, 1952, 1956 and 1984—large-company stocks rose by single- and double-digit percentages.
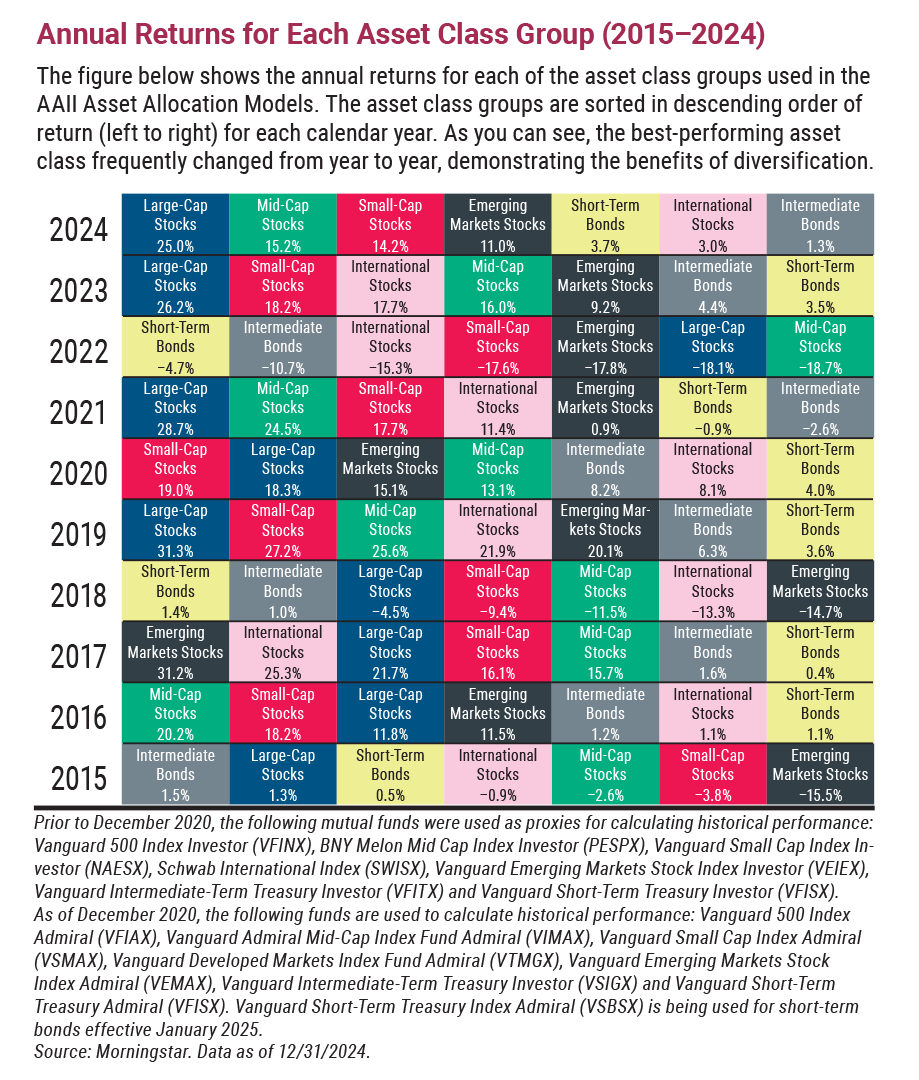
Annual Returns for Each Asset Class Group (2015–2024)  The figure below shows the annual returns for each of the asset class groups used in the AAII Asset Allocation Models. The asset class groups are sorted in descending order of return (left to right) for each calendar year. As you can see, the best-performing asset class frequently changed from year to year, demonstrating the benefits of diversification.

While we, or anybody else, cannot predict what the future will bring, we can share some insights.

A small number of stocks drove the S&P 500 index’s return in 2024. Nvidia Corp. (NVDA) accounted for 22.4% of the large-cap index’s return. The S&P 500’s 10 largest stocks account for 37.0% of the index’s total market capitalization—the highest in many decades.

Meanwhile, small-cap stocks remain extraordinarily undervalued relative to large-cap stocks. International stocks are undergoing their longest streak of underperformance relative to U.S. stocks in decades. U.S. large-cap stocks also trade at a significant premium relative to foreign stocks.

While U.S. large-cap stocks could continue to outperform this year, a reversion back toward historical norms would result in mid-cap, small-cap and international stocks outperforming. Though the timing of such a shift is unknown, diversifying your portfolio increases your odds of being in the right asset class and asset class group at the right time.

The mutual funds used to track the AAII Asset Allocation Models have been updated to include the Vanguard Short-Term Treasury Index Admiral fund (VSBSX) for the short-term bond allocation. 

Discussion

BARRY J from TX posted over 1 year ago:

Charles, I am deducting one attaboy merit badge from your career total for not showing AAIIers how to use this wonderful visual tool to reinforce HOW anyone can use this model and the minimalist DATA provided to CALCULATE the VALUE of DIVERSIFICATION for their own portfolio. Here’s what a lazy person like me would do. VISUAL METHOD: (a) Assume you will buy a SPX tracking US Total Stock Market Fund as your large-cap proxy to “anchor” your portfolio to market beta (the variation in the overall market; this alone eliminate up to 90% of variation which is the proxy for “risk.”) (b) Using the handy color codes, eyeball (compare) the relative returns for the PAIRS for each asset class to identify which of the two choices provide the highest return. There are only 7 classes. You have already selected your anchor ETF. (c) Now, you only have decide which of the 2 choices provided in each remaining 3 GENERAL asset classes -- (US equities) choose Mid-cap or Small-cap; (Ex-US equities) chose INTL or EM, and chose 1 of the 2 ST-bond ETFs. (d) The selection criteria you choose to use is up to you (higher return, lower variation, lower cost, etc.). Using this “pair-wise” elimination method, you will end up with 4 funds - #1 TSM (your SPX anchor ETF), #2 non-LG cap equity ETF “tilt” that increases exposure to large cap returns; #3 International equity (developed or emerging) ETF to increase diversification (note: the degree of variation risk is very important here), and #4 short-term bond ETF to increase diversification. (e) Congratulations, you just maximized your portfolio diversification. You increased the probability that you have found the most efficient portfolio on the “efficient frontier” curve that balances YOUR preferences for the levels of RETURN (variation) and RISK (variation). There was no math involved, and no one got hurt. (f) You have also created a personalized version of "The 4-fund portfolios" that several experts have recommended in AAII articles. (g) PS. You could easily add some math to this process if that increases your confidence in your choices. Just compare the returns DATA in each box. Remember your goal is to achieve the highest returns AND highest diversification possible. (h) Note: You have just applied the core principles of Modern Portfolio Theory without having to read a single page of any academic paper full of sigmas and tables of data and math. (i) Thank Charles for this gift. He just saved you from being pushed in front of the train (in the picture) driven by a professional financial advisor whose kids need new cars and straight teeth. "Curses, foiled again" as every villain says at this time in the movie. PS I am giving Charles his attaboy back. I feel like such an evil villain if I don't.


Alexander B from CAN posted 7 months ago:

Okay can you send me some cash flow it's Alexander bull


Alexander B from CAN posted 6 months ago:

How do I get my etf cash flow cheqeus or funds into my bank account last time they said 46 percent of everything please email me


You need to log in as a registered AAII user before commenting.
Create an account

Log In

Get your free copy of our special report analyzing the tech stocks most likely to outperform the market.

Download the FREE Report Here: