


Related



Portfolio Strategies
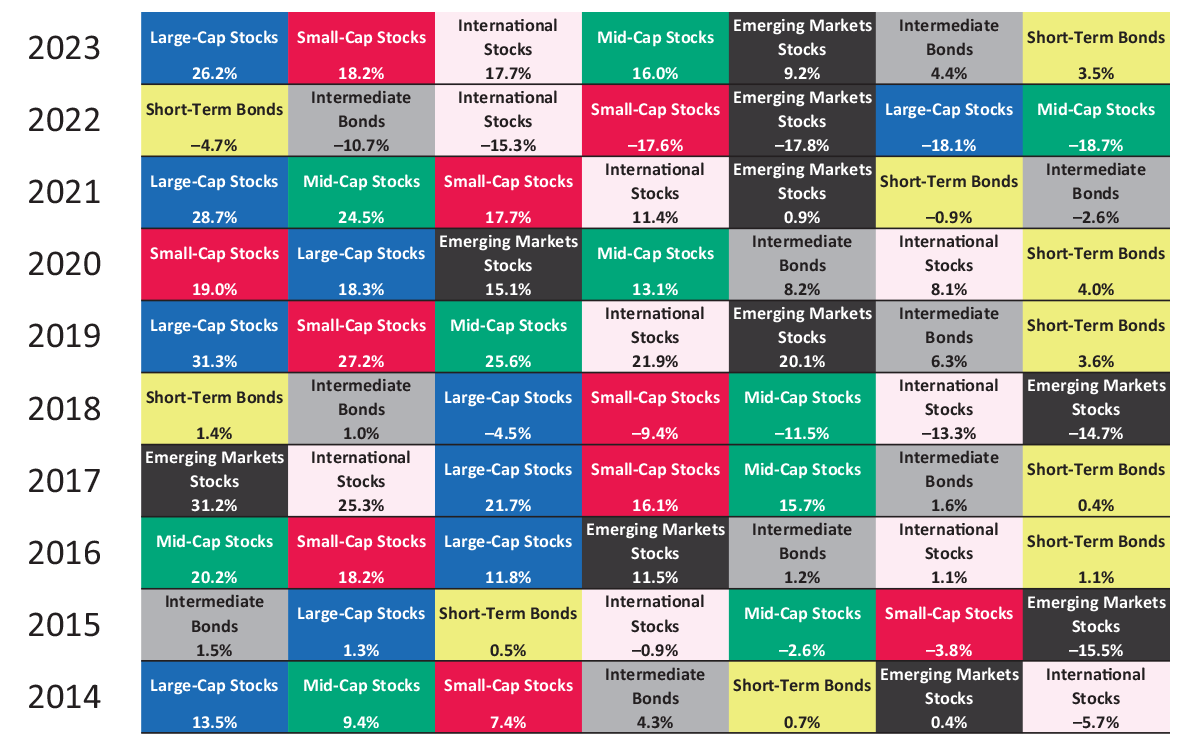
The rebound in 2023 is very evident in the heat map of the calendar-year returns for the seven major asset class groups.

Charles Rotblut leads a class in AAII's new Essential Investing Video Course. Go to https://www.aaii.com/ves for more information and to subscribe.
Last year’s rebound is very evident in the updated “heat map” displayed below (Figure 1). This heat map shows the calendar-year returns for the seven asset class groups that comprise the AAII Asset Allocation Models. Each asset class group is ranked by its calendar-year performance in descending order from left to right. The groups are color-coded so you can track their relative performance over time.
Figure 1. Annual Returns for Each Asset Class Group (2014–2023)
The figure below shows the annual returns for each of the asset class groups used in the AAII Asset Allocation Models. The asset class groups are sorted in descending order of return (left to right) for each calendar year. As you can see, the best-performing asset class frequently changed from year to year, demonstrating the benefits of diversification.
Prior to December 2020, the following mutual funds were used as proxies for calculating historical performance: Vanguard 500 Index Investor Class  (VFINX), BNY Melon Mid Cap Index Investor Class (PESPX), Vanguard Small Cap Index Investor Class (NAESX), Schwab International Index, Schwab International Index (SWISX) and Vanguard Emerging Markets, Stock Index Investor Class (VEIEX), Vanguard Intermediate-Term Treasury Investor Class (VFITX) and Vanguard Short-Term Treasury Investor Class (VFISX).
As of December 2020, the following funds are used to calculate historical performance: Vanguard 500 Index Admiral Shares (VFIAX), Vanguard Admiral Mid-Cap Index Fund Admiral Shares (VIMAX), Vanguard Small Cap Index Admiral Shares (VSMAX), Vanguard Developed Markets Index Fund Admiral Shares (VTMGX), Vanguard Emerging Markets Stock Index Admiral Shares (VEMAX), Vanguard Intermediate-Term Treasury Investor Class (VSIGX) and Vanguard Short-Term Treasury Admiral Shares (VFISX).
Source: Morningstar.
Large-cap stocks led all groups for the third time in five years. A small number of stocks were mostly responsible for the group’s leadership in 2023. As of the end of December 2023, the 10 largest stocks in the S&P 500 index accounted for 86% of the index’s return. Those same stocks also accounted for 32.1% of the S&P 500’s total market capitalization—the largest percentage since at least 1996 according to J.P. Morgan Asset Management.
Short-term bonds went from best to worst. After incurring the smallest loss in 2022, the asset class group realized the smallest gain in 2023. While the current high yields on short-term bonds and cash-like instruments have appeal, such instruments offer very little to no opportunity to profit from capital appreciation.
Small-cap stocks ranked second in 2023, and international stocks ranked third. Small-cap valuations relative to large-cap valuations are unusually low. International stocks, meanwhile, have underperformed domestic large-cap stocks for a longer-than-typical stretch.
While differences among asset class groups tend to revert toward their historical norms over time, predicting when this will happen is extremely difficult. Diversification offers the advantage of increasing the odds of being allocated to the right asset class group at the right time.
Longer periods of time smooth out the year-by-year fluctuations you see in the heat map. Over longer periods, stocks provide long-term growth of capital while bonds—particularly when held to maturity—provide preservation of capital. This difference allows them to complement each other within the context of a diversified portfolio.
Ultimately, your goals and tolerance for risk should drive your allocation decisions, not recent performance data or expectations of what will happen next.
Portfolio Strategies

ROBERT A from NC posted over 2 years ago:
BARRY J from TX posted over 2 years ago:
You need to log in as a registered AAII user before commenting.
Log InCreate an account