


Related

PRISM Wealth-Building Process
Actionable steps to improve your odds of successfully reaching your goals when a down market affects your portfolio.

Charles Rotblut leads a class in AAII's new Essential Investing Video Course. Go to https://www.aaii.com/ves for more information and to subscribe.
Anytime a bear market occurs—as it did in 2022—many investors feel that they have taken a step back in terms of reaching their goals (potentially a big step back). This is particularly the case following a year when it seemed like there were few areas to hide.
We explain how to determine whether you are on or off track in terms of reaching your goals. We also suggest actionable steps you can take to increase your odds of reaching them. It all starts with taking a deep breath and realizing that what the market takes away it often gives back.
An all-too-often-used strategy to assess progress toward goals is to simply look at your portfolio balance. Doing so gives you a snapshot of where you currently are, but it fails to provide a broader picture upon which you can make important decisions.
You can get this broader picture with the M step of the PRISM Wealth-Building Process (Figure 1). This is the final step, called Monitoring Your Progress. Specifically, it prompts to you review three key things:
Reviewing your allocation tells you whether your current asset class exposure is within a reasonable range of your target allocation. We suggest applying a percentage band to your allocation targets to allow your portfolio some room to fluctuate. For example, if your allocation calls for putting 20% of your portfolio into mid-cap stocks, you could allow your exposure to range between 15% and 25% before acting to adjust it. If your allocation is outside of your desired range, rebalance your portfolio back to the target.
Figure 1. PRISM Wealth-Building Process

Progress toward your goals is measured by where your current portfolio balance is relative to what should be expected given your savings rate, expected rate of return and expected range of volatility. The last part, volatility, matters in a down market because it may mean that your portfolio remains within an expected range even though its balance has fallen. Put another way, your portfolio could be down but potentially not off track. We discuss how to make this determination.
Changes in your life can have a bigger impact than allocation or progress. A change in your family status—such as a birth, adoption, divorce or death—can be reason to reassess your goals and determine if they are still relevant or need to be revised. The same applies when there has been a change to your or a family member’s health. An unplanned interruption in employment affects your ability to save. Such an event would put you off track. We offer suggestions for getting back on track once you are back to earning a paycheck.
Diversification felt like it didn’t work in 2022. The Vanguard Balanced Index Admiral fund  (VBIAX), with roughly the benchmark allocation of 60% stocks and 40% bonds, was down 13.6% year to date as of the end of November 2022. The last time the 60%/40% approach fared worse was in 1974.
Stocks fell into a bear market, while bond yields rose to their highest level in over a decade. Other asset classes and asset class categories also fell in value, such as real estate investment trusts (REITs). Even cryptocurrencies—once touted as protection against high inflation—fell.
Diversification didn’t fail, it just incurred a bad year. Assets that historically have reduced correlations or are generally uncorrelated can still move in the same direction over shorter periods of time. Such occurrences don’t mean diversification is broken. Rather, it simply means certain factors coincided to cause several asset classes to fall.
Last year, we saw rising inflation, disruptions to the global supply of grain, oil and natural gas caused by Russia’s invasion of Ukraine, aggressive monetary tightening by the Federal Reserve and a strengthening U.S. dollar. This all occurred as bonds started 2022 with historically low yields and U.S. stocks started the year by trading at all-time highs. Goldilocks’ porridge turned from tasting just right to tasting rancid in a matter of months.
Investors with a long-term time horizon should not be fazed by this. The stock market has fallen in value approximately once every four calendar years. The bond market experiences less volatility, but still encounters down years too: Intermediate-term government bonds have declined, on average, once every nine calendar years since 1929.
If you maintained your allocation and continued to save or withdraw in accordance with your long-term plan, it is very possible that you remain on track to achieve your goals. You may, however, need to adjust your portfolio back closer to its target allocation. Part of the monitoring process is ensuring that your portfolio remains reasonably close to your desired long-term allocation.
If you abandoned your target allocation—such as by pulling out of stocks—then you may well be off track. The stock market’s best days tend to occur close to the market’s worst days. Miss those best days and you may forfeit wealth. As Matt Markowski wrote in the Stock Superstars Report last year, “If you stayed invested in the S&P 500 from the start of 1928 through March 9, 2022, you would have earned 23,987.2%.” Staying out of the market during the best 10 days—which tend to occur close to the market’s worst days—“would have dropped your return to 7,864.5%.”
There are a few things you can do. One is to return to your target allocation if it remains valid. The PRISM Risk Tolerance worksheet can help you determine whether your previous allocation was the right one or if you need to change it. (See the Wealth-Building Process Toolbox.)
Investors who pull out of the market over fear about further losses occurring may be following an allocation that was too aggressive for them. The optimal allocation is always the one you can stick with no matter what the market is doing. An allocation with a lower potential return can create more wealth than an allocation with a higher potential return if the volatility of the latter is greater than you can withstand.
Those saving for a goal can increase how much is set aside to fund the goal. Savers may also wish to postpone the intended date of the goal, if possible. Doing so will create more time to save and more time for your portfolio to recoup its lost value.
Those in the withdrawal phase can reduce how much they take out from their portfolios to the extent their finances allow. If your withdrawals match required minimum distribution (RMD) amounts, reinvest part of the RMD amount. Variable withdrawal and spending strategies have been shown to help retirees protect their portfolios during down markets.
Additionally, consider an allocation to safe assets. AAII’s Level3 withdrawal strategy is one such approach. It calls for allocating up to four years of planned withdrawals to cash or cash-equivalent investments.
Preservation of capital is the key to this approach: Whenever the market is down at least 5% from its high, withdrawals are taken from the safe assets bucket. This helps you to avoid selling growth assets, such as stocks, when their prices are depressed. (See “Level3 Withdrawal Strategy Goes Into Defensive Mode” in this issue for more on the Level3 withdrawal strategy.)
Maintaining an allocation to cash and cash equivalents can psychologically help those in the wealth accumulation phase as well. While including such a bucket will reduce long-term returns relative to an all-equity portfolio, it may provide reassurance during down markets. It also provides a source of funds investors can use to buy equities when the stock market is down. Even AAII’s model aggressive allocation allows room for some allocation to safe assets (a 10% weighting).
While you shouldn’t judge progress toward your goals by looking at your portfolio balance on a given day—and we don’t recommend looking at the balance frequently—monitoring it on set intervals (e.g., annually) can help you assess your progress toward your goals. The key is what you do with the information.
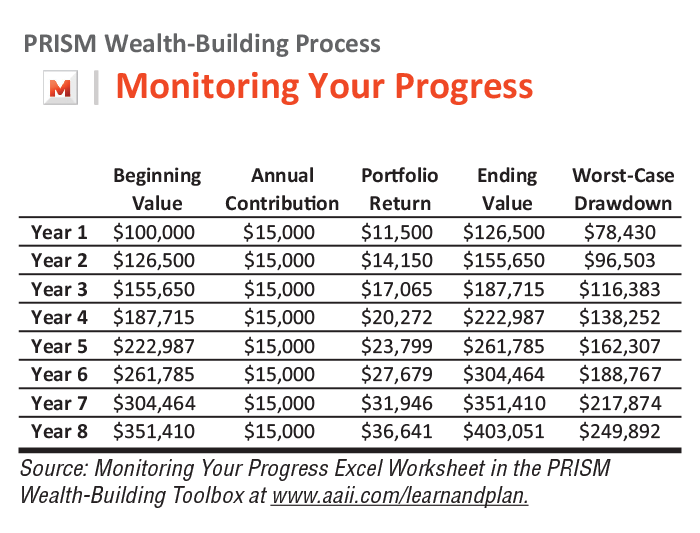
Included in the PRISM Academy is the Monitoring Your Progress worksheet. This worksheet gives you a range of the expected variance in your portfolio given an expected return, worst-case drawdown and either a savings or withdrawal rate. (Also available in the Wealth-Building Process Toolbox.) The AAII Asset Allocation Models provide suggested numbers, though you can use your own estimates as well.
The worst-case drawdown is the maximum drop in your portfolio’s value you should expect given your allocation (Figure 2). If your portfolio balance is above this number, then it is reasonable to expect your portfolio to bounce back to being fully on target if you stick with your allocation and have enough time to let your portfolio recover.
Figure 2. Determining Whether Your Portfolio Is on Track
The Monitoring Your Progress worksheet in the PRISM Academy can be used by those who are in the accumulation (saving) phase or in the withdrawal phrase to judge whether their portfolio is within the expected ranges of fluctuations. The table below assumes annual contributions of $15,000 and a 10% return with a maximum expected drawdown of 37%. On average, the S&P 500 index has recovered from “garden variety” bear markets in about 14 months, according to CFRA Research chief investment strategist Sam Stovall. “Mega-meltdown” bear markets, defined as drops in excess of 40%, have taken much longer: The S&P 500 needed an average of 58 months to recover from the last three.
On average, the S&P 500 index has recovered from “garden variety” bear markets in about 14 months, according to CFRA Research chief investment strategist Sam Stovall. “Mega-meltdown” bear markets, defined as drops in excess of 40%, have taken much longer: The S&P 500 needed an average of 58 months to recover from the last three.
A rebound is never guaranteed, however. Increasing your saving, reducing the size of portfolio withdrawals and/or delaying the timing of your goals all boost the odds of achieving your goals. The worst-case scenario section of the worksheet simply tells you if the drop in your portfolio value is within the boundaries of the expected variance for your chosen allocation strategy.
Life happens, sometimes in unpleasant ways. Layoffs can occur in even favorable job market environments. Medical issues can lead to unplanned large bills. Large, unexpected expenses can occur—such as storm damage or several large repair bills in a short period of time (e.g., your furnace and car suddenly both need to be replaced).
Following such instances, revisit your goals. Particularly, look at the priorities and timelines you listed in the P step of the PRISM process—Prioritizing Your Goals—or otherwise have written down. Ask yourself whether your goals are still important, whether their respective timelines are still achievable and if there is flexibility to adjust them.
Your first step may be to push back the timing of the goal. Say you had intended to retire at age 65. If you lost your job or there was some other disruption to your ability to save, could you work to age 67 or 70? Doing so would give you more time to rebuild your savings, more time for your portfolio to grow in value and better odds of not outliving your savings.
Postponing retirement also gives you the ability to delay when you claim Social Security. Every year you postpone claiming, the size of your benefits increases by approximately 8%. If your spouse intends to claim on your earnings record, delaying also increases the size of their benefits. A larger Social Security check reduces the amount you need to save for retirement.
If delaying isn’t an option or you are too financially far from achieving your goals, ask yourself what modifications can be made. Could you reduce how much you plan to spend on the goal?
In the case of retirement, perhaps you pay for less of your child’s college expenses or retire to a less expensive place. Alternatively, consider if you could help fund your goal through other sources such as by working part time in retirement.
There may also be cases where the goal is simply aspirational, like having a summer home. Labeling it as such can be freeing because it removes the stress of feeling that you have to achieve it. The “prioritizing” part of the PRISM process asks you to consider what is important, what must be achieved and what would be nice but not a requirement.
In cases where the goal is a requirement but not financially achievable, there aren’t many good choices. You simply have to save as much as you can, postpone the goal as long you can and seek out sources of non-portfolio income (e.g., wages from working) to help you fund it to the best of your abilities.
Regardless of whether you are on or off track to reach your goals, there are things you can do improve your odds of successfully reaching them.
The first is to save more. Consistently increasing the amount you contribute to your savings and investment accounts is one of the most effective things you can do if you are in the accumulation/savings phase.
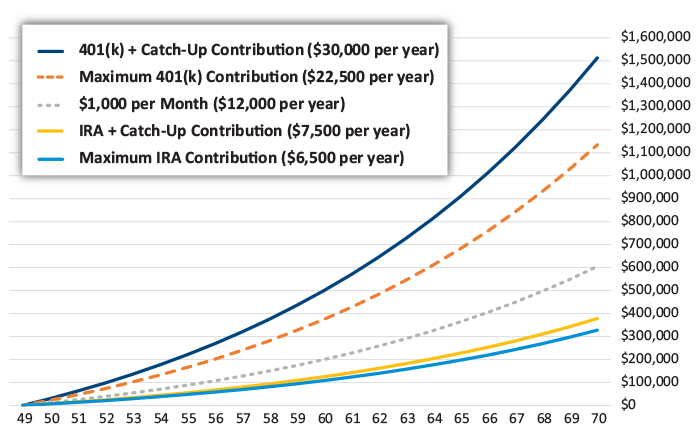
In 2023, workers can contribute up to $22,500 to a 401(k) plan ($30,000 if age 50 or older). Those with earned income can contribute up to $6,500 in a traditional or Roth IRA, $7,500 if age 50 or older). Figure 3 illustrates the impact on your wealth at retirement by saving at these maximums even if you start later in life. The contribution limit for health savings accounts (HSAs) is $3,850 and $7,750 for individual and family coverage, respectively ($4,850/$8,750 if age 55 or older up until enrolling in Medicare).
Figure 3. Even at Age 50, There Is Time to Build Retirement Savings
The data below assumes a starting balance of $0, annual contributions and an 8% annualized rate of return. Expenses are excluded. The ability to both stay fully invested and consistently save will significantly impact the actual wealth realized at retirement. Savings contribution limits are set at 2023 levels. The $1,000 per month portfolio represents an “in-between” measure for those not able to save the maximum 401(k) amounts.
As previously stated, reducing the size of withdrawals can help those of you in the withdrawal phase protect your portfolios during down markets. Though the tax code requires you to take distributions from most retirement accounts each year (except from Roth IRAs), you don’t have to spend it all. A banded approach where you allow your spending to rise or fall by a certain percentage relative to the previous year can be effective.
Controlling which assets you withdraw funds from also helps. An allocation to safe assets will give your growth assets time to recover from down markets as previously discussed. Alternatively, you could tap other sources such as a reverse mortgage or a life insurance policy if you own such financial products and doing so makes sense for you.
Finally, and most importantly, take a long-term view. The financial markets will ebb and flow—sometimes by large magnitudes. The approach you take to managing your portfolio shouldn’t.
PRISM Wealth-Building Process

Retired Investor


Scott W from TX posted over 3 years ago:
Morrie W from AR posted over 3 years ago:
BARRY J from TX posted over 3 years ago:
JOHN L from NJ posted over 3 years ago:
Emilio K from MN posted over 3 years ago:
BARRY J from TX posted over 3 years ago:
ROBERT A from NC posted over 3 years ago:
Peter N from TN posted over 3 years ago:
WILLIAM S from ID posted over 3 years ago:
You need to log in as a registered AAII user before commenting.
Log InCreate an account