


Related

ETFs and Mutual Funds
These nontraditional equity funds use options contracts to offer downside protection, but potential gains are limited.

Many investors crave stability and comfort. This year’s elevated level of volatility and steep correction are leading some to seek out strategies that promise to manage downside risk while remaining invested in the market. Defined-outcome investment products, also known as buffered or overlay products, are becoming a popular choice to meet this need. According to VettaFi, defined-outcome, or buffered, exchange-traded funds (ETFs) garnered a record $5.6 billion of inflows during the first quarter of 2025.
Designed to deliver preset investment outcomes over defined time periods, these newer ETFs help guard against stock market losses. However, the protection comes with complexity and limits on potential gains. Defined-outcome products use equity options to achieve their results. They appeal to investors who want to reduce their downside risk exposure when making an investment. ETFs and, to a much lesser degree, mutual funds have made these options-based strategies accessible to individual investors.
Each fund has a defined “outcome period,” typically 12 months, during which the return profile is based on the price movement of a reference index like the S&P 500 index or the Nasdaq-100 index. Annual resets of the outcome period are the most common, but some ETFs reset every two years, every six months, every quarter or even every month. Key structural features include buffers, caps and floors.
Defined-outcome strategies typically work by buying put options on a market index. A put option contract gives its owner the right—but not the obligation—to sell the index at a predetermined price. The option’s strike (exercise) price is the maximum downside.
At the same time, these strategies sell call options. A call option contract gives its owner the right to buy the index at a specific price. Selling call options with an exercise price greater than the market price limits the investor’s upside in exchange for creating income that is used to fund the protection.
Flexible exchange (FLEX) options or over-the-counter (OTC) options are customized contracts that allow for tailored strike prices and expiration dates. The expiration of options contracts coincides with the end of the outcome period, with all options contracts expiring simultaneously.
Zero-coupon bonds are occasionally employed in these products to ensure principal preservation. These bonds, purchased at a discount, mature at full face value and provide a base level of capital stability. Zero-coupon bonds pay no interest.
The timing of when returns are realized is everything to the buyer of a defined-outcome fund. Investors must purchase the product on the reset date and hold it through the entire outcome period—often one year—to achieve the defined return range. The cap, buffer and floor are reset based on market conditions at the end of each outcome period.
The exception to this rule is the handful of laddered defined-outcome funds that have a staggered and continuous strategy. These funds provide investors who enter at any time exposure to a mix of buffered strategies at different stages. Portfolio turnover is much higher in laddered products compared to funds with an annual reset or outcome period.
Buffer ETFs and mutual funds do not have maturity dates like the defined-maturity bond ETFs offered by Invesco, BlackRock and State Street Global Advisors. Instead, investors must choose their own exit date. The amount you receive when selling your mutual fund or ETF shares will reflect the current market price of the reference asset and the values of the underlying options. [Differences between the share price and the net asset value (NAV) will also affect ETF returns.]
Your needs and preferences for the reference asset (the reference index), buffer, cap and reset date will influence the choices available. Most issuer websites have valuation information, including pricing and returns for both the fund and the reference asset, as well as cap rates, the protection level and the number of days remaining in the outcome period for the fund.
Several buffer metrics may be available to investors. A remaining buffer refers to the portion of the original buffer that is still available to absorb market losses during the remainder of the outcome period. The downside before buffer or floor is the percentage that the reference asset would need to fall from its current level before the buffer begins to offer protection.
Because defined-outcome funds rely heavily on options, they do not generate yield or cash flows, such as dividends or interest. Instead, returns are derived purely from changes in the underlying index’s price. For example, if the S&P 500 rises 8% during the outcome period and the fund has a 10% cap, the investor captures the full 8%. If the market drops 5% and the fund has a 10% buffer, the investor experiences no loss.
Since buffer ETFs and mutual funds typically do not make distributions, they are highly tax-efficient during the holding period. Owning a fund for more than one year makes the investment eligible for the lower long-term capital gains rate versus the higher marginal tax rate on short-term capital gains.
Depending upon the issuer, the caps stated may be reduced by the fund’s expense ratio. The issuer’s website, fact sheet or prospectus will provide this information. Make sure you read these materials.
Defined-outcome products don’t identically mirror their reference index or asset throughout the outcome period. Instead, the buffer, floor and cap protections only apply at the end of the period, when the options contracts mature. During the period, the ETF’s market price can move outside of the stated buffer or cap range, since those protections aren’t guaranteed until the outcome period concludes.
Morningstar categorizes buffer ETFs and mutual funds as nontraditional equity defined outcome. As of April 30, 2025, this category has 389 ETFs with $63.2 billion in assets. There are two mutual funds with a combined $478 million in assets.
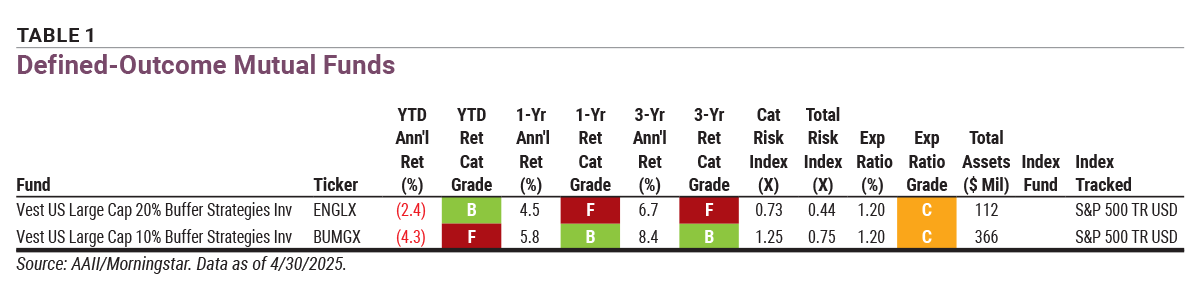
We used AAII’s Mutual Fund and ETF Screeners to identify defined-outcome funds. Among no-load, noninstitutional mutual funds, there are only two defined-outcome funds available in share classes that individual investors can purchase (Table 1).
Download the Excel spreadsheet for Table 1.
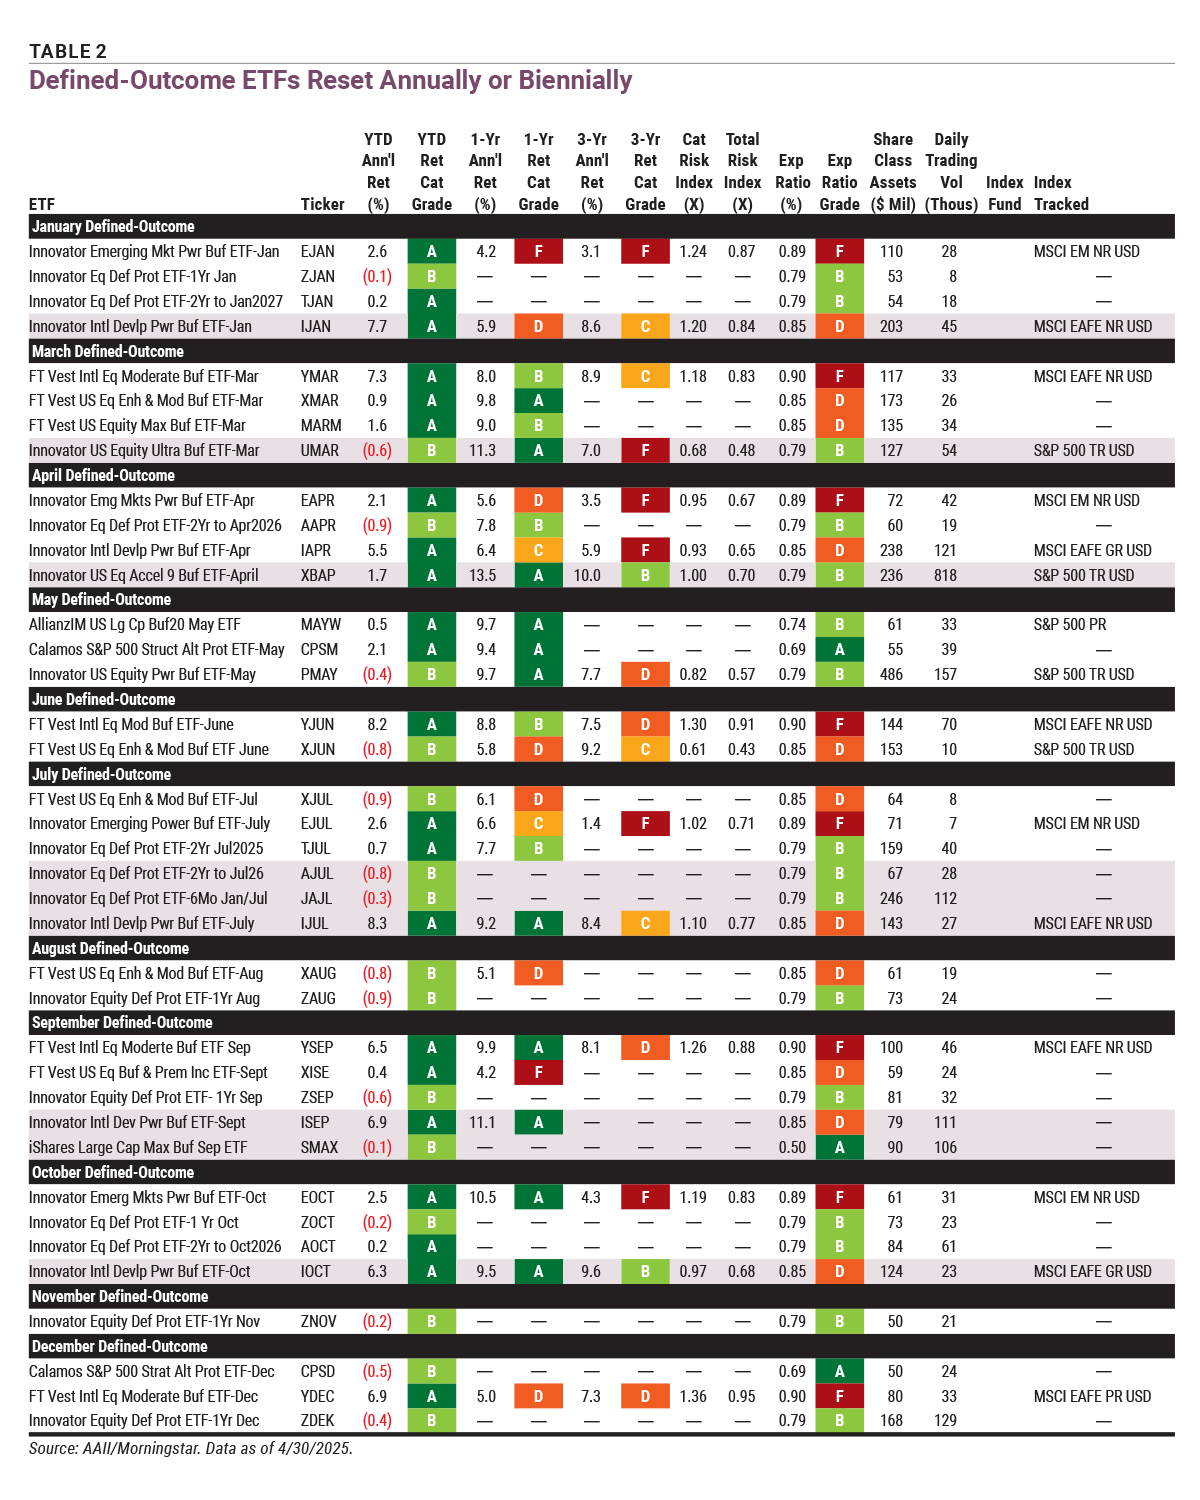
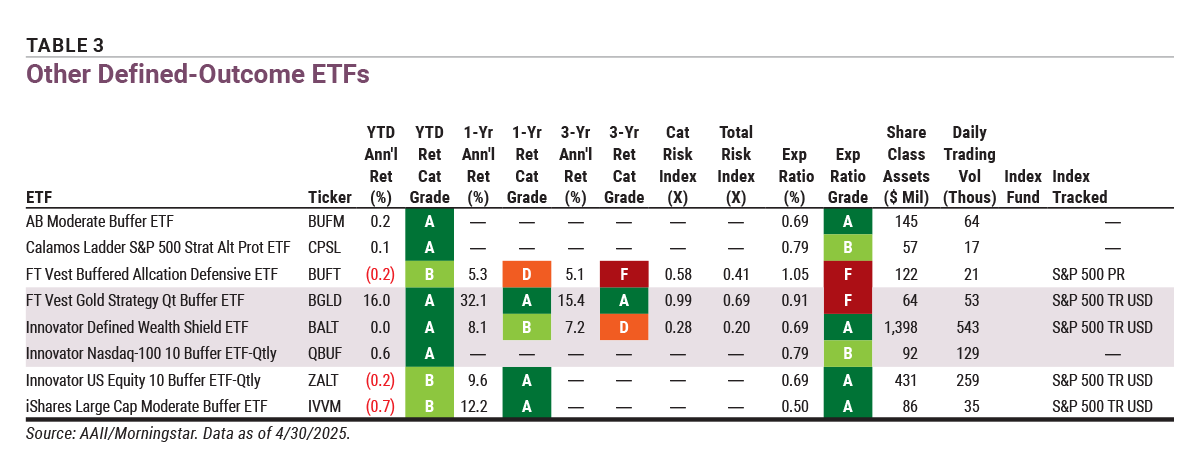
The buffer ETFs in Tables 2 and 3 were required to have an average daily trading volume greater than 5,000 and share class assets greater than $50 million. From there, we sorted on year-to-date return, filtering in those with the best performance. Table 2 displays ETFs that reset annually or biennially grouped by their reset month. The reset month is included in each ETF’s name. Note that there are no ETFs with a February reset date shown in Table 2. The year-to-date performance for all 11 of the February ETFs was below the threshold for inclusion in the table. Table 3 shows ETFs that reset at some other interval or use a laddered strategy.
Download the Excel spreadsheet for Table 2.
All mutual funds and ETFs featured in the tables are actively managed. This helps to explain why their expense ratios are higher than what investors typically pay with index funds. The average expense ratio for the 389 nontraditional equity defined-outcome ETF universe is 0.77%. The expense ratio for both mutual funds is 1.20%, which is average for the category.
Download the Excel spreadsheet for Table 3.
Both defined-outcome mutual funds utilize a laddered portfolio of 12 buffered strategies, each with its own monthly outcome period. Each strategy is initiated at a different time, forming the ladder. Each strategy consists of call and put option contracts on the SPDR S&P 500 ETF  (SPY). Every month, the call and put options contracts expire for one of these strategies. A new one-year buffer strategy replaces the expiring one, ensuring that the fund continuously adjusts to prevailing market conditions.
The Vest US Large Cap 20% Buffer Strategies Investor fund (ENGLX) assumes gains or losses for an investment in each monthly strategy based on holding the investment for one year. The first 20% of downside losses is protected on an annualized basis, and the cap level is set at the start of the one-year period. Additionally, if the price of the mutual fund decreases by more than 20% over that one-year period, investors will incur a total loss that is 20% less than the percentage decrease in price. The maximum loss investors will incur is approximately 80%.
The Vest US Large Cap 10% Buffer Strategies Investor fund (BUMGX) works similarly but with a 10% buffer.
Both mutual funds have negative year-to-date returns as of April 30. On a one-year basis, returns lag the SPDR S&P 500 by more than a factor of two times.
Providers in this niche area offer ETFs with differing reset periods, reference indexes/assets and levels of downside protection and upside gains. Most provider websites have tools to narrow choices based on your preferred reference index/asset, buffer, cap and outcome period.
The most common reference index used is the S&P 500, with the SPDR S&P 500 typically serving as the reference asset. Other common reference indexes include the Nasdaq-100, with the Invesco QQQ Trust ETF (QQQ) serving as the reference asset, and the Russell 2000 index, with the iShares Russell 2000 ETF (IWM) serving as the reference asset.
The FT Vest International Equity Moderate Buffer ETF June (YJUN) resets annually. Its reference asset is the iShares MSCI EAFE ETF (EFA). This First Trust ETF aims to shield investors from the first 15% of losses in the iShares MSCI EAFE over the defined outcome period, provided shares are held for the entire duration. It intends to match any price gains in its reference asset up to a 16.41% cap.
The FT Vest U.S. Equity Enhance & Moderate Buffer ETF June (XJUN) is a similar ETF seeking to provide approximately twice any positive price return of its reference asset, the SPDR S&P 500. Gains, however, are capped at 10.7%. (The SPDR S&P 500 has a 10-year annualized return of 12.2%.) Year to date as of April 30, this First Trust ETF has a –0.8% return. It returned 5.8% for the one-year period, underperforming the SPDR S&P 500’s 12.0% return for the same period.
Despite the difference in reference assets and general strategies, these First Trust ETFs subtract the expense ratio from the buffer. This differs from the Innovator ETFs in Table 2, which subtract the expense ratio from the cap. Expense ratios are above average (expensive) for the two June First Trust ETFs. They will reset on June 20, 2025.
The Innovator Equity Defined Protection ETF 2Yr to Jul26 (AJUL) resets its buffers and caps every two years. The ETF was listed in July 2024, and its reference asset is the SPDR S&P 500. This Innovator ETF offers a 100% buffer and a cap (before fund fees and expenses) of 18.2%.
Innovator also offers ETFs with a 100% buffer that reset every six months, such as the Innovator Equity Defined Protection ETF 6Mo Jan/Jul (JAJL). This ETF has a cap of only 3.75%. Expense ratios for these Innovator ETFs are below average (inexpensive) for the category.
In Table 3, the Calamos Laddered S&P 500 Structured Alt Protection ETF (CPSL) incorporates a laddered approach holding monthly Calamos S&P 500 Structured Alt Protection ETFs. The Innovator Defined Wealth Shield ETF (BALT) is an example of a buffer ETF with a quarterly reset. The current outcome period began on April 1, 2025, and ends on June 30, 2025.
Defined-outcome ETFs and mutual funds are best incorporated as an equity asset into a broader diversified portfolio. They should be considered within the context of the returns a diversified portfolio typically provides.
For those transitioning into retirement, these strategies could be used to reduce downside risk in cases where preserving capital is more important than maximizing returns. Defined-outcome funds do allow for continued market participation but with limited upside. However, investors who are willing and able to sit tight during periods of volatility are better off holding traditional equity ETFs, mutual funds and individual stocks.
Issuers tout that volatile or overvalued equity markets—where uncertainty is high and valuations are stretched—offer opportunities for defined-outcome ETFs. During these periods, capping the upside will be the trade-off investors incur for limiting potential losses. However, the buffer would provide little to no protection in a flat market environment, while a higher expense ratio would reduce what would already be a small return. In addition, investors who sell such funds before the reset or buy in the middle of the outcome period are likely to experience different results than the fund’s stated objective.
Despite recent record growth, many of these ETFs have relatively low levels of assets. Many were recently launched and thus lack a track record. Between Tables 2 and 3, the ETF with the most assets is the Innovator Defined Wealth Shield. Its $1.4 billion in assets also ranks second in terms of all defined-outcome ETFs currently available. The FT Vest Laddered Buffer ETF (BUFR) is larger at $6.4 billion but was excluded from the table due to its underperformance. Keep an eye on trading volume as well when looking at defined-outcome ETFs.
Tax considerations also come into play when evaluating defined-outcome funds. Defined-outcome ETFs with zero yield are better suited for taxable accounts, where the distribution of interest and dividend income would be a taxable event. Defined-outcome ETFs sold after being held for more than one year could generate long-term capital gains or losses. Defined-outcome mutual funds with potentially higher internal turnover may fit better in tax-advantaged accounts like individual retirement accounts (IRAs).
These strategies do have critics. AQR Capital Management found that options-based investment strategies, including buffered and defined-outcome funds, have generally failed to deliver superior risk-adjusted returns compared to simpler approaches. The firm found that most options-based funds did not outperform a basic strategy that combined equities and cash.
In their March 21, 2025, paper “Rebuffed: A Closer Look at Options-Based Strategies,” AQR Capital stated that two-thirds of all options-based funds produced lower returns and incurred higher risk than a straightforward allocation of 70% passive equities and 30% Treasury bills between January 1, 2020, and January 31, 2025.
ETFs and Mutual Funds

ETFs and Mutual Funds

AAII How-To

ROBERT A from NC posted over 1 year ago:
TERRENCE C from IL posted over 1 year ago:
CRAIG B from WI posted over 1 year ago:
Helmut F from GA posted over 1 year ago:
BARRY J from TX posted over 1 year ago:
DAVE G from TX posted over 1 year ago:
DAVE G from TX posted over 1 year ago:
DAVE G from TX posted over 1 year ago:
DAVE G from TX posted over 1 year ago:
HAROLD S from ME posted over 1 year ago:
You need to log in as a registered AAII user before commenting.
Log InCreate an account