Revisiting the Use of ETFs to Construct an S&P 500 Portfolio

Comparing the performance of an equally weighted sector portfolio against an S&P 500 index fund over a 20-year period.

  • The information technology sector has the largest impact on S&P 500 index performance due to its high market capitalization weighting
  • Over 20 years, a rebalanced portfolio of 11 sector ETFs outperformed the S&P 500 in a retirement withdrawal scenario
  • Equal weighting and annual rebalancing lead to better long-term results and lower volatility compared to market-cap-weighted index funds

The S&P 500 index is comprised of 11 sectors, but they are not equally weighted. In fact, not even close.

The sector that currently has the largest impact on the S&P 500’s return is information technology (Table 1). As of March 31, 2025, this sector represented 29.6% of the market capitalization of the entire S&P 500. As a result, the stocks categorized in the information technology sector (currently 69 companies) determine nearly 30% of the entire index’s return. Said differently, roughly 14% of the 500 stocks in the index determine nearly one-third of its performance.

The table clearly shows that the performance of companies in the information technology, financials, health care and consumer discretionary sectors exerts a much greater impact on the performance of the S&P 500 than that of companies in the energy, utilities, real estate and materials sectors. This is the natural result of building an index that is market-cap weighted. Market cap is determined by multiplying a stock’s current price per share by how many shares are outstanding.

In this update to my November 2020 AAII Journal article, “The Benefits of Building Your Own S&P 500 Portfolio Sector by Sector,” I revisit the how a sector-based portfolio compares to a portfolio that just holds an S&P 500 fund.

The Returns for Each S&P 500 Sector

Let’s examine the performance differences among the various sectors over the past 20 years (2005–2024).

I’ve chosen 11 Vanguard sector exchange-traded funds (ETFs) that focus on the same 11 sectors as the S&P 500 (Table 1). An investor could also utilize 11 SPDR sector ETFs from State Street Global Advisors, which are also shown in Table 1.
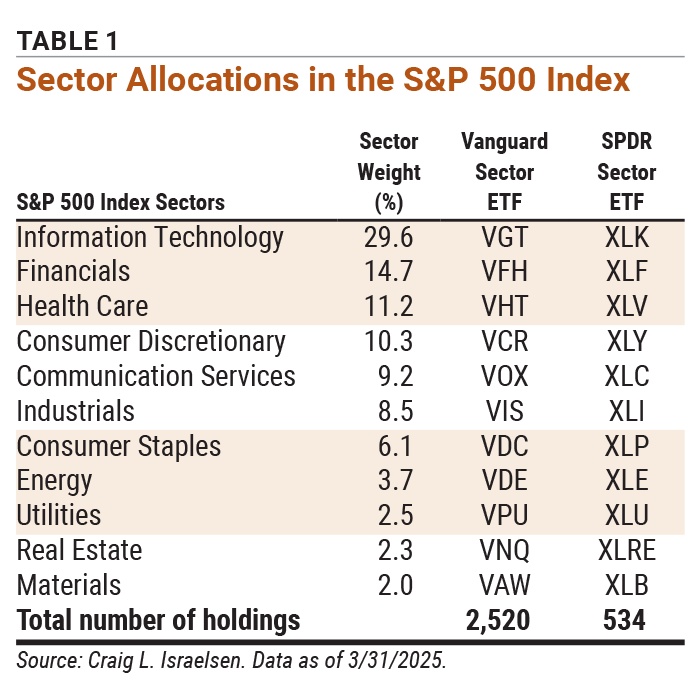
Table 1 Sector Allocations in the S&P 500 Index

There are differences between the Vanguard and SPDR sector ETFs. The Vanguard sector ETFs listed here track MSCI sector indexes. The SPDR sector ETFs track S&P 500 sector indexes. The total number of holdings in the 11 Vanguard sector ETFs was 2,520 as of March 31, 2025, whereas the 11 SPDR sector ETFs had a total of 534 holdings. Thus, the SPDR sector ETFs are generally closer to replicating the actual S&P 500 in terms of the total number of securities.

The challenge in using the SPDR sector ETFs in this study is that two of them—the Communication Services Select Sector SPDR ETF (XLC) and the Real Estate Select Sector SPDR ETF (XLRE)—were not in existence over the full 20-year period. Thus, the Vanguard sector ETFs were used, all 11 of which have a performance history dating back to 2005. (The 11 Vanguard sector ETFs all began in 2004, but the first full year of performance was 2005).

As shown in Table 2, the best-performing Vanguard sector ETF over the past 20 years (January 1, 2005, through December 31, 2024) was the Vanguard Information Technology ETF (VGT). It has a 20-year average annualized return of 14.76%. For comparison, the Technology Select Sector SPDR ETF (XLK) has a very similar 20-year average annualized return of 14.21%.
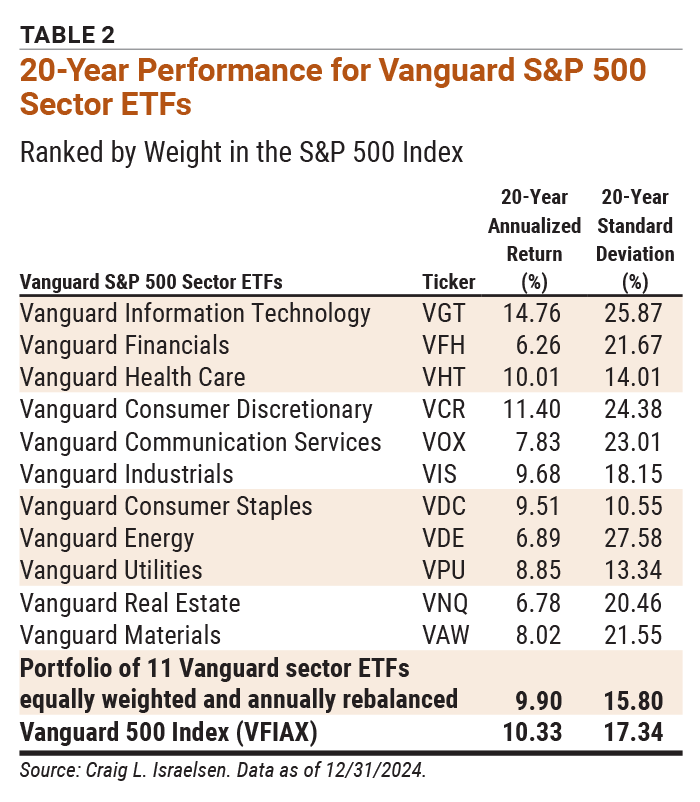
Table 2 20-Year Performance for Vanguard S&P 500 Sector ETFs Ranked by Weight in the S&P 500 Index

The next-best 20-year performer was the Vanguard Consumer Discretionary ETF (VCR) at 11.40%. The bottom two rows of Table 2 feature the 20-year performance figures of a portfolio consisting of all 11 Vanguard sector ETFs (equally weighted allocations of 9.09%, rebalanced annually) and the 20-year performance of the Vanguard 500 Index Admiral fund (VFIAX). The Vanguard 500 Index Admiral and its ETF equivalent, the Vanguard S&P 500 ETF (VOO), are convenient, one-fund ways to invest in the S&P 500. The question is: Should convenience be the driving factor determining how one invests in the S&P 500?

The 20-year performance figures shown in Table 2 use the standard industry assumption of a single lump-sum investment at the start of the investment period (in this case, January 1, 2005). Based on that assumption, holding just the Vanguard 500 Index Admiral fund led investors to realize a higher 20-year return versus a portfolio of 11 equal-weighted and annually rebalanced Vanguard sector ETFs. (The Vanguard S&P 500 ETF was not launched until 2010.) The performance advantage for the Vanguard 500 Index Admiral was 43 basis points (bps), or 0.43% annualized, but its volatility was 154 bps (1.54%) higher. A trade-off as usual.

Convenience wins—but only if you ignore the extra volatility.

You will recall that the Vanguard 500 Index Admiral is market-cap weighted (as are virtually all mutual funds and ETFs that mimic the S&P 500), whereas the portfolio of 11 sector ETFs can be weighted any way you wish. In this analysis, the 11 sector ETFs were equally weighted and rebalanced annually to maintain equal weighting over the 20-year period. Equal weighting assumes a naive approach and removes the possibility of cherry-picking the most advantageous allocation in each sector fund based on hindsight.

Holding the S&P 500 Versus S&P 500 Sector Funds in a Retirement Portfolio

Let’s change the assumption from a single lump-sum investment to a retirement portfolio from which money was withdrawn each year. This is a far more realistic assumption and highly relevant to a retiree. We are now investigating how a portfolio of 11 Vanguard sector ETFs fared in comparison with the convenient single S&P 500 clone fund when money was being withdrawn each year.

We assume a starting balance of $250,000 in the retirement portfolio on January 1, 2005, with a total of 20 withdrawals, one at the end of each year, taken through 2024. The initial withdrawal rate from the retirement portfolio was assumed to be 5% of the starting balance. This translated to a first-year withdrawal of $12,500 ($250,000 x 0.05). The second-year withdrawal was increased by a 3% cost-of-living adjustment (COLA), which amounted to a year-end withdrawal of $12,875. A 3% COLA was applied to all the annual withdrawals through year 20. By this method, a total of $335,880 was withdrawn from the retirement portfolio over the 20-year period from 2005 through 2024. The retirement portfolio of 11 sector ETFs was rebalanced each year.

The results of this retirement portfolio analysis are shown in Table 3. During this specific 20-year period, a portfolio of 11 sector ETFs was clearly superior if we assume that money was being withdrawn annually. In fact, the 11-ETF portfolio was over $52,000 better off than the index fund ($634,515 versus $582,243)!
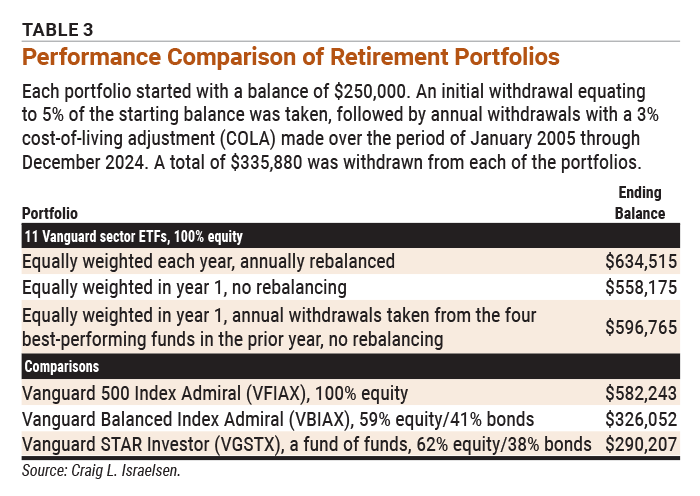
Table 3 Performance Comparison of Retirement Portfolios

You should also know that the retirement portfolio of 11 sector ETFs had a higher balance after each withdrawal every year. In other words, the 11-ETF retirement portfolio didn’t surge ahead at the end of the 20-year period. Rather, it produced higher end-of-year account balances each and every year compared to a sole investment in the Vanguard 500 Index Admiral.

If the portfolio of 11 Vanguard sector ETFs was not rebalanced at the end of each year, the final account value was $558,175, or 12% lower than the rebalanced sector ETF portfolio—a difference that equates to a decline of $76,340. In this scenario, the 11 sectors started out in the first year with an equal allocation of 9.09%, but the allocations in each ETF became widely different by the end of the 20th year.

Another option is to withdraw money at year-end from the four best-performing ETFs during the prior year. This approach implies that annual rebalancing would not occur, because doing so would completely negate the process.

While this approach of only skimming money off the best performers is emotionally satisfying (which should not be discounted), the ending balance ($596,765) was 5.9% below the equal-weighted, rebalanced portfolio in which an equal amount of money was withdrawn from each ETF every year.

For comparison, Table 3 also shows the ending balance for the Vanguard Balanced Index Admiral fund (VBIAX) and the Vanguard STAR Investor fund (VGSTX). These two mutual funds have a 60% equity/40% bond allocation, whereas the Vanguard sector ETF portfolio is 100% equity. Thus, it’s not a completely fair comparison. But it is interesting to see the magnitude of difference in the ending account balances.

A Few Final Thoughts

Here are few things to consider regarding these portfolios:
  • If periodic rebalancing is assumed, the benefit from also incorporating a strategy that invests more in losers or withdraws more from winners will be negated.
  • Purchasing fractional shares of ETFs (assuming a dollar-based periodic investment program) is now widely available. For instance, it can be done at Vanguard, Charles Schwab and Fidelity brokerage services.
  • The outcomes in the analysis reported here assume that dividends and capital gains were reinvested.
  • No taxes were accounted for because the rebalancing is assumed to have occurred in tax-preferred retirement accounts such as a traditional individual retirement account (IRA) or a Roth IRA.

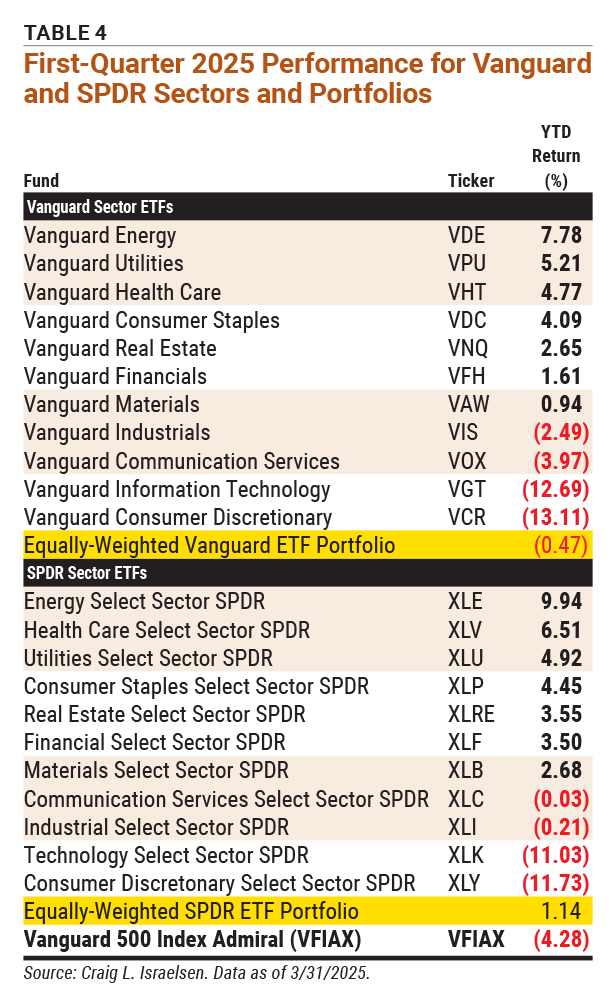
Table 4 First-Quarter 2025 Performance for Vanguard and SPDR Sectors and Portfolios

Table 4 reports the year-to-date returns for the Vanguard and SPDR sector ETFs and calculates the performance of an equally weighted portfolio of each. The Vanguard 500 Index Admiral’s performance is shown as a comparison. 

Revisiting the Use of ETFs to Construct an S&P 500 Portfolio Video

We think you’d like this related webinar! A Data-Driven Approach to Retirement Planning.

Craig Israelsen created the Retirement Portfolio Analyzer (RPA) to let users see how different investment choices, withdrawal strategies and Social Security timing would impact their long-term security. See Israelsen demonstrate his tool in real time and get a tour of AAII’s Retirement Investing from Cynthia McLaughlin.

Discussion

JOHN L from NJ posted about 1 year ago:

One twenty year period is not strong enough historical evidence to support a conclusion that equal weighting is better or worse than capitalized weightings. The last 20 years is not predictive of what will happen in the next 20 years and which weighting scheme will do better.


BARRY J from TX posted about 1 year ago:

#1 Mr. Israelsen’s power tool to build the edifice for his argumentation is back-testing. Back-testing requires making “just so” ASSUMPTIONS and then creates self-fulfilling outcomes using data from specific historical periods – 2005-2024 in this case. #2 Back-testers are clicking away in basements all night long everywhere, every day, and they aren’t richer than us yet. How do we know? They tend to allocate their valuable time to increasing their wealth through publishing rather than investing. #3 However, although Mr. Israelsen has provided a series of similar articles with similar motifs and themes to “guide” AAIIers based on a common theme – “YOU COULD HAVE MADE MORE MONEY BY DOING THIS IF YOU STARTED BACK WHEN,” he has never provided follow-up articles that VERIFIED his statistical promises ex post facto. #4 The cruel thing about people who patronize the retiree investing market is that they are not around to explain any harm they might have encouraged by their ex-ante projections. #5 Sector imbalances occur due to unpredictable changes in interest rates, the rate of innovation, macroeconomic factors, fiscal and monetary policy decisions, consumer sentiments and behaviors, and the downstream effects of related decisions made in prior periods. No back-testing model can predict the impacts of the covariances among these factors. #6 For example, among the 6 sample factors I listed above as examples, there are n(n-1) = 30 possible interactions with changing covariances. 11 sectors have 11(10) = 110 possible interactions. SPX has 500(499) interactions = 249,500 covariances! That's why holding an SPX ETF like VTI Is PERFECTLY DIVERSIFIED. #7 The First Order Rule of Markets is the same as Heraclitus’ “river” -- "No man ever steps in the same river twice," which should remind us that everything is in constant flux and that circumstances are always changing and the PERMUTATIONS are always growing. #8 You may or may not agree with Harry Markowitz's mean-variance-based model of portfolio variations (as a proxy or “indicator” to measure "risk"), but you cannot change the POWER LAWS that create the forces we can't measure directly by normally-distributed statistical models.


ROBERT A from NC posted about 1 year ago:

I wonder how much work it took to find withdrawal assumptions that would make the rebalanced portfolio look better than the static one. I find Table 2 to be illuminating enough, and a simpler strategy usually turns out better than a more complex one.


KENNETH M from GA posted about 1 year ago:

I think that Mr. Israelsen’s backtesting approach is reasonable, and the 20-year interval includes periods of great market disruption and volatility (The Great Recession and the COVID-19 Pandemic). My objection to backtesting is when the period is “cherry-picked” after multiple iterations of analysis to achieve a desired outcome. The author did not do this. As the fine print always says “past performance is no guarantee of future results”, and I don’t think that reasonable people would expect this analysis to be anything more than a look at past performance.


NORMAN F from OH posted about 1 year ago:

I don't like to sell assets to raise income. I suggest adding another example where the $250K is invested in carefully selected dividend paying stocks that yield 3%. Then only 2% of assets need to be sold to make the 5% total income goal.


Mahlon M from WA posted about 1 year ago:

As a novice, I wonder if I could, please, ask a few questions? 1) if we withdraw 5% every year, as in your model, where do we withdraw it from? —equally, from each of the 11 sectors? 2) By rebalancing, this means that, in dollar amounts, each sector constitutes 9.09% of the total worth—is that correct? 3) when, each year, do we rebalance? I sure would be grateful for anyone, kindly, weighing in.


ARUN C from MI posted about 1 year ago:

The RSP ETF equalweights the SPY ETF stocks. I believe it has underperformed SPY in the last 20 years cumulatively. I suppose winners keep winning and that is why market cap weights perform better.


DAVE G from TX posted about 1 year ago:

@ Craig I, I would suspect that the results would be pretty similar, had you done what I do and that is sell which ever funds are overvalued in order to "rebalance" the total portfolio at the end of each year. (fyi I do it quarterly to get 4 data points per year rather than one.) This seems the same as selling equal portions of the 11 ETFs and then rebalancing afterwords, as the result is exactly the same. What you have proved here is that the Total Return of equally weighting the 11 ETFs is "more" than the total return of the SPY index by itself. This different TR is created by selling and rebalancing in a way that just happened to improve returns in this 20 year period. Not sure I could say it would be repeated in the next 20.


DAVE G from TX posted about 1 year ago:

Norman F, I can understand wanting to spend the dividends first, but in the end dividends are just a portion of the total return of an asset (stock, ETF, etc). If you find assets with the same total return you will get the same results. Here is one such article that explains this; https://seekingalpha.com/instablog/3752451-financialdave/5347859-dividend-what-is-good-for


RICHARD O from CA posted about 1 year ago:

I note that the equally weighted sectors "win" in Table 3, yet Table 2 says they have a lower compound annual return. How does that work? is there a typo or three in the tables? OK so I have had fun doing backtesting and I have learned that backtesting on S&P 500 data going back 75 years can result in strategies that are very nice, but testing them going back 96 years finds that earlier period more challenging and they do not do as well. To me 20 years seems a bit too short to make a reasonable conclusion that can be trusted. So, I agree with John L. The conclusion may or may not be valid, We will have to wait and see. As a side note: Sector ETFs were born in 1998 and that is 26+ years. Enough history to be interesting but not completely trustable.


DAVID H from NV posted about 1 year ago:

Sadly, all of the merits of this article (and it has many) get tossed into the wind when a dictatorial fruit cake decides to deliberately screw with the world economy and destroy 100s of millions of retirement plans just to be cruel. No solution to egomaniacal economic stupidity.


BARRY J from TX posted about 1 year ago:

When introducing Table 3, Mr. Israelson points out that “the 11-ETF portfolio was over $52,000 better off than the index fund ($634,515 versus $582,243)!” over the 20-year period used. I am not so surprised as to award an “!” for this less than astonishing feat. It merely demonstrates the ability to grow a low-ER, diversified ETF portfolio/fund faster than higher ER mutual funds. [Bogle’s Law]. VFIAX ER = 0.04 vs VBIAX ER = 0.07 and VGSTX ER = 0.30. VFIAX, a 100% equity market portfolio, has two advantages: #1 an equity premium that compounds at a higher rate and #2 lower-cost ERs that compound at higher rates. VBIAX ER @ 0.04 and VGSTX ER @ 0.30 were drags on portfolio outcomes. Diversifying “risk” always lowers results. [Markowitz Law of "the efficient frontier" mini-max curve].


BRUCE B from MA posted about 1 year ago:

I'm with Mahlon M above. Exactly where are the distributions taken from and and when? Are they taken from each ETF equally, then the ETFs are rebalanced? Or are the ETFs rebalanced then the distributions are taken from each one equally? The devil is in the details


Tim B from SC posted about 1 year ago:

Agreed, a missing key detail to possibly explain this particular set of results is whether the withdrawal of equal amounts from each ETF every year is done prior to, or after, rebalancing. In the end though: 1. This is not predictive of future performance; 2. This is a lot of work for a 43 bp gain (even annualized over 20 years); 3. Market cap weighting (as much as I hate it) is still the most profitable way to run an index, as proven by the vast majority managed that way; and, 4. Simpler is always better. I'll take VOO, VTI, SCHG and SCHD all day long.


C R from CA posted about 1 year ago:

I was dumbfounded by the statement "in other words the 11 ETF retirement portfolio did not surge ahead at the end of the 20-year period"! Clearly a strong performance at the beginning of the period would have increased the initial balance for every subsequent year.


THOMAS S from NC posted 11 months ago:

Seeing the positive results of of an annually rebalanced Sector portfolio over the 500 Index portfolio with annual withdrawals, I considered using this strategy for a non-withdrawal portfolio. To determine if this would be a worth while investment strategy, I modeled the sector portfolio using Fidelity Index funds versus Fidelity's S&P 500 fund for the period 2014 to 2024 (Note that the real estate index fund was started in 2016 so data from Fidelity's Real Estate Index fund was used for the missing years.) The results where disappointing at best. The S&P 500 out performed the Sector Rebalanced portfolio and the No Rebalanced portfolio by 18.2% and 19.1% respectively. Also the S&P 500 fund balance was never less than either strategy. Conclusion: "The performance data featured represents past performance, which is no guarantee of future results."


RICHARD V from CA posted about 1 month ago:

Has anyone looked at which index is used by each fund? I believe the Vanguard total market funds currently use CRSP but in the past followed two other different indices so that very long term results are quoted as "spliced index". In the article, table headings refer to "S&P 500". If that is actually the case, it introduces two additional possible causes for different results: 1. Different composition of the index membership; and 2. different methods and timing for adding and subtracting index members. Also are there any differences in how quickly the different funds adjust to changes in the index. I believe DFA, for example, takes a more relaxed approach in an effort to secure more favorable trades when reconstituting


You need to log in as a registered AAII user before commenting.
Create an account

Log In

Get your free copy of our special report analyzing the tech stocks most likely to outperform the market.

Download the FREE Report Here: