


Related

Portfolio Strategies
A comparison of two approaches to handling withdrawals in your retirement portfolio.

Charles Rotblut leads a class in AAII's new Essential Investing Video Course. Go to https://www.aaii.com/ves for more information and to subscribe.
The biggest risk to any investor’s portfolio is an ill-timed drop in the financial markets that causes a shortfall of assets. While investors with long horizons can wait for their portfolios to recover, those taking withdrawals face greater challenges from a bad sequence of returns. Known as sequence risk, this is the risk of incurring an ill-timed drop in the market.
Having to sell a growth asset when its price is down, such as near the bottom of the 2022 bear market, can have a lasting impact. There are fewer shares of the stock, stock mutual fund or stock exchange-traded fund (ETF) to benefit from the recovery. This, in turn, reduces future wealth from which withdrawals can be taken.
There are two strategies investors can use to manage the risk of a bad sequence of returns while taking withdrawals: portfolio rebalancing and buffer withdrawal. Both help investors maintain an allocation to volatile growth assets regardless of how the markets are performing. Both strategies can also offer peace of mind by giving you the opportunity to act in a manner beneficial to your long-term goals in the midst of a market downturn.
Since both rebalancing and buffer withdrawal strategies are easy for individual investors to implement and use, this article compares both. This is a departure from past years when we only compared rebalancing portfolios to non-rebalanced portfolios. The buffer withdrawal strategy used has similarities to AAII founder James Cloonan’s Level3 withdrawal strategy, but it is not the same. (We specifically cover the Level3 withdrawal strategy in our March article.)
The comparisons here focus solely on withdrawal strategies. An investor who isn’t taking withdrawals can simply choose to rebalance or not rebalance their portfolio. Additionally, investors subject to required minimum distributions (RMDs) can use in-kind distributions to avoid altering their allocations. (In-kind distributions involve transferring securities instead of cash to satisfy the RMD.)
Though rebalancing and buffer strategies offer similar types of benefits for retirees and others who are taking portfolio withdrawals, key differences exist.
Rebalancing maintains a portfolio’s desired allocation. It does this by shifting portfolio dollars out of overweighted assets and into underweighted assets. Rebalancing works well for those who are taking withdrawals because it maintains diversification within a portfolio. This reduces volatility and replenishes growth assets when their prices fall.
Buffer withdrawal strategies enable investors to avoid selling stocks during market downturns. They do this by making withdrawals solely from less volatile assets. This is why the term “buffer” is used. The buffer asset is typically a short duration bond fund, a money market fund or other equivalent. It is an asset whose value is more or less not affected by volatility. The buffer asset preserves the allocation to growth assets, like stocks, by steering withdrawals away from them during down periods. This gives growth assets a chance to rebound in price.
Our analysis used hypothetical portfolios based on the AAII moderate investor Asset Allocation Model and the AAII aggressive investor Asset Allocation Model.
The moderate allocation model modifies the traditional 60% equity/40% fixed-income allocation strategy by incorporating greater diversification on the equity side and a shorter duration (meaning less interest rate sensitivity) on the bond side. Specifically, the model calls for allocating 20% to large-cap stocks, 15% to mid-cap stocks, 10% to small-cap stocks and 15% to international stocks. On the bond side, it calls for a 30% allocation to intermediate-term bonds and a 10% allocation to short-term bonds. (An intermediate-term bond fund is used for the entire bond allocation here to provide continuity with past rebalancing analyses.)
The aggressive allocation model has 90% in equities and 10% in fixed income. The model calls for allocating 20% to large-cap stocks, 20% to mid-cap stocks, 20% to small-cap stocks, 20% to international stocks and 10% to emerging markets stocks. On the bond side, it calls for a 10% allocation to intermediate-term bonds. (Cash and cash equivalents, such as a money market fund, could be used in lieu of bonds.) We combined the international and emerging markets allocations in this analysis. For the buffer withdrawal strategy, we increased the bond allocation to 20% to account for four years’ worth of withdrawals. The remaining allocation was reduced proportionately among the four stock funds.
The portfolios use Vanguard mutual funds to replicate the returns an investor could have realized net of fund fees. The Investor share class of funds was used for the period of 1988 through 2017. The Admiral share class of funds was substituted in 2018 because Vanguard stopped offering the Investor shares class to most investors. Part of the goal of this study is to show the returns an investor could have realized in a real-world portfolio, gross of taxes and specific account fees.
Thirteen rolling 25-year period models are the subsets, with starting dates ranging from 1988 to 2000.
Annual withdrawals based on an inflation-adjusted 4.5% rate were taken from the rebalanced portfolios, non-rebalanced benchmark portfolios and buffer withdrawal strategy portfolios. Specifically, a withdrawal equal to 4.5% of each portfolio’s balance was taken at the end of the first year. This initial withdrawal rate was then increased each year by the rate of inflation. The strategy is based on research by retired financial planner William Bengen. All withdrawals were taken on the last trading day of the year. (RMDs were not used because age, account type and life expectancy would impact the calculation of the withdrawal rate.)
The year-over-year change in the consumer price index for all urban consumers (CPI-U) was used to determine the inflation adjustment. This benchmark can be substituted with a different measure.
Withdrawals for the rebalanced and non-rebalanced portfolios were taken proportionately from each asset class category based on the prior year’s portfolio weighting for each fund. For example, the large-cap (S&P 500 index) fund accounted for 21.7% of the rebalanced withdrawal’s total portfolio balance at the end of 2023 when the moderate allocation was used. Therefore, in 2024, 21.7% of the year’s total withdrawal came from the large-cap fund.
For the buffer withdrawal strategy portfolios, withdrawals were solely taken from the bond fund whenever the S&P 500 was down for the calendar year (e.g., 2022). Once the S&P 500 returned to realizing positive gains (e.g., 2023), we returned to using the equity funds as a source for withdrawals (Figure 1).
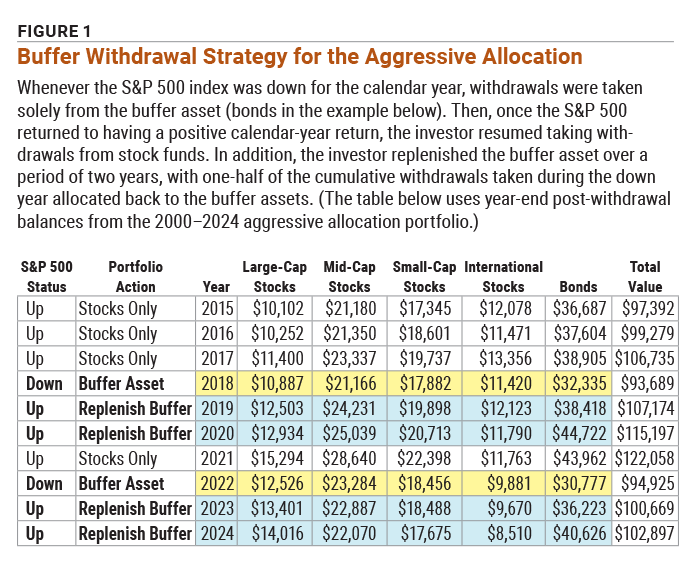
In doing so, we made modifications based on the allocations used. For the moderate buffer withdrawal strategy portfolio, withdrawals were taken proportionately from the equity and the bond funds. When the S&P 500’s return was down, withdrawals only came out of the bond fund.
A more traditional buffer withdrawal strategy was used with the aggressive asset allocation model. Withdrawals were taken proportionately from just equities whenever the S&P 500 had an annual gain at year-end. Withdrawals were only taken from stock funds in 2017, for instance, because the S&P 500 rose 21.7%.
When the S&P 500 was down at year-end, withdrawals for that calendar year were taken solely from the bond fund. Once the S&P 500 returned to having a positive calendar-year return, withdrawals were taken proportionately from just the equity funds based on their portfolio weightings.
In addition, an amount equal to one-half of the withdrawal taken from the bond fund during the down year(s) was shifted from the equity funds back into the bond fund. This was done during the first two consecutive years following a down year for the S&P 500. This approach is based on the Level3 withdrawal strategy and allowed us to maintain an allocation to the buffer asset.
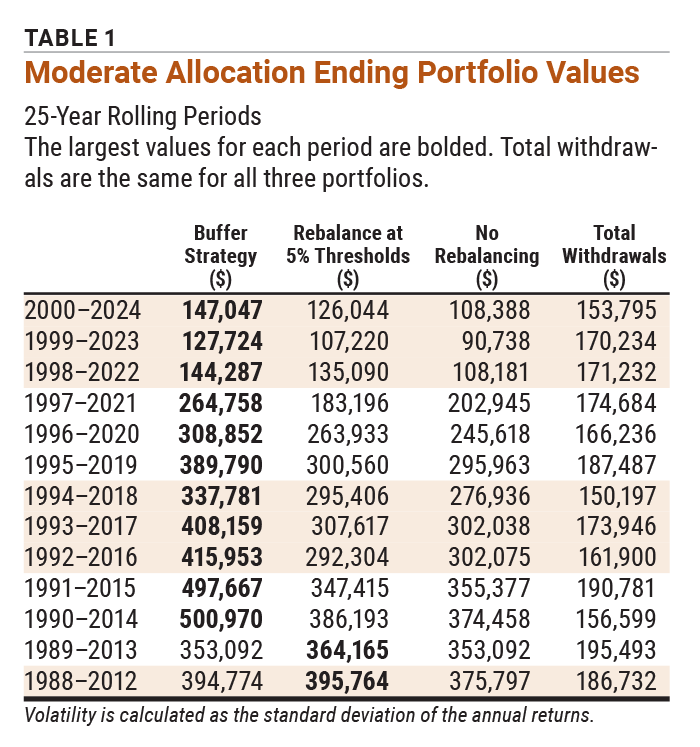
The buffer withdrawal strategy portfolios ended with the largest wealth during 11 out of the 13 periods analyzed (Table 1). They also had the largest ending value for any of the periods analyzed: $500,970 after withdrawals were taken during the 25-year period of 1990–2014.
Part of the reason why the buffer withdrawal strategy performed better was how its allocation evolved. Though all three strategies started with a 60% stock/40% bond allocation, neither the buffer nor the non-rebalanced portfolios ever adjusted their allocations. Rather, both let the market fluctuations adjust their allocations.
This resulted in the buffer withdrawal strategy having the highest average equity allocation during all 13 periods analyzed (Table 2). The rebalanced strategy, by design, kept its allocation the closest to the 60%/40% target throughout the 13 rolling periods.
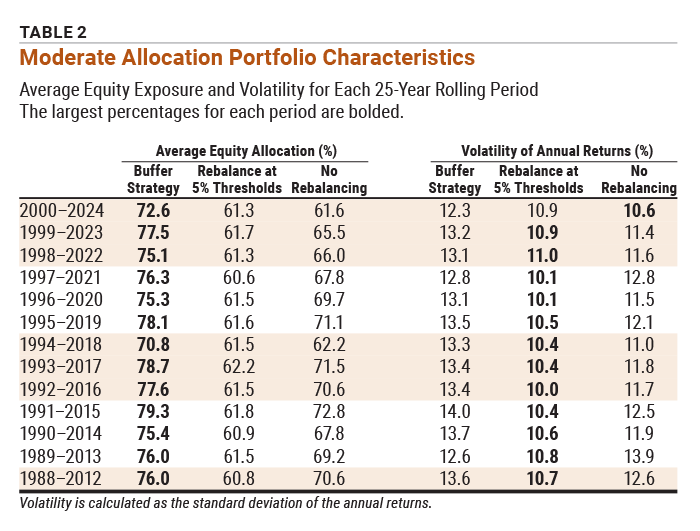
Among the times when the buffer withdrawal strategy held up best was when the dot-com bubble crash hit early in the withdrawal period. This strategy prompted the investor to avoid selling any equities at the depressed prices, giving those funds a chance to recover. The trade-off for this was a drawdown of the bond allocation. The bond fund accounted for less than 1% of the total buffer strategy portfolio’s value at the end of the 1999–2023 period. The buffer withdrawal strategy also had the highest average equity allocation of the three strategies over that period at 77.5%. The corresponding equity allocation for the rebalanced portfolio was 61.7%. The non-rebalanced portfolio’s allocation was 65.5%.
Individual investors concerned about preserving their allocations should consider the rebalancing strategy instead. It experienced the lowest level of volatility during 12 of the 13 periods. It also maintained an average equity exposure of between 60.6% and 62.2% across all periods. The trade-off is mostly lower ending wealth.
Timing impacted the comparative results of the portfolios using the aggressive allocation model.
The buffer withdrawal strategy portfolios ended with the largest wealth during the first eight 25-year periods (Table 3). Those periods ranged between 1988–2012 and 1995–2019. The buffer withdrawal strategy portfolios also experienced the lowest level of volatility for all 13 periods analyzed, as defined as by the standard deviation of annual returns (Table 4).
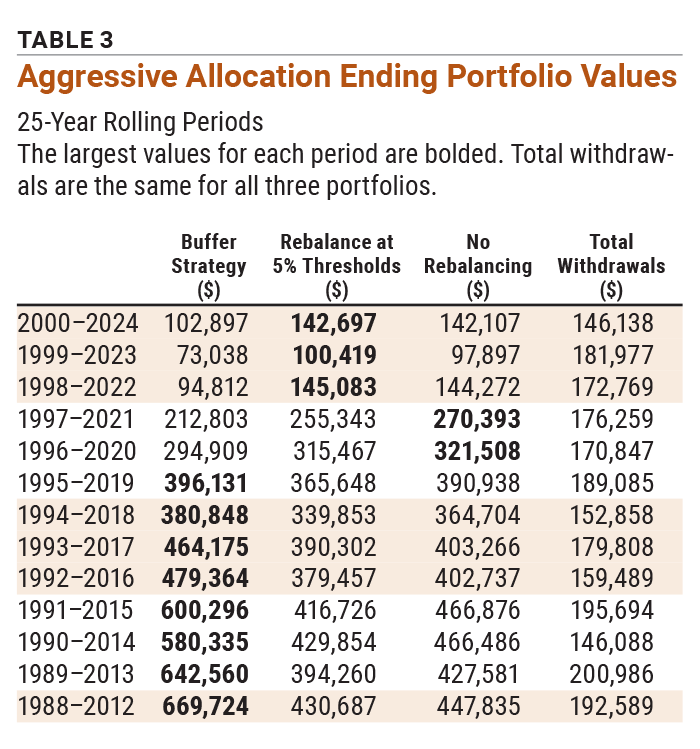
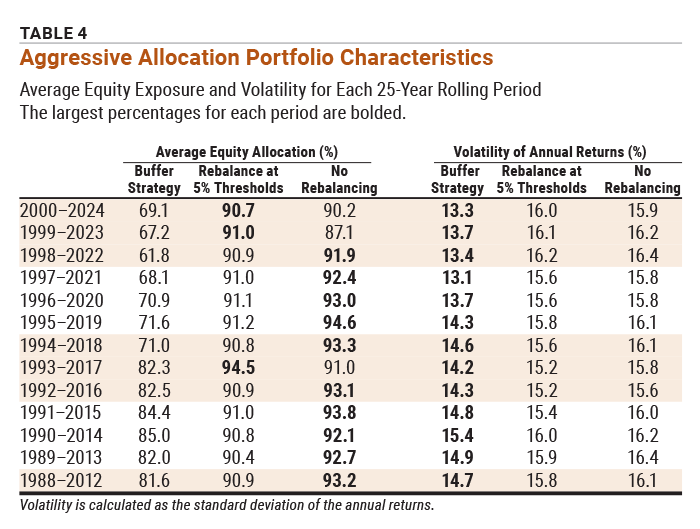
The rebalanced portfolios had the highest returns for the 1998–2022, 1999–2023 and 2000–2024 periods. The non-rebalanced portfolio fared best during the 1996–2020 and 1997–2021 periods.
The most recent period of 2000–2024 demonstrates why the buffer withdrawal strategy underperformed during the past few 25-year periods. The average equity allocation for this strategy was 69.1%. Its ending equity allocation was 60.5%. The smaller equity exposure led to lower overall portfolio growth.
Since the S&P 500 had positive returns in 2003 and 2004, withdrawals were taken from equities following the down years of 2000–2002. Plus, additional dollars were shifted from equities into fixed income to replenish the buffer assets. Similar actions were taken a few years later in 2009 and 2010.
Waiting just one year to start replenishing the bond portion of the buffer withdrawal portfolio (2004 instead of 2003 and 2010 instead of 2009, respectively) would have resulted in a nearly equal ending value to the rebalanced and non-rebalanced portfolios. The ending and average equity allocations would have been at 80% too.
Cloonan advised waiting until the S&P 500 was within 5% of its record high to begin replenishing the buffer assets. A one-year postponement would have made a big difference. A two-year postponement (2005 instead of 2003 and 2011 instead of 2009), would have had an even bigger positive impact.
The periods with the highest ending wealth were characterized mostly by gains during their first half. The first 25-year period included in our analysis, 1988–2012, only saw the S&P 500—as measured by the Vanguard 500 Index fund  (VFINX)—decline once during its first 12 years. The period also ended with a run of positive returns for stocks (2009–2012). All three portfolios—buffer withdrawal strategy, rebalanced and non-rebalanced—had their highest ending wealth during this time.
Just as an ill-timed sequence of bad returns can hurt a portfolio when withdrawals are being taken, a sequence of good returns can lead to considerable ending wealth.
We established guidelines in order to provide similar comparisons over several periods. Individual investors may want to consider options for customizing these approaches when using them in their actual portfolios.
For example, periodic rebalancing may be used with a buffer withdrawal approach. This may make sense if the equity allocation trends significantly higher than the desired allocation.
The aggressive and moderate allocations can also be tweaked. The equivalent of four years’ worth of withdrawals may be a smaller percentage of the portfolio than we allocated to. This would alter the outcomes by creating less of a strain on the portfolio during down years. Alternatively, the bond allocation could be either completely replaced in the aggressive allocation or split between intermediate-term bonds for higher income and a true buffer asset for moderate portfolio allocation.
Portfolio Strategies

Portfolio Strategies


CARLOS G from FL posted over 1 year ago:
J M from NJ posted over 1 year ago:
KEN R from CA posted over 1 year ago:
CHRIS C from ID posted over 1 year ago:
CHARLES R from IL posted over 1 year ago:
CHARLES R from IL posted over 1 year ago:
JOHN L from NJ posted over 1 year ago:
ROBERT A from NC posted over 1 year ago:
David B from UT posted over 1 year ago:
DAVE G from TX posted over 1 year ago:
ERIC K from WA posted over 1 year ago:
BERT M from AZ posted over 1 year ago:
VICTOR S from NC posted 11 months ago:
You need to log in as a registered AAII user before commenting.
Log InCreate an account