


Related

Investor Professor
Put risk into perspective by measuring volatility relative to a market benchmark.

Investing isn’t only about maximizing returns—it’s also about managing the risks required to achieve them. A metric that helps put risk into perspective is the risk index, which measures an investment’s or portfolio’s volatility relative to a market benchmark. By quantifying how an asset or portfolio moves in comparison to a standard benchmark like the S&P 500 index, the risk index provides insight into how volatile it is versus the market. Investors can use the risk index when constructing portfolios to better align their portfolio objectives and risk tolerance.
A volatile stock, portfolio or other financial instrument is defined by large price swings over a short period of time. These movements can result in either gains (upside volatility) or losses (downside volatility).
Volatility is linked to risk because steep price declines can create shortfalls when an investor needs to make a withdrawal. Sharp, sudden drops can also shake investor confidence and prompt emotionally driven decisions.
Standard deviation offers a standardized and digestible measure of volatility compared to looking at price percentage changes. Taking the difference between two extremes in a series of returns would not show you how tightly other returns were clustered—for example, a series where the lowest return is –5% and the highest is +25% has a range of 30%. Consider the following two series of returns: –20%, 0%, 0%, 0%, +20%; and –20%, –19%, 0%, +19%, +20%. They each have the same range, but not the same volatility. The first series of returns will result in 4% higher wealth.
If you rank a stock’s monthly returns over the past 36 months from highest to lowest, you’ll find that about 68% of the returns are concentrated near the average. A smaller portion of returns—both sharply positive and negative—fall far from that central range or average.
Standard deviation reflects how much returns have fluctuated around their average over a given period—the higher the standard deviation, the greater the volatility. It is calculated as the square root of the average of the squared deviations from the mean. It is an absolute value, meaning it will never be negative.
Volatility tends to remain relatively stable over the long term, but it can vary significantly in the short term. Because portfolio decisions often depend on current levels of volatility, it is important to choose a measurement period that’s long enough to identify meaningful trends without being distorted by brief, extreme fluctuations. A three-year annualized standard deviation, based on monthly returns, offers a balanced time frame for making effective comparisons.
Unlike standard deviation on its own, the risk index offers clearer context by showing how an investment’s volatility compares to a benchmark such as the broader market. The risk index is calculated by dividing the standard deviation of returns for a stock, fund or portfolio by the standard deviation of a benchmark’s returns.
The benchmark used for the risk index can be a broad market index like the S&P 500 or the average performance of a group of similar stocks or funds. AAII’s Dividend Investing (DI), Stock Superstars Report (SSR) and VMQ Stocks model portfolios use the iShares Dow Jones U.S. ETF  (IYY) as their benchmark. This ETF tracks a broad-based index of U.S. equities. By comparing portfolio volatility to the iShares Dow Jones U.S. ETF, the risk index reveals whether these model portfolios—and their holdings—have been more or less volatile than the broader U.S. market.
The risk index is calculated as follows, where monthly returns for the past 36 months are used for both the asset and the benchmark:
Standard Deviation of Asset Returns ÷ Standard Deviation of Benchmark Returns
The risk index is anchored at a baseline of 1.00, representing average risk—where the investment’s volatility matches that of its benchmark. A value above 1.00 signals higher volatility than the benchmark, while a value below 1.00 indicates lower volatility. As a rule of thumb, the higher the risk index, the more pronounced the investment’s price swings—both upward and downward—relative to the benchmark.
The risk index is based on historical data using standard deviations over a past time period. Thus, it does not reflect future risk. Market conditions, economic cycles or company-specific events can quickly change an asset’s and a portfolio’s risk profile.
You can’t determine a portfolio’s risk index by simply averaging the risk indexes of its individual holdings. This is because securities interact in complex ways, and diversification—such as holding stocks across various industries—can help reduce the portfolio’s overall volatility. You will need an additional piece of data.
Correlation coefficients measure the degree to which two asset classes move in relation to one another. A perfect positive correlation of 1.00 means both assets rise and fall together, though not always by the same percentage. Lower correlation between asset classes provides greater potential for effective diversification within a portfolio.
Selecting stocks with low correlations to each other and the broader market can help lower overall portfolio risk. Diversifying across asset classes can help reduce your portfolio’s volatility, but it may also limit potential long-term absolute returns.
The Sharpe ratio assesses whether the return of an investment compensates for the risk taken, with a higher ratio indicating better risk-adjusted performance. It is calculated as:
(Portfolio Return – T-Bill Return) ÷ Portfolio Standard Deviation
The Treynor ratio is similar to the Sharpe ratio but measures how much excess return an investment generates for each unit of market risk, as measured by beta. Again, a higher ratio is better. The Treynor ratio is calculated as:
(Portfolio Return – T-Bill Return) ÷ Portfolio Beta
Beta measures how much an equity investment moves in relation to the overall market, typically compared to a benchmark like the S&P 500. Portfolios with betas of 1.0 tend to move in step with the overall market. A beta above 1.0 indicates greater volatility than the market, while a beta below 1.0 suggests less volatility.
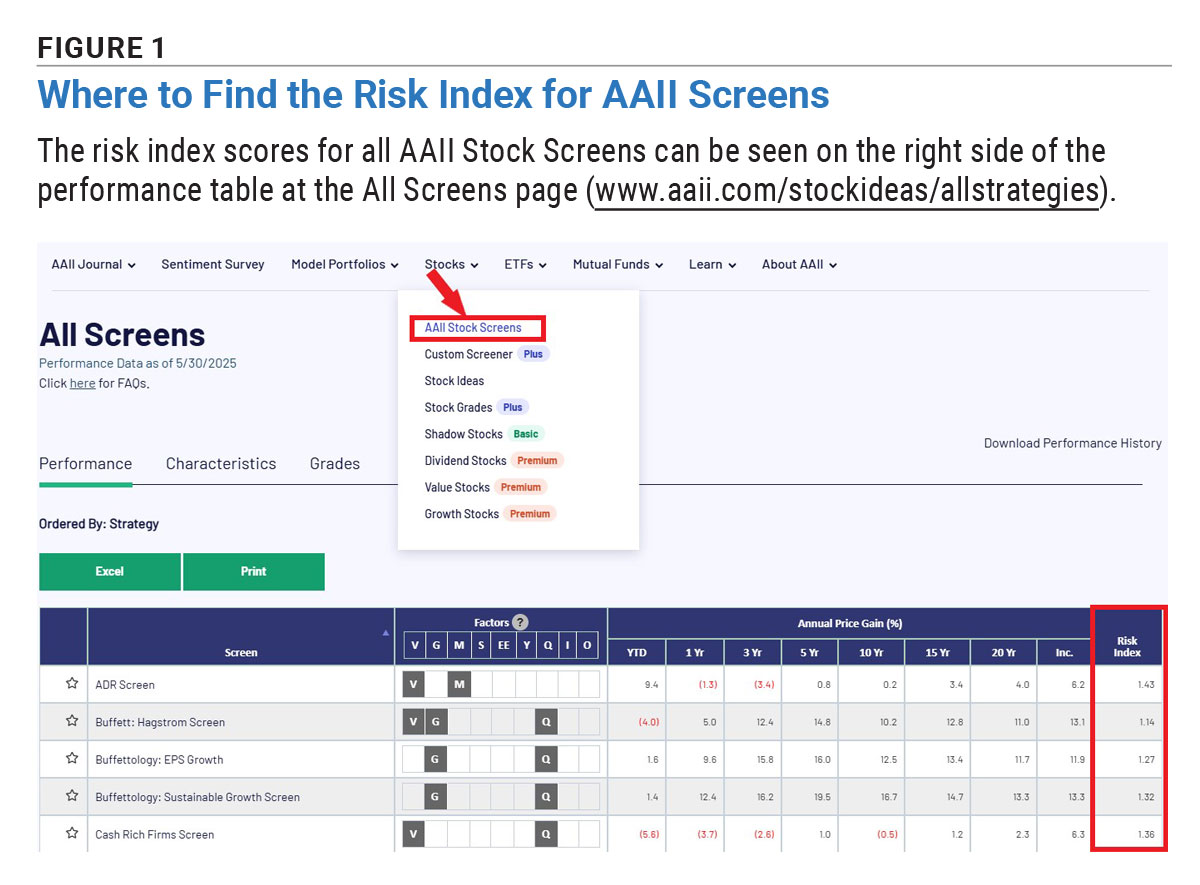
For the 55 stock screens tracked on AAII.com, the risk index is calculated by dividing a screen’s annual price change standard deviation since inception by the S&P 500’s annual price change standard deviation over the same period (Figure 1). For more information, choose All Stock Screens from the Stocks menu at AAII.com.
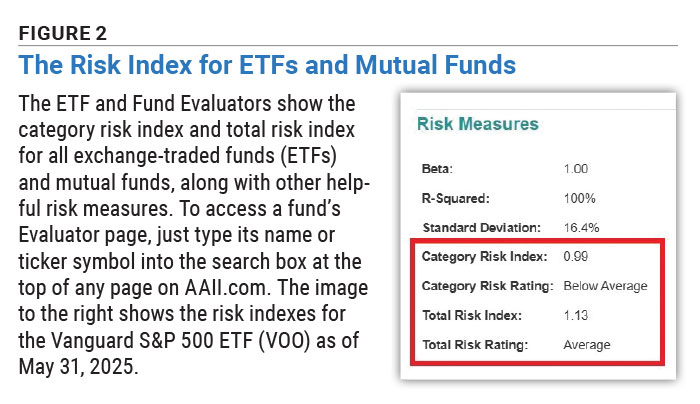
For individual mutual funds and exchange-traded funds (ETFs) with at least a three-year history, AAII’s Evaluator reports a category risk index and a total risk index. The category risk index is the standard deviation of the fund’s return divided by the standard deviation of return for the average fund in the same category. The total risk index is the standard deviation of the fund’s return divided by the standard deviation of return for all funds. The category risk index is accompanied by an A–F grade, assigned based on its percentile rank compared to all funds in the same category. Figure 2 shows an example of a fund’s total risk index and category risk index in the AAII Evaluator.
Investor Professor



ROBERT A from NC posted over 1 year ago:
ROBERT A from NC posted over 1 year ago:
JOHN L from NJ posted over 1 year ago:
You need to log in as a registered AAII user before commenting.
Log InCreate an account