
Is 4.7% the New Safe Retirement Withdrawal Rate?

William Bengen’s latest research shows that adding asset classes allows for a higher withdrawal rate in retirement than 4%.

Charles Rotblut leads a class in AAII's new Essential Investing Video Course. Go to https://www.aaii.com/ves for more information and to subscribe.

  • SAFEMAX defines the highest safe initial withdrawal rate based on portfolio conditions and inflation, now estimated at 4.7%
  • Portfolio diversification and inflation strongly impact withdrawal safety; optimal stock allocation ranges from 46% to 73%
  • Adjusting withdrawal plans is essential; retirees should monitor actual vs. projected rates to maintain financial sustainability

William “Bill” Bengen is a retired financial planning practitioner. His groundbreaking research into retirement withdrawal rates led to what has been known as the 4% rule (raised to 4.5% and now 4.7%). Cynthia McLaughlin and I spoke to him about the updated insights into withdrawal rates in his latest book, “A Richer Retirement: Supercharging the 4% Rule to Spend More and Enjoy More” (Wiley, 2025).
—Charles Rotblut, CFA

Cynthia McLaughlin (CM): To start, you use the term SAFEMAX in your book. It’s a key concept that may not be familiar to all individual investors. Could you define it?

William Bengen: The SAFEMAX is a percentage applied to the first-year portfolio value that is used to determine the first-year withdrawal rate. It is not used in each successive year; instead, investors simply give themselves an inflation adjustment. The SAFEMAX is meant to represent the highest withdrawal rate you could safely take given the circumstances you’re facing when you retire.

What Is the SAFEMAX?

SAFEMAX is William Bengen’s term for a safe maximum withdrawal rate. It represents the highest withdrawal rate you could safely take given the circumstances you’re facing when you retire, according to Bengen.

The 4.7% withdrawal rate is the current Universal SAFEMAX. It is the historical maximum safe withdrawal rate, assuming a 30-year time horizon and Bengen’s diversified seven-asset-class portfolio (55% stocks, 40% bonds and 5% cash). Different allocations or time horizons would change the SAFEMAX.

Charles Rotblut (CR): When we last spoke for the January 2018 AAII Journal article “Insights on Using the 4% Withdrawal Rule From Its Creator,” you had raised the SAFEMAX from 4.0% to 4.5%. Now, your latest book suggests that retirees can start with a 4.7% withdrawal rate. What led you to increase this rate?

Over time, I’ve gone through several cycles of research. During each cycle, I’ve made the analysis of safe withdrawal rates more sophisticated. In this case, I added more asset classes, which increased diversification and returns to the portfolio and therefore had a very beneficial effect on the withdrawal rate. That’s why it went up.

CR: In the past, the only asset classes you worked with were large-cap stocks, small-cap stocks and intermediate-term government bonds, right?

That’s right. That was the 4.5% SAFEMAX incarnation. I added four more asset classes a few years ago—U.S. micro-cap stocks, U.S. mid-cap stocks, international stocks and Treasury bills. So, we now have seven asset classes. It’s still not what most advisers would consider a well-diversified portfolio, but we’re approaching the limits of the value we can get by adding more asset classes. Each additional asset class adds less value in terms of raising the safe withdrawal rate.

CR: So, there’s a point of diminishing returns if more asset classes are added. For retirees, complexity is also an important consideration, particularly in terms of how easy it is to manage the portfolio.

True. Interestingly, there really is no correlation between investment returns and your ultimate safe withdrawal rate, which is surprising. You’d think that higher investment returns would automatically produce a higher withdrawal rate.

The Joker in the deck is inflation. If you have a period of rising investment trends with rising inflation, the rising inflation increases the withdrawals and offsets the benefit of the investment return. There are a lot of nonintuitive things happening in this world.

CR: Several people have been calling for a lower withdrawal rate, say 3.0% or 3.5%. Obviously, you’re going the opposite way. Why do you think the 4.7% withdrawal rate will work despite others’ concerns and calls for a lower withdrawal rate?

It’s important to recognize at the outset that the 4.7% rule is actually a worst-case scenario.

I studied 400 retirees retiring from January 1926 through the end of 2024, starting with the first date of each quarter. Out of those 400 retirees, the 4.7% rule was only applicable to one of them. The other 399 retirees all had higher starting withdrawal rates [Figure 1]. It may surprise people to know that the historical average across all 100 years is 7.0%. There are even folks who are lucky to get 8.0%. 
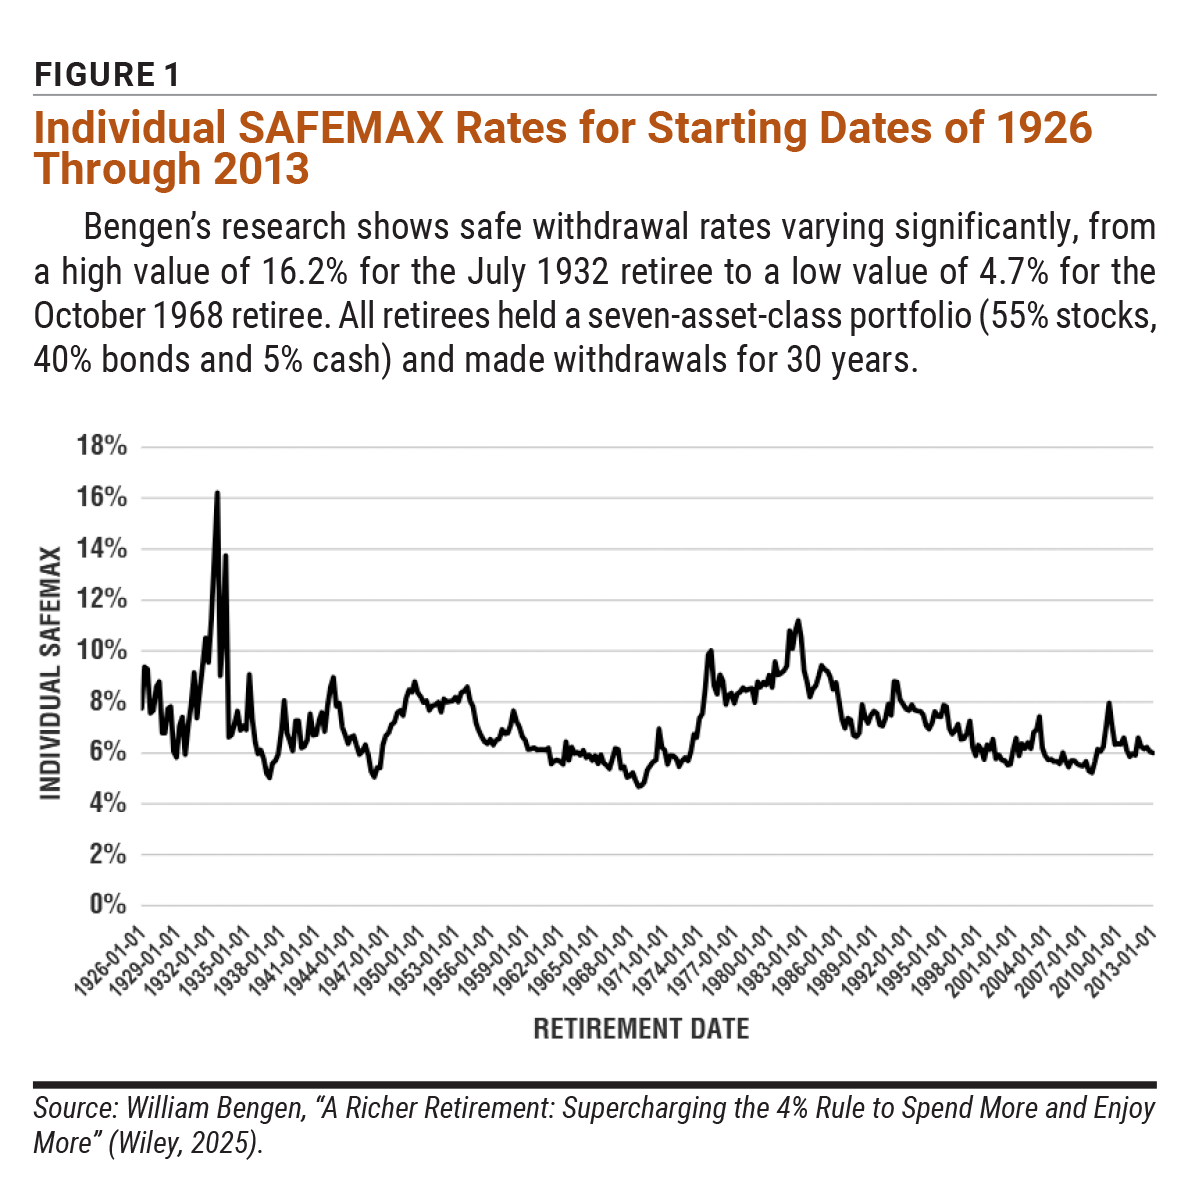
Figure 1 Individual SAFEMAX Rates for Starting Dates of 1926 Through 2013

For example, I estimate that the folks who retired during the Great Recession’s bear market, which bottomed in April 2009, would be able to support an 8.0% withdrawal rate from that low point because stocks were so cheap. We haven’t seen anything comparable since then.

I don’t see any justification for going lower than 4.7%. Even if I look at the current market, which is very expensive—and the more expensive the market, the lower the withdrawal rate—the lowest withdrawal rate I’d recommend is 5.25% or 5.50%. That’s still an increase over the 4.7% worst-case scenario, but it’s a lot less than the 100-year historical average of 7.0%.

CR: You’ve stated that the earlier a bear market occurs in retirement, the lower the maximum safe withdrawal rate is. You’ve also tied this idea to Robert Shiller’s cyclically adjusted price-earnings (CAPE) ratio. Could you explain this concept?

The idea behind that is if you have a very expensive stock market, you’re probably not far from a bear market. A major bear market early in retirement depresses the safe withdrawal rate because taking withdrawals when stocks are down really damages the portfolio. Similarly, if you choose to increase your withdrawal rates with inflation, high inflation rates force you to increase your withdrawals, which also damages your portfolio. High inflation damages the portfolio even more severely than the major bear markets.

CM: Why did you choose to use the CAPE ratio?

In the May 2008 issue of the Kitces Report, Michael Kitces published a chart showing the correlation between the SAFEMAX for each year of retirement and the CAPE ratio, or stock market valuation, at that starting time. It’s an amazing chart because the two lines seem almost perfectly correlated in the opposite direction. As stock market valuations go up, the safe withdrawal rate drops, and vice versa.

I was excited when I first saw that chart. However, after I did some work with it, I realized that it didn’t provide enough information to specify withdrawal rates to the extent I like to. It required adding inflation into the picture as a second variable to generate more reliable SAFEMAX estimates.

CR: Should retirees be able to financially endure bear markets as long as they stick with that 4.7% withdrawal rate?

Historically speaking, that withdrawal rate is for an ultraconservative person who doesn’t want to risk anything. That doesn’t mean we couldn’t encounter a period where we might go below it, but I don’t see that on the horizon.

CR: On other hand, let’s say someone is lucky enough to experience booming stock markets and low inflation. If they get through the first 10 years of taking withdrawals, is there a time at which they can look at how they’re doing and adjust their withdrawal rate upward? Perhaps they want to spend more later in retirement.

Yes. No type of financial plan, including a retirement withdrawal plan, is carved in stone. It can and should be flexible to make adjustments during its tenure. Typically, retirement withdrawal plans last for at least 30 years, if not more. That’s a long time. It would be highly suspicious if you didn’t have to make some changes in between.

I developed a methodology that allows me to pinpoint a withdrawal rate that’s appropriate for the environment in which a person retires, but it’s not perfect. Things can happen in the middle of retirement. Let’s say you retired in the late 1950s, and in the 1970s, you suddenly face tremendous inflation that you did not expect. You’re going to have to make an adjustment.

CR: Is there anything investors can use to determine when they might need to make an adjustment to their withdrawal rates?

Part of the retirement withdrawal plan I recommend is developing a template. It’s basically a forecast of your current withdrawal rate for each and every year.

To calculate future withdrawal rates, take your portfolio withdrawals and divide them by the value of your portfolio at the start of each year. In a normal plan, that withdrawal rate starts at about 4.7% and, in 30 years, becomes 100% because the plan assumes that you will take out all your money in the last year.

There should be a gradual increase in this curve of withdrawal rates. To make sure you’re on track, you can compare the estimated curve of withdrawal rates to your actual results. If you fall way above or below your estimate, it’s time to ask yourself if you need to make an adjustment. You won’t always need to make an adjustment, but it’s good to check.

CM: You’ve noticed a sharp increase in the odds of running out of money when the SAFEMAX rises above 5.25% for the 30-year period. Is this a result of having to rely too much on high returns?

Higher withdrawal rates deplete the portfolio faster. So, as you would expect, the higher your withdrawal rate, the shorter the period during which you’ll be able to safely make withdrawals.

CM: With inflation and stock valuations influencing withdrawal rates, are there any general observations you can give regarding factoring each element into an initial safe withdrawal rate?

In my latest book, I developed tables that are sorted by inflation regime—low, moderate or high inflation—and then by market valuation. They show what the SAFEMAX is for a given environment and allocation [Figure 2].
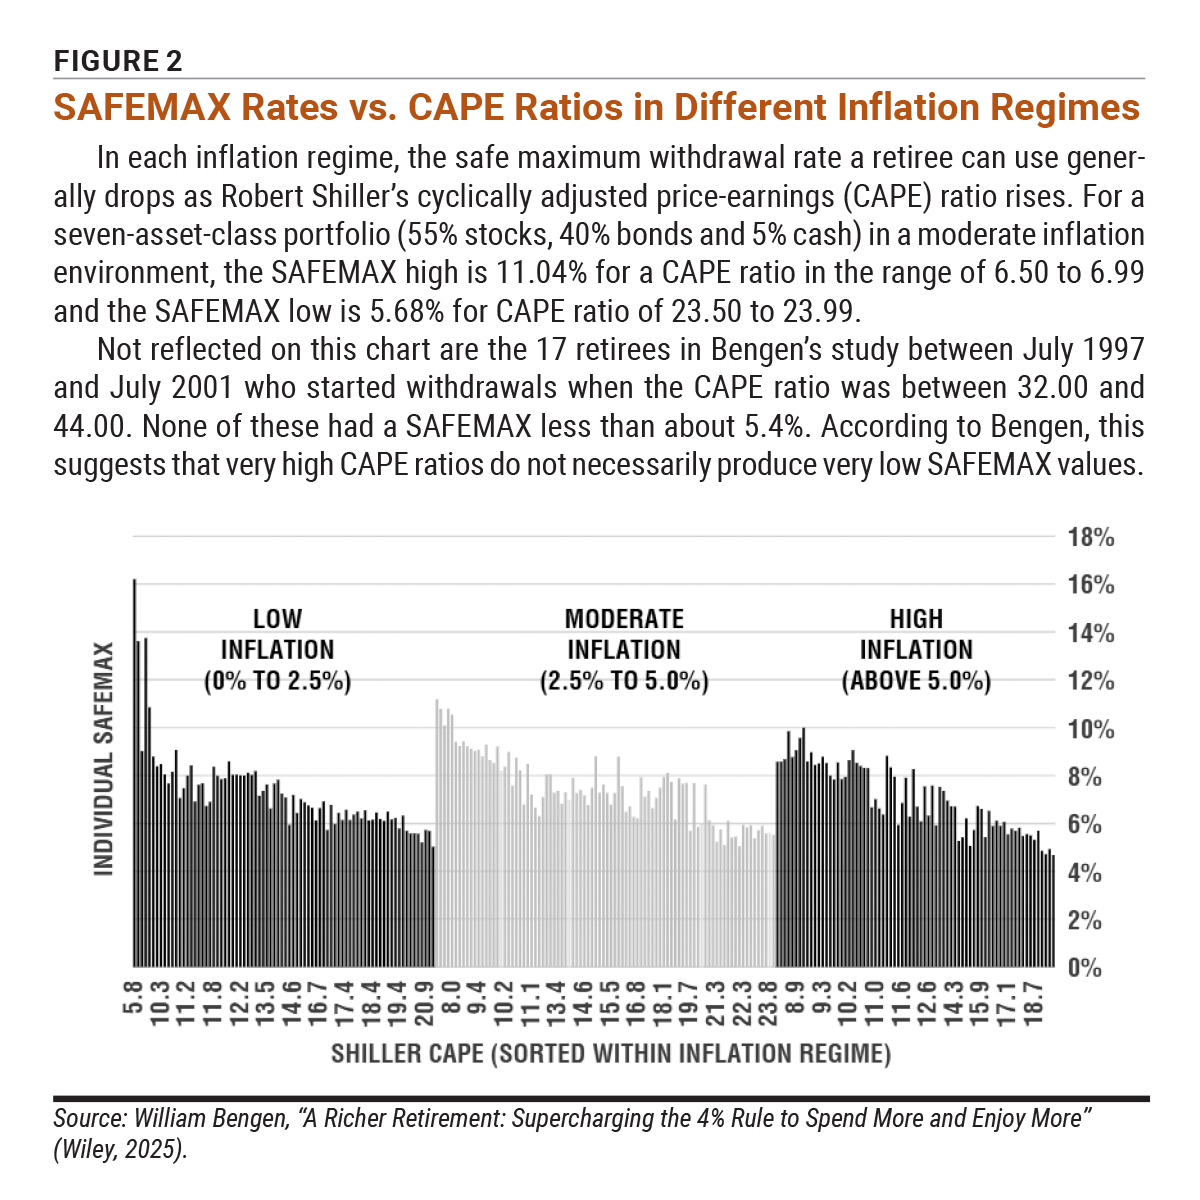
Figure 2 SAFEMAX Rates vs. CAPE Ratios in Different Inflation Regimes

The safe withdrawal rates shown are not supposed to be 100% accurate. We’re dealing with relatively little data for current phenomena, and the markets are changing, so you have to be careful about expectations. Just because you have a safe withdrawal rate doesn’t mean it’s going to last for your whole retirement.

As we discussed earlier, you may need to make some adjustments, and they may not all be negative adjustments. You may actually be able to increase your withdrawal rate. For instance, people who retired into the huge bull market of the mid-1980s got a significant tailwind from investment returns, and they were able to achieve much higher withdrawal rates than I would have estimated based on circumstances at their retirement date.

CM: Your research on the SAFEMAX shows that the safe withdrawal rates are approximately even for stock allocations between 46% and 73% of the total portfolio. Could you elaborate?

That observation applies exclusively to the worst-case scenario—the individual who retired in October 1968. That was one of the first charts I ever created. I put an updated version of it in my book, and that’s when I realized that I was dealing with a phenomenon that had a lot of unexpected aspects to it.

When I originally did the research, I thought that if you increase your stock allocation, your withdrawal rates should go up because you have higher returns. But bear markets intrude. As it turns out, if you keep your stock allocation between about 46% and 73%, you get about the same withdrawal rate no matter what the stock allocation is within that range, which is kind of fascinating.

This shows you the dynamics of interplay between stocks and bonds in a portfolio, particularly during a bear market. If you go too high in stocks, bear markets can really damage your portfolio and reduce your withdrawal rate. Going too low in stocks has a similar effect—not getting enough oomph in the returns reduces your withdrawal rate.

CM: Beside allocating to bonds, you suggest allocating around 5% to money market funds. Since high cash allocations create a drag on returns, is this close to the upper limit?

The higher your money market allocation, the lower your withdrawal rate because it’s a low-returning asset. Even though it has very little volatility, which is great, it doesn’t give you very much return.

You have to find a level of cash you’re comfortable with—ideally somewhere between 5% and 10%. I wouldn’t go much beyond that because I think you’d just be cutting off your nose to spite your face.

I recently read an article about a study into asset allocation in retirement. The authors came to the conclusion that the best allocation is 100% in stocks during retirement—more specifically, 37% in international stocks and the remaining 63% in U.S. stocks. That really surprised me, but they may have a point.

If you take a look at the worst-case scenario, the 4.7% rule, that happened in 1968. It so happens that international stocks did very well during that period. That covered the worst-case scenario and raised all our goal rates.

The question I have is: Who is going to have the courage to have a 100% stock portfolio when the market is down 40% or 50%? Will they be able to stay with their game? I think it’s safer to have a more balanced portfolio and a potentially lower withdrawal rate but know that you’re not going to be scared out of your position when the time comes.

CM: You mentioned that small- and micro-cap stocks boosted the SAFEMAX. Which asset class surprised you the most in terms of its effects?

When I added small caps to the portfolios I tested, they raised the withdrawal rate from about 4.1% to 4.5%, which is a pretty big bump for just one asset class. Micro caps are very similar, but since we already have a small-cap stocks allocation, they don’t provide quite as much of a boost as the small caps originally did.

Additionally, there are asset classes that I haven’t included, such as Treasury inflation-protected securities (TIPS), commodities, precious metals, real estate, emerging markets stocks and so forth—all of which you’ll see in a well-diversified portfolio. I think they’re probably all worthwhile. However, I don’t think they’re going to have a major impact on the withdrawal rates that I’ve developed up to this point. Once again, it’s an issue of diminishing returns.

CM: Thinking about the Financially Independent, Retire Early (FIRE) movement, those who are interested in retiring early may want to weight more heavily to stocks. When is the best time to start moving to a more conservative portfolio? And, when doing so, would you suggest that investors use the 55% stock/45% bond allocation that you discuss in your book?

I suggest that you start about five years before retirement. That’s long enough to cover any bear market that might occur. As far as allocation goes, take a look at where you are and where you want to be at the beginning of retirement. If you want to get to a 60% stock/40% bond allocation and you’re currently using an 80% stock/20% bond allocation, you might want to reduce your stock allocation gradually over the next five years to bring it in line.

You can also do it all at once, but, in my opinion, the longer you can stay in stocks during the accumulation phase, the better. I hate getting out of stocks when you’re trying to accumulate money because it’ll just cost you returns. 

Discussion

DAVE G from TX posted about 1 year ago:

WB, When you say "It may surprise people to know that the historical average across all 100 years is 7.0%." I get a little skeptical if you really are talking about a simple arithmetic average. You are certainly aware of the fact that you can easily drown crossing a river with only 1-foot average depth.


DAVE G from TX posted about 1 year ago:

WB, is there a reason why you still only use 30 years. I have found moving this out to 40 years catches a lot more cases - meaning that 30 years is not enough time to say with confidence that you won't run out of money if your retirement goes longer. Also, if your charts are ending with significantly less money than when you started you risk a similar catastrophic failure near the end of life, from a large increase in expenses, just like the case of very poor market performance on the front end.


DAVE G from TX posted about 1 year ago:

WB, I agree with your conclusion that with "your stock allocation between about 46% and 73%, you get about the same withdrawal rate no matter what the stock allocation is within that range." However, the equity allocation does adjust what I would call your "sleep factor." At near 80% you suffer near the same volatility that a 100% equity portfolio would suffer.


BARRY J from TX posted about 1 year ago:

Bill Bengen first articulated the “4%” rule of thumb for retirement withdrawal rates, which was later popularized by the 1998 Trinity study, which used the same data as Bengen. Bengen later revised this 4% rate to a 4.7 ”SAFEMAX” rule discussed here AND revised it to 4.5% for tax-free assets and 4.1% for taxable assets. I have a series of issues with Mr. Bengen’s article. #1 Mr. Bengen’s SERIES OF MULTIPLE “just so” assumptions and DISCALIAMERS following almost every benefit he proposes to deliver and his consistent reliance on generalized straight-line trends (that mask the high probability of frequent volatility variations), back-testing data, his MAXSAFE product looks like an Edsel before the recall. #2 A few of the more curious [I counted 13] disclaimers include: (1) “There are a lot of nonintuitive things happening in this world.” [No kidding. Here are a few: (2) “There really is no correlation between investment returns and your ultimate safe WD rate, “ (3) “4.7% rule is a worst-case scenario.” “I studied 400 retirees retiring from 1926-1924.” [I need to see (a) the 1926-1935 retirement data, (b) 1929-1953 depression recovery data, (c) pre-1936 SSI retirement data, (d) the inflationary 1970s data, and (5) the pre-ERISA 1974 retirement data.] (4) “The safe WD rates shown are not supposed to be 100% accurate.” (5) “We’re dealing with relatively little data for current phenomena, and the markets are changing, so you have to be careful about expectations.” (6) “Just because you have a safe WD rate doesn’t mean it’s going to last for your whole retirement.“ (7)“the plan assumes that you will take out all your money in the last year.“ (8) “I put an updated version of it in my book, and that’s when I realized that I was dealing with a phenomenon that had a lot of unexpected aspects to it.” That is a short list of a dozen disclaimers and suspiciously beneficial “just so” assumptions. #3 “Nonintuitive” – (“I don’t understand why something happened.”) is not the same as a “counterfactual” – (“The events I am using as examples did not happen.”) You cannot use counterfactuals as support for an argument. SAFEMAX relies on counterfactual events that never happening. #4 Many retirement plans have been humbled by betting on counterfactuals – betting that a series of events would NOT happen and they did -- sufficiently early in the planning collating sequence that they changed ALL future outcomes. #5 1929 was such an event. It took 25 years for 1929 investors to recover to their 1929 asset price levels (Exhibit 1). The recent increasing frequency of drawdowns over 20% (2000 and 2008) conspired in tandem to be the #2 largest drawdown that similar 15-year recovery period to get back to 2000 levels (Exhibit 2). #6 The name “SAFEMAX” sounds like a product hawked to insomniacs on late-night TV. Charles and Cynthia prompted for more specifics, but the Bengen’s’ parade of generalities continued. The quoted statements above confirm that (A) SAFE MAX is not safe, and (b) SAFE MAX is not the maximum; it’s an estimated guess based on specious data (see list above), which the demurrages, deflections, and disclaimers stress. #7 I see this product as “MISTAKEMAX.” I reject the whole SAFEMAX program. Besides the word “safe” in the name, you should always run from any offer any financial advisor offers you that uses the word “safe” in a product name. The only thing “safe” about paying a financial advisor for “help” is that you will be the one who pays for the “safety.” #8 Making a larger WD in Y1 -- when you have the most money -- sounds like a rookie mistake that will breed more withdrawal mistakes. The magnitude of these “safe mistakes” will be compounded over 30 years, adding at least a 50% “REAL RISK” (Cloonan’s definition) to this plan. #9 Using a higher rate of inflation as THE “multiplier” that “inflates” the possibility to “inflate” the remaining portfolio balances over time also sounds like a rookie mistake. Yes, you do receive “more” income during inflation, but that “inflated” money is exactly offset by the ”deflated purchasing power it brings. #10 Adding exposure to 4 “non-traditional” assets classes – that Mr. Bengen acknowledges adds no diversification -- requires the retiree PF manager to diminish the US asset base he/she has accumulated and MANAGED over 25-50 years – the very thing (as Willie would say) “what brung them to the [retirement] dance.” #11 Papa Bear’s (100% equities) porridge OR Baby Bear’s (100% bonds) porridge AND what Mama Bear thought of her new “7 asset” porridge we will never know. #12 The (unproven) conclusion that with "your stock allocation between about 46% and 73%, you get about the same withdrawal rate no matter what the stock allocation is within that range" is an interesting artifact from 1959 book, Portfolio Selection.” In the 1950’s the only portfolio allocation program available to Markowitz was “mini-max,” and early Operations Research program from WWII used to estimate ballistic trajectories, which produced the famous “efficient frontier” curve that led to HM selecting the 60/40 portfolio allocation as the “model” portfolio for “max” return AND “mini” risk. Bengen’s “46% and 73%” allocation spread straddles and centers on the same point on HM’s 60/40 “model” portfolio. Bengen claiming (without reference) this as his discovery is like Columbus discovering America. · Minor intellectual nit-picking aside, my biggest concern is that retirees will only discover they have sunk below the required expected run rate trajectory AFTER it’s too late to recover. This is not a good place to be. Mr. Bengen will not be there to reassure them, and certainly will not remunerate them, due to the “best efforts” clause in this CFA/CFP/publisher disclaimers. #14 As we Boomers turn 80, we need to never forget that we all have big bullseye on our “assets” that every Millennial/Gen X/Gen Y/Gen Z, who hasn’t made their “FIRE” goals yet, seeks to exploit AND they have organized themselves into various cabals of “retirement advisors” who seek out “SAFEMIN” credentials, travel in the concentric promotional circles, and reenforce each other’s bona fide by quoting each other’s research for support. This is exactly the problem Powell’s 2023-2024 monetary policies produced for 2025. The counterfactual is that this can happen again. “Wrong way betters never win.”


VICTOR S from NC posted about 1 year ago:

Barry J raises some interesting points. My view is these things are rough data points in a bigger universe. Countless phrases exist like "past returns are no indication of future returns" or "your mileage may very (YMMV)" to explain this. Would you put a lot of trust in a weather forecast for next week, much less 30 years into the future? In the event, folks do need a framework and one built on data like this one, despite its flaws, can serve as a useful guidepost.


ROBERT A from NC posted about 1 year ago:

I'd never sleep if my portfolio suffered severe declines because of my withdrawals from it. I expect volatility and can live with it, but over the long haul, I want my assets to keep GROWING---FOREVER! Oddly enough, I'm pretty sure they would do that with a 5% withdrawal rate, but I still think it would be foolish to apply such a high rate of burn. The best ingredient for a long, happy retirement is FRUGALITY!


GARY J from CA posted about 1 year ago:

20 years ago I started planning my retirement. I found the 4% rule useful but difficult to use. What securities should I sell to generate my 4%? What if the market tanked during my first retirement year? While 4% withdrawals seemed to make logical sense, the strategy was too stress-inducing for me. I began to experiment with an alternative strategy. I wanted to leverage the compounding magic of dividend reinvestment. But I wanted a higher yield than was available from Coca-Cola and J&J. So I began purchasing closed-end preferred stock funds instead (FFC, JPC, FPF). Over the past 20 years I’ve received annual dividends of 7-10% (paid monthly). I spend what I need and reinvest the rest in additional fund shares. And my dividends are mostly qualified (taxed at capital gains rates). I have never sold a single share from my portfolio. I sleep well at night. I have more than tripled the value of my original investment over 20 years while avoiding stock market risk. Closed-end preferred stock funds are concentrated in financial services companies. But the issuers are high quality (Bank of America, JP Morgan Chase), and preferred dividends must be paid before any common dividends can be paid. Closed-end funds also use leverage which can increase price volatility. But I don’t ever intend to sell any shares – I care only about dividend sustainability. (While closed-end preferred prices fell during the financial crash of 2008-9, dividend payouts stayed remarkably constant). I’m sticking with my 20-year closed-end preferred fund retirement strategy. I’m generating twice the return of the 4% rule without touching my principal. GARY J from (CA)


BARRY J from TX posted about 1 year ago:

Charles, #1. A 08/13/25 Morningstar report, "MIND THE GAP, "estimates the average dollar invested in US mutual funds and exchange-traded funds earned 7.0% per year over the 10 years ended Dec. 31, 2024 (“investor return”). That’s about 1.2 percentage points per year less than these funds’ 8.2% aggregate annual total return (“total return”) over that span ... assuming an initial lump-sum purchase. That 1.2 percentage point “investor return gap," which is explained by the timing and magnitude of investors' purchases and sales of fund shares during the 10-year period, is equivalent to around 15% of the funds’ aggregate total return." #2. That 10-year period (2015-2024)can easily be extended 15 years back to 2000 when the tag-team double whammy of the 2000-2002 dot.com and 2008-2009 Great Recession *and their recovery periods.) #3 Although not an "apples to apples" study as Mr. Bengen's, this should concern the AAII retirement community who Mr. Bengen tried to convince them that the tornado was over and "we are not in Kansas anymore." The moral there, as it is here, is "pay no attention to the man behind the curtain." #4 A long-term DECREASE IN RETURNS of 1.2% coupled with a Fed expected/tolerated 2% INFLATION rate in a period where near-cash (CDs, MMFs, etc.) returns up to 4.5% sounds like there is only 1.3%. Mr. Bergen is advocating that retirees can RAISE WITHDRAWALS from HIS "4.0% rule" to 4.7%. That sounds like retirees should expect to have "a safety margin" of 0.8% ... and #5 these are averages that do NOT include (1) LOWER returns during BEAR markets (that follow bull markets every time like Kansas droughts follow rain), (2) INFLATION SPIKES due to INCREASED government spending (like 2022-2024) and RISING national debt, AND (3) price RISING price momentum/valuations/inflation to support EPS bottom line (profit) expectations that drive today's BULL markets. #6 Someone please ask Auntie Em to open the root cellar doors and tell Mr. Bergan that he just broke the piggy bank the nice lady is proudly holding in the photograph above ... and that AAIIers are not Munchkins. #7 I add ... "Sick' em, Toto."


JAMES N from VA posted about 1 year ago:

When Bengen speaks of a 40% bond allocation in the SAFEMAX portfolio - exactly what bonds is he talking about (this question also applies to many other AAII articles which talk about investing in "bonds"). Does this include corporate bonds only, or does it also include the various government-issues like T-Bills, T-Notes, T-Bonds, and Municipal Bonds? If so, wouldn't it make sense to also include CD's (which generally are government insured) under the category of "Bonds"? If not, why not?


SHEILA A from CA posted about 1 year ago:

My biggest concern is the fact that in the last year of the retirement, one will have only the last 4-4.7% left assuming everything works out which I am very skeptical. Last few years of life are the ones with very high expenses for either in home care or nursing home care and the amount left for that year will not be enough. I hope readers don’t use this no without doing their own research based on their situation.


BARRY J from TX posted about 1 year ago:

Well thought out, Shelia. I add ... and Mr Bengen will be nowhere in sight.


BARRY J from TX posted about 1 year ago:

Well thought out, Shelia. I add ... and Mr Bengen will be nowhere in sight.


KEVIN V from NC posted about 1 year ago:

I am reasonably confident in he 4% rule - maybe even in the 4.7% rule. But some questions never get answered. What if you need 32 years of money? (Presumably you won't wake up one day and realize the bank is empty, but still). And why wouldn't you reduce spending from savings when you start collecting SS? That would seem to make the 4.7% even more conservative.


KEVIN V from NC posted about 1 year ago:

I am reasonably confident in he 4% rule - maybe even in the 4.7% rule. But some questions never get answered. What if you need 32 years of money? (Presumably you won't wake up one day and realize the bank is empty, but still). And why wouldn't you reduce spending from savings when you start collecting SS? That would seem to make the 4.7% even more conservative.


GARETH D from MN posted 12 months ago:

I find the article interesting, and at the same time, no matter how it is dressed up, highly theoretical. And, if one wants to apply additional critical thinking, is it even relevant to people who aren't on the margin? Maybe useful for those considering early retirement? People too poor can only wish for a sustainable withdrawal rate. And conversely, those who have been fortunate plus have planned ahead don't need to consider a safe amount to withdraw. As I see it, only those on the margin; just under or just over a theoretical sustainable rate; need to sharpen the pencil. Good comment from Sheila A from CA. 30 years is an inadequate time frame, and to plan to spend to zero at month 360 is foolish. I use age 120 for my planning not expecting to achieve it, but if I approach it, not to worry, I would adjust long before then. To say a little more, those with Social Security can treat it as a bond allocation (example $30,000 annual payments divided by an assumed interest rate 5% = $600,000) that grows over time based on the annual cost of living adjustments. Setting aside the issue of solvency, I suspect many people don't need an additional allocation to bonds. Then there are qualified plans such as the 401s that have RMDs that automatically increase the percent withdrawn each year to a maximum of 50% at age 120 and thereafter. At age 79, the withdrawal percentage is around the 4.7% level. While one doesn't have control over the percentage, withdrawals more than one needs can be invested in something else. One can't control the withdrawal rate of these two sources. But for everything else, my recommendation would be to keep it simple (are people really going to calculate percentages?) and withdraw less than the income provided by those investments and reinvest the excess thereby continuing to grow the income stream.


ROBERT R from IL posted 11 months ago:

If you are running out of money as you approach 30years of retirement and own real estate(personal residence), there is always that asset that can be liquidated or borrowed against as you approach that timeline and so for many at the ripe old age of 95 this will be adequate to see them thru to the end. No need to be so pedantic and worrisome.


DAVE S from CA posted 11 months ago:

For my retirement, I am considering a simple approach-place my portfolio in VOO, withdrawals calculated on RMD tables. What cash needs I have sit in my bank/money market. Any dividends would be paid to cash and re-invested at the beginning of the year. Due to RMD calculations, the % of withdrawals will go up slightly each year, however they would be reduced in a down market. This means living on RMDs calculations along with other income-Social Security, etc. which is doable. In an emergency, draw first from cash in the bank, then look at drawing from equity in my home. Comments? Dave S


You need to log in as a registered AAII user before commenting.
Create an account

Log In

Get your free copy of our special report analyzing the tech stocks most likely to outperform the market.

Download the FREE Report Here: