

Related

Portfolio Strategies
Retirees who reduce their portfolio costs by using lower-cost funds realize larger withdrawals and ending wealth.

 How expense ratios impact retirement withdrawals and ending portfolio balance
Retirement portfolios usually contain mutual funds and/or exchange-traded funds (ETFs). These funds charge an annual expense ratio, unlike individual securities such as shares of stock in a publicly traded company or a bond issued by a company or government. All mutual funds and ETFs charge an expense ratio. (Outside of temporary fee waivers, Fidelity’s zero expense ratio mutual funds are the only exception to this rule.)
The annual expense ratio of a stock or bond mutual fund directly reduces the investor’s return, which reduces the amount of money they can safely withdraw during retirement. For example, if a mutual fund with a 1.00% annual expense ratio [100 basis points (bps)] reported a one-year return of 12.5%, the return would have been 13.5% with a 0% expense ratio. Thus, the goal of many investors—particularly retirees—is to build their retirement portfolio with mutual funds and/or ETFs that have low expense ratios.
Of course, a low expense ratio is not the only consideration when choosing a mutual fund. A fund’s historical performance and risk profile are more important, though the higher the expense ratio, the better a fund’s returns need to be to offset it. Published performance of mutual funds and ETFs factor in the expense ratio. Those returns are net of (adjusted for) the expense ratio.
This article examines the impact of mutual fund/ETF expense ratios on the amount of retirement income available to a retiree (based on withdrawals from their portfolio). Portfolio withdrawals are an important source of retirement income for many retirees, but not the only one.
To evaluate the impact of portfolio fees (specifically the collective expense ratios of the funds in the portfolio plus a financial adviser fee, if applicable), a baseline low-cost retirement portfolio was needed. The baseline portfolio in this analysis consisted of seven well-known market indexes. Of course, indexes do not have expense ratios, thus a baseline annual expense ratio of 150 bps (1.50%) was assumed and subtracted from the historical annual returns of the selected indexes.
The annual returns of the following indexes were used to calculate the performance of the multi-asset retirement portfolio in this analysis: the S&P 500 index, Russell 2000 index, MSCI EAFE index, Dow Jones U.S. Select REIT index, S&P GSCI index (formerly the Goldman Sachs Commodity index), Bloomberg U.S. Aggregate Bond index and 90-day U.S. Treasury bills. Each asset class (i.e., index) was equally weighted at 14.29%, and the portfolio was rebalanced annually. The retirement portfolio’s asset allocation is represented graphically in Figure 1.
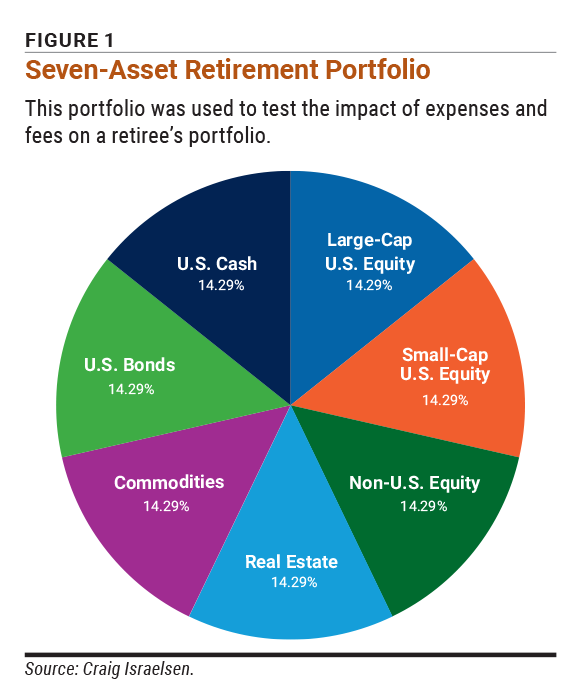
The overall time period of this analysis was the 55-year period from 1970 to 2024. There were 31 rolling 25-year periods over this 55-year period. The first 25-year period was from 1970 to 1994. The second was from 1971 to 1995, and so on.
The amount of money withdrawn from the portfolio each year was determined by the required minimum distribution (RMD) starting at age 73. The first RMD-based withdrawal was 3.77%. The 25th RMD withdrawal was 12.82%. The median 25-year rolling return of this seven-index portfolio was 7.42% (assuming a baseline portfolio expense ratio of 150 bps). When no expense ratio was subtracted, the median 25-year rolling return was 8.93%.
The rolling 25-year periods represent a period of time during which a retiree is withdrawing money from their portfolio. For example, this would simulate the annual withdrawals for a retiree from the ages of 73 to 98. Understandably, some retirees live beyond age 98, but a 25-year period captures the experience for a vast majority of retirees.
The analysis of the impact of fees was accomplished by calculating:
The retirement portfolio began with a balance of $250,000 and a starting baseline expense ratio of 150 bps (1.50%). The expense ratio was then incrementally lowered by 25 bps down to a total portfolio cost of 25 bps.
The ending account balance in the first 25-year period, from 1970 to 1994, was $607,182, assuming the baseline portfolio cost of 150 bps. Recall that the starting balance was $250,000. The total amount of money withdrawn based on the RMD during this particular 25-year period was $1,005,811. This amount equated to an average annual withdrawal of $40,232. The average annual withdrawal and the portfolio ending account balance in the 25th year were then calculated for the remaining 30 rolling 25-year periods. The results are shown in Table 1.
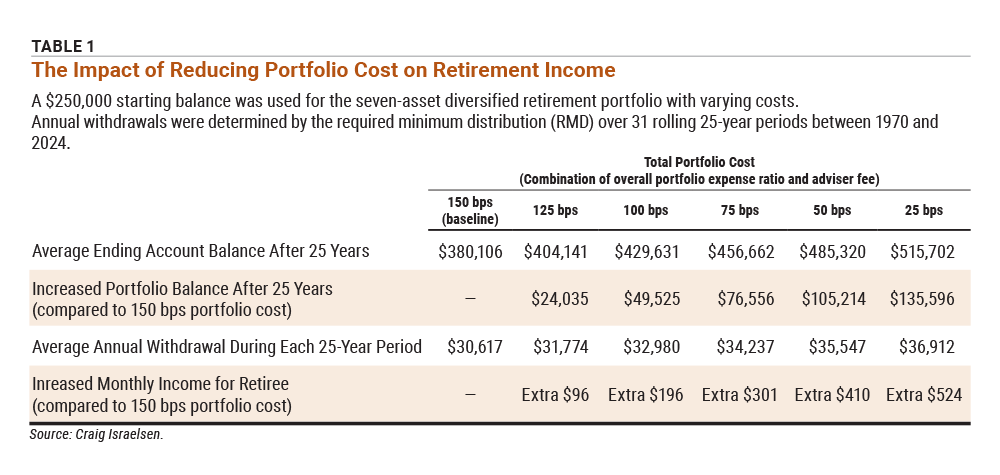
Clearly, keeping portfolio costs down during retirement is very important. As shown in Table 1, by reducing the retirement portfolio’s annual cost from 150 bps (1.50%) to 75 bps (0.75%), the retiree was able to withdraw $301 more from their portfolio each month (based on the average annual withdrawal). Also, the retiree’s ending portfolio balance was over $76,000 larger in year 25 compared to the same portfolio with an annual cost of 150 bps ($456,662 versus $380,106).
Outcomes obviously get better when lowering costs even further. At 25 bps, the retiree had an extra $524 each month (again based on the average withdrawal) and nearly $136,000 more in their portfolio after 25 years of withdrawals ($515,702 versus $380,106).
Here’s the good news: Building a multi-asset retirement portfolio need not be expensive. To illustrate this, I’ve assembled a 65% equity/35% fixed-income portfolio. As shown in Table 2, this portfolio is broadly diversified across 12 asset classes. It has an aggregate portfolio expense ratio of 0.27% as of January 2025. Each of the 12 ETFs is assigned an equal weight of 8.33%.

The era of high-cost mutual funds and ETFs is over. Retirees who reduce their portfolio costs by using lower-cost mutual funds and/or ETFs realize larger withdrawals and ending wealth. A lower-cost retirement portfolio will allow a retiree to withdraw more money each year and have a larger balance down the road without altering their risk profile.
We think you’d like this related webinar! A Data-Driven Approach to Retirement Planning.
Craig Israelsen created the Retirement Portfolio Analyzer (RPA) to let users see how different investment choices, withdrawal strategies and Social Security timing would impact their long-term security. See Israelsen demonstrate his tool in real time and get a tour of AAII’s Retirement Investing from Cynthia McLaughlin.
Portfolio Strategies

Portfolio Strategies

AAII How-To

JEFF S from MN posted over 1 year ago:
JOHN L from NJ posted over 1 year ago:
BARRY J from TX posted over 1 year ago:
KEVIN V from NC posted about 1 year ago:
You need to log in as a registered AAII user before commenting.
Log InCreate an account