



- Model Shadow Stock Portfolio unchanged after September review
- August performance strong for small-cap value stocks, but large-cap growth remains long-term leader
- Selection criteria focus on smallest, cheapest profitable stocks, with quarterly reviews limiting turnover
Participation in the market uptrend broadened in August, with smaller companies outpacing larger firms during the month. The Model Shadow Stock Portfolio gained 12.2% during August, outpacing the 2.0% total return of the S&P 500 index. The S&P MidCap 400 index returned 3.4% during the month, while the S&P SmallCap 600 index rose 7.1%. Earnings, tariffs and growing expectations of a resumption in Federal Reserve interest rate cuts dominated financial news during the month.
While money rotated into smaller, value-oriented companies in August, small-cap companies continue to lag larger firms for the year. The Vanguard 500 Index fund  (VFINX) has a total return of 10.7% year to date, surpassing the 3.2% year-to-date total return of the S&P SmallCap 600 as well as the 5.3% total return of the S&P MidCap 400. The Model Shadow Stock Portfolio is up 6.6% for the year.
Value-oriented companies witnessed stronger returns during August. In the large-cap segment, growth stocks were up 0.8% for the month, while value stocks were up 3.4%. Mid-cap growth stocks gained 2.3% during August, while mid-cap value stocks gained 4.6%. Small-cap growth stocks gained 5.5% for the month, and small-cap value stocks gained 8.8%.
Since its inception in 1993, the AAII Model Shadow Stock Portfolio has a compound average annual return of 13.1%, versus Vanguard 500 Index’s average annual gain of 10.6% over the same period. The Vanguard Small Cap Index fund (NAESX) posted an average annual gain of 9.9% since 1993. Figure 1 shows performance over other time periods.
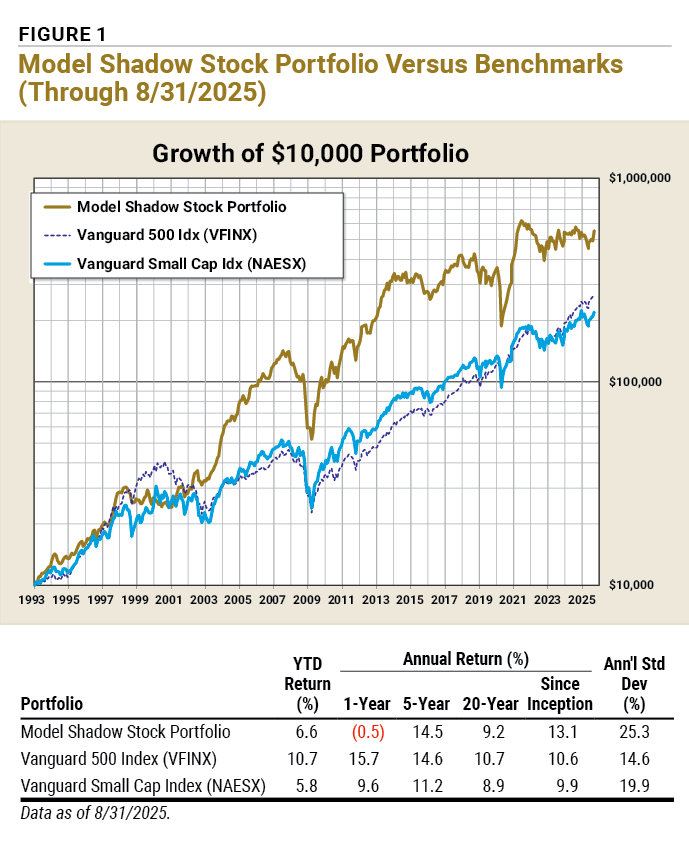
Overall, August hinted at a possible early-stage shift toward value and smaller-cap companies, but the dominant story remains large-cap growth leadership over the last few years even as valuations remain more attractive for smaller firms. A lower interest rate environment generally favors smaller firms, provided the economy continues to expand.
As illustrated in Figure 2, the median price-to-book-value (P/B) ratio of the companies in the S&P SmallCap 600 is 1.72, more than half of the 3.52 median ratio for the companies in the S&P 500. At 3.52, the S&P 500 price-to-book ratio is well above its long-term average of 2.98, while the 1.72 price-to-book ratio of the S&P 600 SmallCap constituents below its 1.90 long-term average.
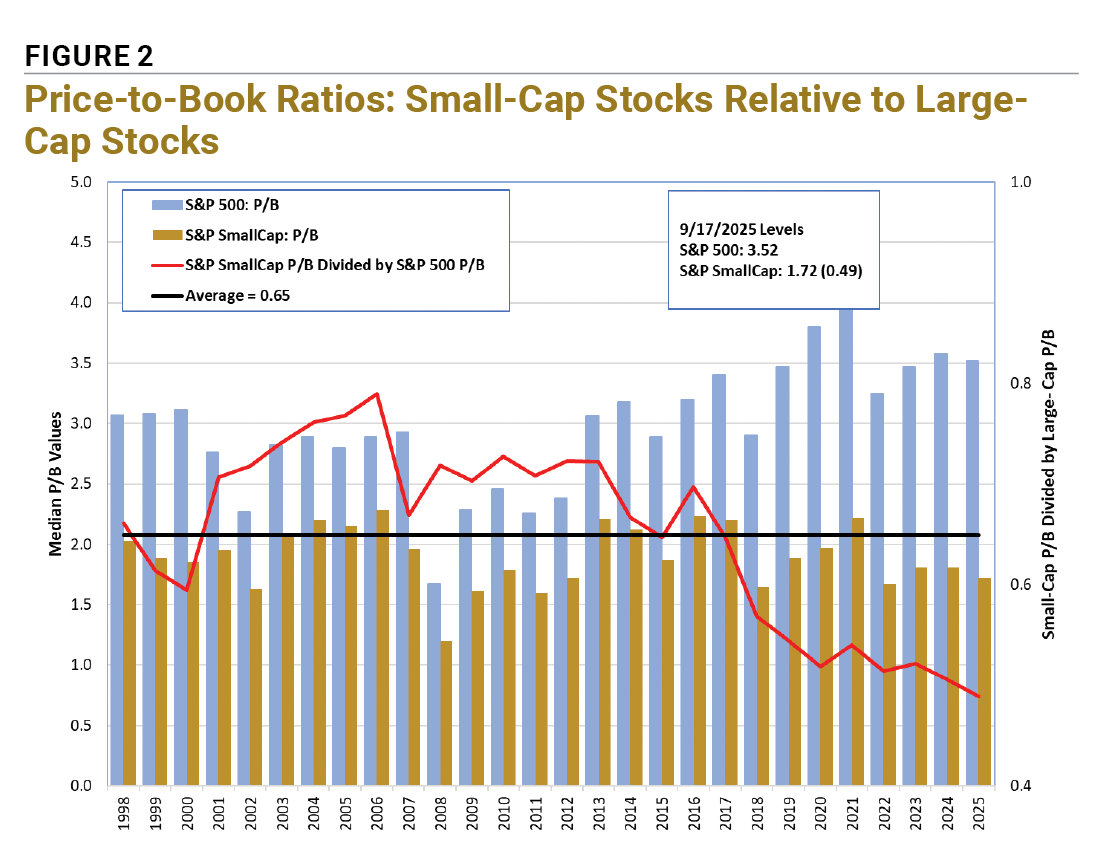
The S&P SmallCap 600 normally trades at a discounted multiple relative to the S&P 500. The discount has averaged 0.65 since 1998. The difference was smallest during 2006 when the discount was only 0.79 (2.28 compared to 2.89) and has been below the long-term average and generally trending down since 2017.
It is common for small-cap stocks to undergo extended periods of underperformance followed by outperformance relative to large-cap stocks. Historically, these cycles have lasted around nine years. A growing number of analysts believe that the relative attractive valuations of smaller companies and a favorable interest rate environment may help boost small-cap returns going forward.
Quarterly Portfolio Review
The Model Shadow Stock Portfolio is reviewed quarterly to determine portfolio deletions and additions. The quarterly review cycle is tied to the reporting cycle of most firms and limits costly portfolio turnover. Stock Investor Pro, AAII’s fundamental stock screening and research database, was used to determine the value and size break points for the quarterly review, using data as of September 12, 2025.
The primary Model Shadow Stock Portfolio selection criteria target the intersection of the smallest 10% of domestic stocks as measured by market capitalization, along with the “cheapest” 10% of domestic stocks as measured by the price-to-book ratio.
Value
The price-to-book cutoff has increased from 0.79 at the beginning of June to 0.92. The current initial qualifying maximum price-to-book ratio is 0.90 and we left it unchanged. Qualifying stocks must have a price-to-book ratio of 0.90 or lower when added to the model portfolio. Stocks in the model portfolio are removed for valuation if they exceed three times the initial maximum price-to-book ratio at the time of a quarterly portfolio review—2.70.
Smith Douglas Homes Corp. (SDHC) has the highest price-to-book ratio in the model portfolio at 2.17. No stocks in the model portfolio exceeded the maximum price-to-book ratio at the time of review.
Size
We examined the market-cap levels of domestic companies listed on the New York Stock Exchange (NYSE) to determine the size cutoff for the lowest decile when adding stocks to the model portfolio. The lowest decile market-cap level increased from $347 million in June to $362 million, using data in Stock Investor Pro as of September 12, 2025. We maintained the maximum initial qualifying market-cap value at $400 million. Holdings are removed if their market cap goes above three times the initial criterion at the time of the quarterly review.
Kimball Electronics Inc. (KE) had the highest market cap in the portfolio at $740.8 million, but this did not exceed the $1.2 billion market-cap maximum at the time of review.
Earnings
If a company has trailing 12-month earnings from continuing operations that are negative, the stock is placed on probation; if a subsequent quarter has negative earnings prior to trailing 12-month earnings becoming positive, the stock is deleted. When available, normalized (non-GAAP) earnings are used to put stocks on probation or remove them.
Lakeland Industries Inc. (LAKE) was the only holding on earnings probation at the start of the quarterly reporting season, and it reported positive normalized earnings during the quarter that were strong enough to take the company off earnings probation.
DMC Global Inc. (BOOM) reported positive normalized earnings for its latest quarter, but quarterly earnings were lower year over year, pushing the trailing 12-month normalized earnings into the red and placing the stock on earnings probation. DMC Global provides various products and engineered solutions for the construction, energy, industrial processing and transportation markets worldwide. The company noted that continued softness in the U.S. onshore well completion market and ongoing tariff issues are affecting its business in the near term.
After the larger-than-usual wave of additions and deletions last quarter, no changes are being made to the Model Shadow Stock Portfolio this quarter.
Shadow Stock Ideas
AAII members can see and research which companies are currently passing the initial selection criteria in the Shadow Stock Ideas table on AAII.com. The list of new Shadow Stock Ideas is updated daily—Tuesday through Saturday. As of September 12, 25 stocks met the initial selection criteria for the Model Shadow Stock Portfolio.The number of passing companies fluctuates as markets levels, sentiment and economic conditions influence the prevailing market cap, valuations and profitability of companies. Market cap and price-to-book maximum levels are adjusted over time, but companies must be profitable to be considered for the Model Shadow Stock Portfolio.
Qualifying companies are those held in the Model Shadow Stock Portfolio that currently meet the initial portfolio addition rules. (They are designated as “currently qualifies” in the Notes column of the Model Shadow Stock Portfolio table on AAII.com.)
As noted in Table 1, 10 of the 25 companies passing the initial selection criteria are currently held in the Model Shadow Stock Portfolio. Two holdings stopped passing the initial selection criteria in September after their better-than-expected quarterly results lifted their price-to-book ratios along with their stock prices. Holdings are not immediately removed from the portfolio after starting to exceed the initial valuation or size requirements—rather, they are held until they exceed the initial requirements by a factor of three. This allows winners to rise, while still maintaining the spirit of strategy.
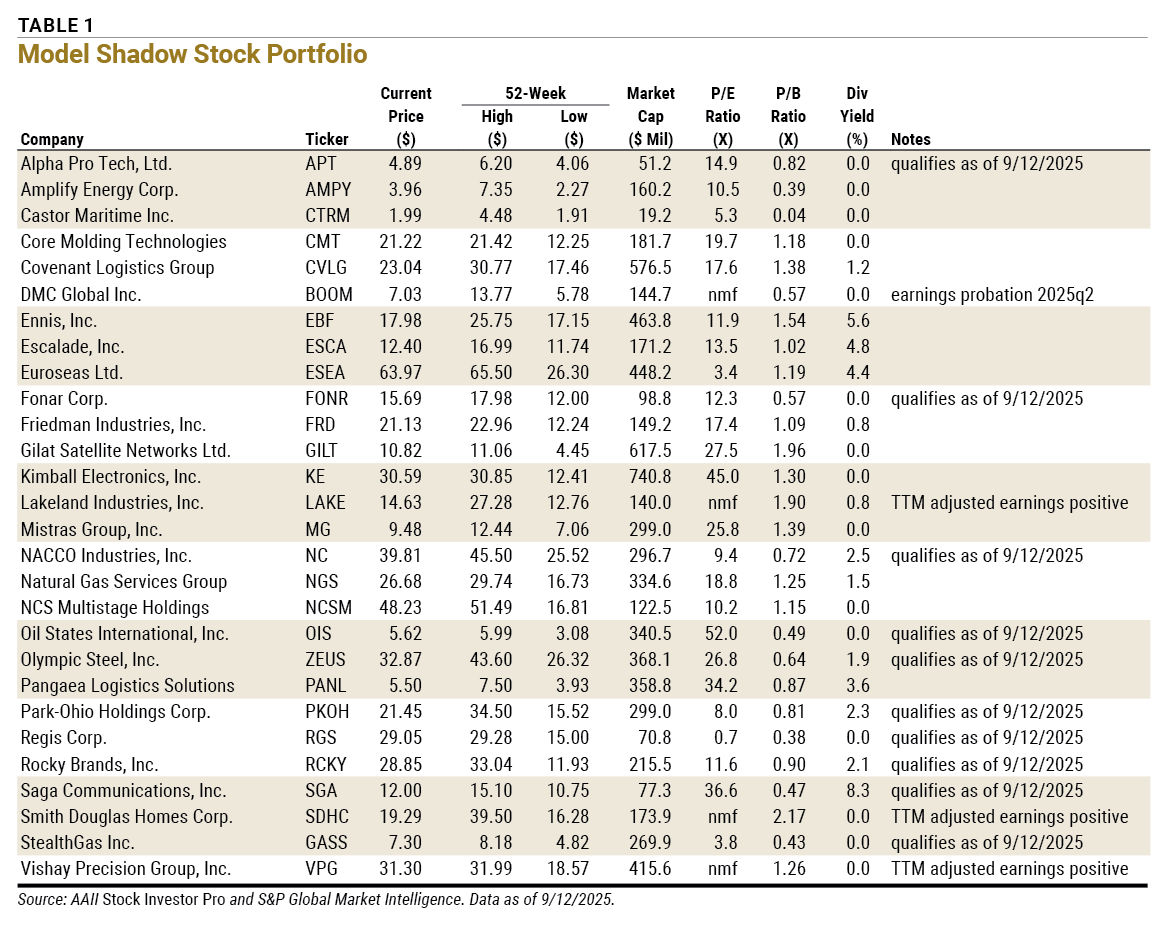
Approaching Size Limit: Stocks are sold if their market capitalization goes above three times the initial maximum criterion and there is a stock to replace it. The current market-cap maximum for initial screening is $400 million. Stocks are marked “approaching size limit” if their current market cap exceeds 2½ times the initial criterion, or $1.0 billion.
Approaching Value Limit: Stocks are sold once their price-to-book-value (P/B) ratio goes above three times the initial criterion and there is a stock to replace it. The current initial price-to-book ceiling is 0.90. Stocks are marked “approaching value limit” if their current price-to-book ratio exceeds 2½ times the initial criterion, or 2.25.
Earnings Probation: If the last 12 months’ earnings are negative, the stock is put on probation; if a subsequent quarter has negative earnings prior to 12-month earnings becoming positive, the stock is sold. When available, adjusted (non-GAAP) earnings are used to put stocks on probation or remove them. Otherwise, earnings from continuing operations are used. The date is the calendar quarter for which the company first reported negative trailing 12-month earnings.
Qualifies As Of: Stock still qualified as an addition when the screen was run with current data. Stocks that don’t currently qualify as an addition are held until they meet one of the deletion rules.
TTM Adjusted Earnings Positive: Trailing four-quarter GAAP earnings are negative, resulting in no meaningful figure for the price-earnings (P/E) ratio. However, adjusted earnings for the period are positive.
Next Portfolio Review
The next quarterly review of the Model Shadow Stock Portfolio will take place following the release of third-quarter 2025 earnings results at the beginning of December. If there are any changes to the model portfolio, they will be announced at the time with a special Model Shadow Stock Portfolio Update email. Sign up for this email so you don’t miss it!
More at AAII.com/model-portfolios
A dedicated AAII Shadow Stocks area that includes:
- Daily updated data plus weekly news on portfolio holdings
- Shadow Stock Ideas list refreshed each day with stocks currently meeting initial addition rules
- A detailed transaction history
- Full portfolio rules and management guidance

Related

AAII Model Portfolios
Releasing Five Makes Room for Four in the Model Shadow Stock Portfolio
Related

Discussion
FREE REPORT

No comments have been added yet. Add your thoughts to the discussion!
You need to log in as a registered AAII user before commenting.
Log InCreate an account