


Related

Portfolio Strategies
Combining a classic stock/bond split with an enhanced equity allocation can add up to more than the sum of the parts.

Paul Merriman leads a class in AAII's new Essential Investing Video Course. Go to https://www.aaii.com/ves for more information and to subscribe.
 Importance of staying the course through up and down markets
You undoubtedly know the benefits of holding 60% of a portfolio in equities and the other 40% in bond funds:
Plus, this allocation can achieve over 80% of the return of the S&P 500 index alone.
In this article, I show you, with numbers, how a combination of this classic 60/40 split with an enhanced equity allocation can add up to more—in some cases, much more—than the sum of the parts.
The goal is a relatively simple portfolio that’s good enough for a lifetime, providing peace of mind along with a generous piece of the action.
My thesis has four components:
These ideas all intertwine with each other. I use them to challenge the conventional practice of using only a large-cap blend index like the S&P 500 as the default 60% equities component.
The magic isn’t just in the ingredients; it’s in the mix. If you get the recipe right, you can wind up with an easy, comfortable way to “tame the bear” when markets go south.
In my 60 years in the investment industry, I’ve seen the smartest teachers and gurus (think Buffett and John Bogle) repeat the same advice over and over: Stay the course.
That’s perfect advice, except for one inconvenient detail: In real life, very few investors can stomach declines of 50% or more in their portfolios. Yet in my lifetime, I have seen that sort of decline happen four times. The market has always come back, but the rebound was only useful to investors who stayed invested.
The “smarter” 60/40 portfolio I suggest changes only the 60% equity part of the mix.
About 10 years ago, I began advocating a four-fund alternative to the S&P 500. It contains equal parts of the four major U.S. asset classes: large-cap blend (equivalent to the S&P 500), large-cap value, small-cap blend and small-cap value.
In this article, I refer to this alternative as “the four-fund combo” or something similar.
The combination takes advantage of the work of a team of academic researchers who focused on stocks with higher expected returns, smaller market capitalization, higher book-to-market ratios, higher profitability and broader diversification. As I outlined in my September 2020 AAII Journal article, “The Four Asset Classes With Great Long-Term Performance,” the brainpower behind this research comes from a team led by two renowned scholars:
They discovered that small-cap stocks tend to outperform large-cap stocks and that stocks with high book-to-market ratios (known as value stocks) outperform those with low ratios. This resulted in a model that’s now widely used in finance, especially in designing passive investing strategies for mutual funds and exchange-traded funds (ETFs).
The academic research is unanimous on two points: First, diversification is the best way to improve the unit of return per unit of risk for a portfolio of equities. Second, the most effective diversification adds asset classes, not just more stocks with similar characteristics.
Let’s look at some numbers.
Right up front, I must tell you that much of this data, especially the data from before 1970, is hypothetical based on academic research. For example, the S&P 500 did not exist before 1957. But the data is widely accepted as accurately representing the reality of the history of the asset classes I discuss.
The S&P 500’s very-long-term (1928–2024) compound annual growth rate of 10.0% should be sufficient to meet the needs of long-term investors. But the four-fund combo’s 11.8% return over the same period is enough to change the whole ball game and to knock your socks off over the long haul.
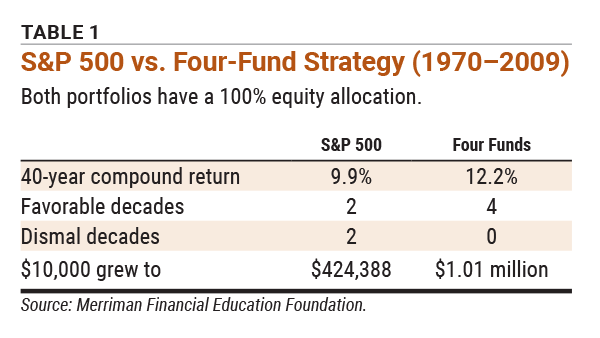
Table 1 examines a four-decade period: the 1970s, 1980s, 1990s and what I call the “dismal decade” from 2000 through 2009. (I think that description could apply to any decade in which an equity portfolio has a compound return less than inflation. As we shall see, this has actually happened twice since 1970 with the S&P 500, but never with the four-fund combo.)
There’s nothing magic about these four decades, but this period is long enough to be statistically meaningful. It contains some really good times and bad times. It also presented newly retired investors with some big challenges.
(By the way, the 2000–2009 decade included two brutal bear markets that left many investors running for the exits.)
That bottom line in Table 1 (what $10,000 grew to) knocks it out of the park. Yet, it’s the simple result of diversification plus plenty of time.
Investing through a “dismal decade” may not seem like a big deal, but it’s crucial if you’re trying to stay the course. That’s the only way to capture the market’s really good times, which, in this case, means the two really good decades in this period: the 1980s and 1990s.
Although the four-fund strategy has more funds, its power comes from additional exposure to various types of companies. The four asset classes I advocate are owned in one form or another by the great majority of investors (whether they realize it or not).
Since 1928, each of these asset classes moved up and down freely. Sometimes they were all profitable; sometimes they were all unprofitable.
But in a year-by-year ranking, the four-part combination spent most of its time in the middle—in fact, it was there 78% of the time. It was neither the best nor the worst. I think that’s a great place for long-term investors who want peace of mind and a reasonable return.
If you’re still a die-hard believer in the S&P 500 by itself, consider this: Over the long haul, its asset class (large-cap blend stocks) has underperformed each of the other three components of this four-fund combo.
The ups and downs of the stock market come at us like a series of ocean waves. Some are gentle. Some are rough.
On a Monday morning in October 1987, stock markets around the world plunged. The Dow Jones industrial average fell 22.6%—its largest one-day percentage drop in history.
Though it is largely forgotten now, that day was known for a long time as Black Monday.
At least that awful drop was something investors could see as it was happening. But that’s not true in the case of a phenomenon known as sequence of returns.
Sequence of returns refers to the order, or sequence, of good times and bad times. It can have a big impact on what investors experience along the journey—both for young investors and new retirees.
Consider the case of someone starting to save for retirement by setting aside $1,000 per year and bumping the amount up by 3% per year. It’s a good plan. What could possibly go wrong?
If they had started in 1970 and put all their money into the S&P 500, their account would have grown to $4,124 after five years (at the end of 1974). But that’s after they had saved a total of $5,310!
Had they invested in the four-fund equity strategy, it would have been even worse: a 1974 year-end balance of only $3,909. After five years of setting money aside that was supposed to be growing into fuel for a better future, this would not have felt like what they signed up for!
Had they known back then that their total out-of-pocket savings of $75,403 would have grown to either $662,853 (the S&P 500) or $1.28 million (the four-fund strategy) after four decades, they could have relaxed and kept going through the rest of the 1970s.
But because the market’s big bad waves came right at the start, they were in danger of wanting—perhaps even needing—to bail out.
And if they bailed out, they would have missed the two terrific decades from 1980 through 1999.
Sequence of returns can be even more insidious for retirees.
There are probably a zillion possible plans for taking retirement distributions. Let’s review some numbers for one scenario calculated using actual year-by-year returns.
Imagine that you retired with $1 million at the start of 1970 and took out $40,000 to spend that year. Then, you bumped up your withdrawal each year to keep up with actual inflation. (Remember, these comparisons are for all-equity allocations.)
In 1973 and 1974, this nice plan ran into the buzz saw of a bad stock market. At the end of 1974, after five years, your balance was only $718,268, much less than the $1 million you started with.
If you were invested in the four-fund combo instead, the numbers would have been even worse! You’d be down to $608,849.
Yet, if you somehow kept the faith and kept your plan going another five years, you would have ended 1979 with $992,563 in the S&P 500 or $1,513,288 in the four-fund combo.
Although you just never know what’s coming next, the only way to get long-term results like those described here is to have a good plan and the ability to stick with it.
For most investors, a “smarter” 60/40 portfolio mix qualifies as a good plan.
My main point in this article is that a 60% equities/40% bonds allocation using four funds can help get you through the tough times.
If you have successfully navigated those challenges, here’s something else the four-fund combo can do for you: After 40 years of the above scenario, my recommended combination would leave you with three times as much money in retirement. This is money you can spend on yourself, give away while you’re alive and/or leave to your heirs.
Table 2 presents decade-by-decade results from the conventional 60/40 model versus my “smarter” version inspired by academic research.
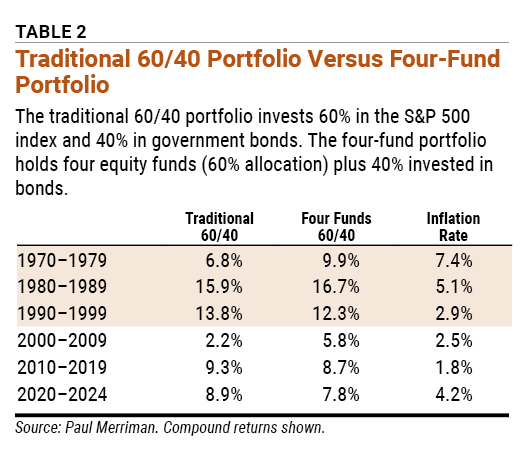
The numbers in this table don’t suggest an overwhelming advantage to having four funds in a 60/40 portfolio. However, the point of adding diversification is not to make more money, though it often does that. In this case, the point is to get you through the rough times, and Table 2 shows that the 60/40 portfolio with four funds did a better job of that than the portfolio concentrating all 60% equities in the S&P 500.
Nobody can know what the future will bring. If I had to present a table that gave future results, the boxes would be filled with question marks.
The bottom line for me is no matter when you start, do the right things and keep the faith. In a 60/40 portfolio, I’m convinced you can do those “right things” better with four equity asset classes instead of just one.
Whether the equity portion of your portfolio is exclusively in the S&P 500 index or in the four-fund combination I suggest, it’s easy for a do-it-yourself (DIY) investor to put together a low-cost 60% equities/40% bonds portfolio using exchange-traded funds (ETFs).
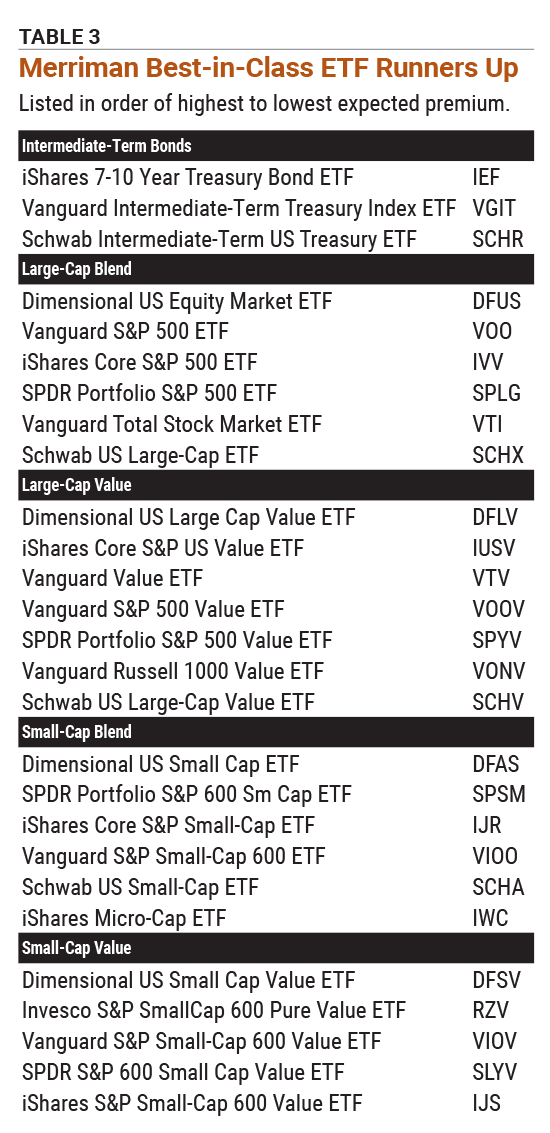
The Merriman Financial Education Foundation has selected the best-in-class ETFs for all these recommended asset classes. Our first choices are listed below. For investors in accounts with limited commission-free choices, Table 3 lists my “runners-up” in each case.
The building blocks:
 (SPTI)(AVUS)(AVLV)(AVSC)(AVUV)
Over time in a portfolio, these funds will stray from their target percentage allocations and need to be rebalanced. Here’s how to do it.
Rebalancing isn’t difficult. Within an individual retirement account (IRA), the transactions shouldn’t have tax consequences. Your results don’t have to be precise, so don’t fret if one of your holdings is 14.5% instead of 15.0%.
Click here for more details on our best-in-class recommendations.
Portfolio Strategies

Portfolio Strategies

Portfolio Strategies

BARRY J from TX posted about 1 year ago:
JOHN L from NJ posted about 1 year ago:
Paul M from FL posted about 1 year ago:
Paul M from FL posted about 1 year ago:
Paul M from FL posted about 1 year ago:
ROBERT A from NC posted about 1 year ago:
JEFFREY D from NY posted 12 months ago:
Paul M from FL posted 12 months ago:
Paul M from FL posted 12 months ago:
STEVE O from NC posted 11 months ago:
Chuck P from USA posted 11 months ago:
Paul M from FL posted 11 months ago:
Paul M from FL posted 11 months ago:
BARRY J from TX posted 11 months ago:
VALERY B from CO posted 11 months ago:
BARRY J from TX posted 11 months ago:
BOB R from CT posted 11 months ago:
You need to log in as a registered AAII user before commenting.
Log InCreate an account