

All-Star Stocks Passing the Most AAII Screens

A First Cut that lists the stocks passing the greatest number of screens tracked by AAII at the Screening area of AAII.com.

Featured Tickers:

This month’s First Cut lists the stocks that passed the greatest number of screens tracked by AAII at the Screening area of AAII.com. This process is accomplished by examining the results of every stock screen and identifying stocks passing more than one strategy.

As of October 17, 2025, 916 stocks passed at least one of the 55 screens tracked by AAII. Only 14 passed four or more screens, and these stocks made the First Cut this month. The stocks are ranked by number of passing screens.

While you cannot automatically consider a group of consensus stocks to be a diversified portfolio, they may present a good First Cut for finding investment candidates.

The A+ Investor Grades in the table provide an indication of the fundamental qualities of the passing stocks. Nvidia Corp. (NVDA) passed the six screens that focus on strong and sustainable growth, which can support a higher price-earnings (P/E) ratio. It has a Value Grade of F, but a better grade of B for growth, momentum and earnings estimate revisions. Its Quality Grade is A.

Optimally, the group of screening approaches a stock passes is diverse enough to capture unique, yet desirable qualities. Further information on each of the screening strategies can be found at the Screening area of AAII.com.
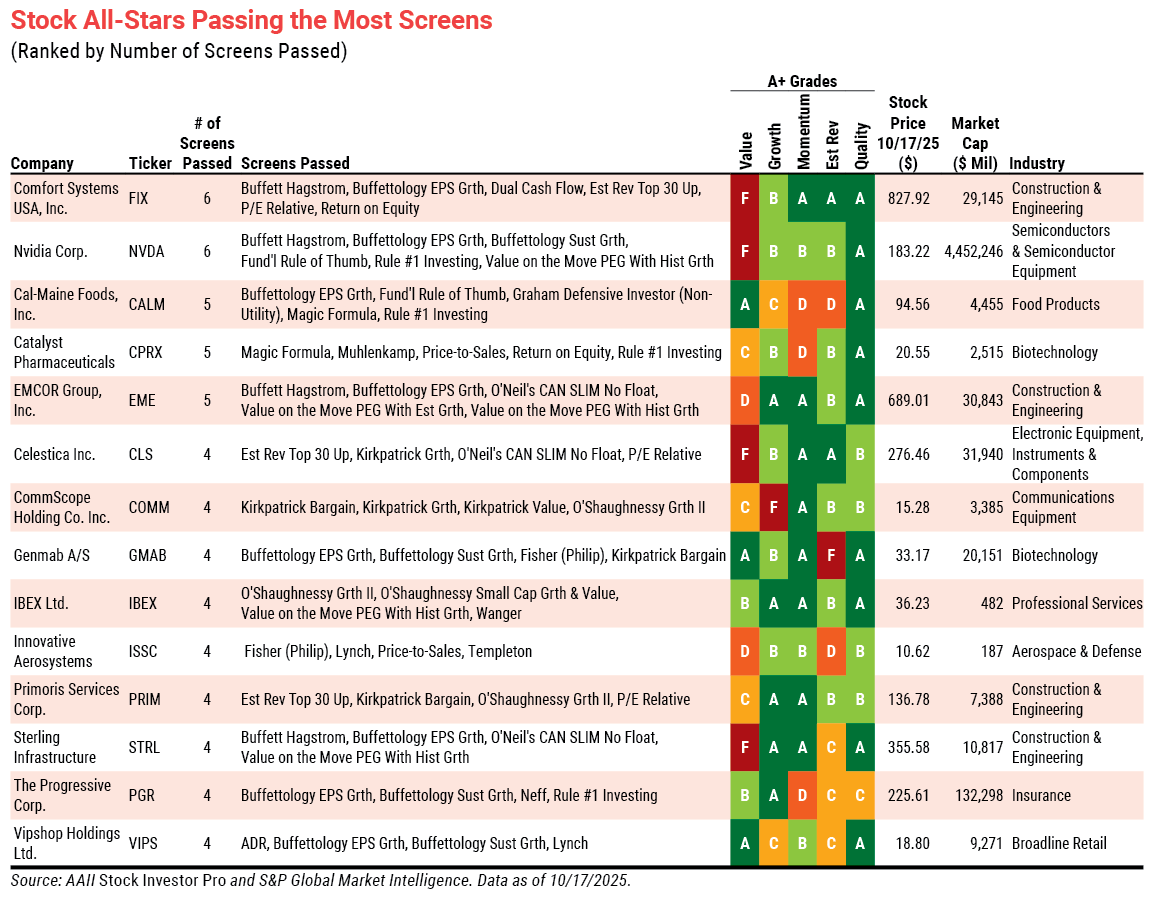
Stock All-Stars Passing the Most Screens

 For a current list, go to the Stocks Passing Multiple Screens tab at My Screens.

Discussion

BARRY J from TX posted 9 months ago:

John, #1 a column or two reporting returns would have been helpful to help members evaluate the relative investment worthiness of these 14 winners. #2 Although there are no comparative data on returns provided, anyone can expect "decent" results by investing in a SPX US Total Market fund as a generally reliable benchmark for expected "return." That comparison would have enabled members to justify the excess return on these 14 funds versus the expected return for an average passive investor and would provide a nominal measure of risk (variation) versus market beta. #3 Every market statistic is useless data without a meaningful comparison data point. #4 Percentage statistics must have base rates to make comparative interpretations meaningful.


R R from TX posted 8 months ago:

I use this approach, except that I select a "three or more"option, since a qualifying stock may often fall into the 3 screen pass category, then recover to a four or more passing result. The stocks in that "three or more" list are then subjected to technical and value analysis methodologies before selecting a stock for purchase. That defines investment worthiness for me, and helps me avoid overbought, overpriced investments. I presently own four on the list shown that met my criteria when purchased.


BARRY J from TX posted 8 months ago:

Somehow, I find that an investment strategy of buying stocks that "pass the most" AAII screens to be like thinking the team that "wins the most games will also win the Super Bowl. The Cowboys have proved that to be an unreliable strategy for the past 35 years - first Romo and now Prescott, who both led in stats multiple times but never got to or won a Super Bowl. I think the error in this logic (that Cowboy fans have come to accept) is mistakenly thinking that "summing the probabilities for each independent event in a series of independent events increases the overall probability of the event. It doesn't. It actually decreases it. Refer to Venn diagrams and Bayes' Theorem to prove this. Or roll the dice a few times. Or just look at the odds charts at any casino.


BARRY J from TX posted 8 months ago:

The more I look at the probabilities for the 14 that made it to the Pass List out of the 916 total possible (0.15% "winners") that were filtered through at some subset of 55 screens, the more confused I get as to what the message is here. #1 The AAII letter Grades screen IN A-C as the top 30% as the passing "winners" and screen OUT D-F grades as the lower 20% that are relative "losers." #2 The 5 AAII Factor Grades (that align back to specific screens) - VAL, GRO, MO, REV, and QUA -- provide simple Occum-like "razors" to look at the probabilities of "winning" (getting into the top 14 of the 916 base). #3 When I screen OUT ANY F ratings as a potential indicator of a particular weakness in one or more of the "critical factors" required for success as an anomaly, only 6 of 14 (43%) make the pass list. #4 If we add D as a marginal indicator of relative weakness, only IBEX is left. #5 Using the same process to screen IN "high indicator" factors rated as "Grade A" produces QUA 9, MO 8, GRO 5, VAL 2, and REV 2 out of the 14 base rate. #6 Even then, you would need to overlay the economic and market cycles to align the factors with the 4 phases to see who is "ascendant" and who is in "retrograde." #7 Fortune-telling using AAII factor grades is very much like reading Tarot cards or Rorschach ink blots.


You need to log in as a registered AAII user before commenting.
Create an account

Log In

Get your free copy of our special report analyzing the tech stocks most likely to outperform the market.

Download the FREE Report Here: