


Charles Rotblut leads a class in AAII's new Essential Investing Video Course. Go to https://www.aaii.com/ves for more information and to subscribe.

Featured Tickers:
Last year’s negative returns in both the equity and fixed-income markets were an example of sequence risk. The negative returns also provided a real-time test for investors of their ability to withstand downside risk from a financial and psychological standpoint.
Rebalancing is one strategy that investors who find themselves more averse to downward volatility can employ to channel their emotions while maintaining progress toward longer-term goals. Rebalancing adjusts a portfolio’s allocations back to target. It gives an investor something positive to do when market turbulence occurs.
Rebalancing can also help investors who either are or will soon be taking withdrawals, such as retirees and those approaching retirement age.
In this year’s update to my ongoing analysis of rebalancing strategies, I look at the impact sequence risk has had on more recent portfolio returns. Analysis of rolling 25-year periods is shown for portfolios based on the AAII moderate portfolio allocation. This year, we’ve expanded the analysis to include portfolios following the AAII aggressive portfolio allocation model.
Before getting into the details, here are a few takeaways:
- Sequence risk affected the returns over the latest 25-year period.
- The ending equity allocation for the non-rebalanced withdrawal portfolio following the moderate allocation was greatly diminished by not rebalancing.
- Even when an aggressive allocation is used, a strategy for navigating bear markets is still very important for those who are taking withdrawals.
Sequence Risk Reared Its Ugly Head
Sequence risk refers to the chance of incurring ill-timed negative returns. It matters far more to those who currently need/will soon need to take withdrawals than to investors who won’t need to take withdrawals for the foreseeable future.
Last year, investors were hit with negative returns for both stocks and bonds. This is just the sixth such occurrence of both falling in the same calendar year since 1878, according to Doug Ramsey at the Leuthold Group.
The impact of the drop in both asset classes can be seen in the ending portfolio balances for the rolling period analyses. As measured by ending value and annualized return, both moderate and aggressive allocation portfolios experienced their worst 25-year period ending in 2022 since the analysis started. (Our analysis starts in 1988 because it is the first year that full-year returns are available for some of the Vanguard mutual funds used.)
Not apparent in the portfolio data is the sequence risk bonds have experienced. Here are the returns the Vanguard Total Bond Market Index fund  (VBTLX) has realized over each of the past 10 years (2013–2022): –2.3%, 5.8%, 0.3%, 2.5%, 3.5%, –0.1%, 8.7%, 7.7%, –1.7% and –13.2%. Returns for the bond fund were below 5% during seven of the last 10 calendar years. Returns were negative four times: 2013, 2018, 2021 and 2022.
Equities posted negative returns during two of the past five years (2018 and 2022).
Rebalancing’s role is to preserve a portfolio’s target allocation, reduce volatility and give a nervous long-term investor a positive emotional outlet. Our analysis shows that rebalancing softens the edges of market volatility. The rebalanced portfolios realized less volatility and better maintained allocations throughout most of the 11 rolling 25-year periods.
Portfolios and Allocations Used to Test Rebalancing
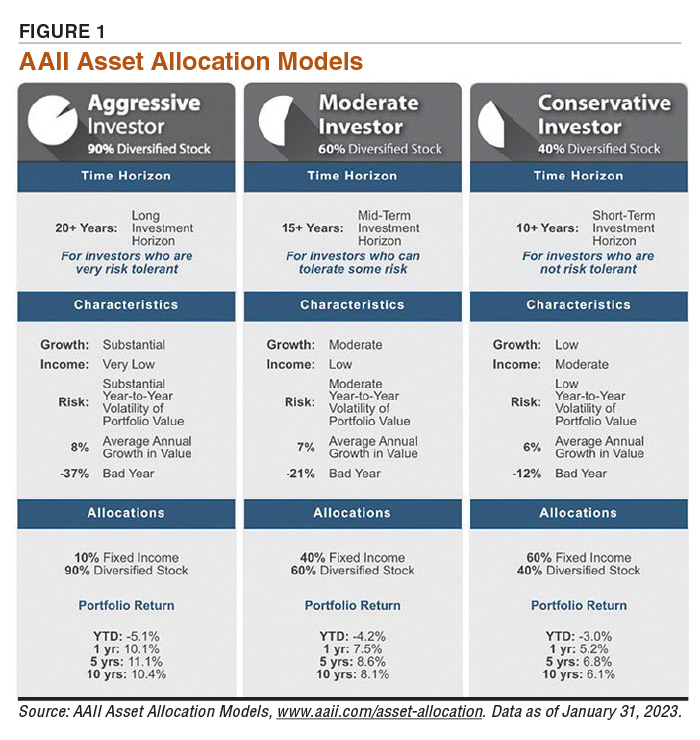
My analysis of rebalancing is based on hypothetical portfolios using the AAII moderate investor Asset Allocation Model and—in response to requests for a more equity-heavy portfolio—the AAII aggressive investor Asset Allocation Model.
The moderate allocation model modifies the traditional 60% equity/40% fixed-income allocation strategy by incorporating greater diversification on the equity side and a shorter duration (meaning less interest rate sensitivity) on the bond side. Specifically, the model calls for allocating 20% to large-cap stocks, 15% to mid-cap stocks, 10% to small-cap stocks and 15% to international stocks. On the bond side, it calls for a 30% allocation to intermediate-term bonds and a 10% allocation to short-term bonds. (An intermediate-term bond fund is used in the rebalancing models.)
The aggressive allocation model has 90% in equities and 10% in fixed income. The model calls for allocating 20% to large-cap stocks, 20% to mid-cap stocks, 20% to small-cap stocks, 20% to international stocks and 10% to emerging markets stocks. On the bond side, it calls for a 10% allocation to intermediate-term bonds.
Figure 1 shows the characteristics and hypothetical returns for the three allocation models.
The portfolios use Vanguard mutual funds to replicate the returns an investor could have realized after fund fees are factored in. The Investor shares class of funds was used for the period of 1988 through 2017. The Admiral shares class of funds was substituted in 2018 because Vanguard stopped offering the Investor shares class to most investors. Part of the goal of this study is to show the returns an investor could have realized in a real-world portfolio, gross of taxes and specific account fees.
Eleven rolling 25-year period models are the subsets, with starting dates ranging from 1988 to 1998.
The hypothetical portfolios are either non-withdrawal or withdrawal. As the name implies, no withdrawals are taken out of the non-withdrawal portfolios.
The withdrawal portfolios assume that a retiree makes annual withdrawals based on an inflation-adjusted 4.5% rate. A withdrawal equal to 4.5% of the portfolios’ balance at the end of the first year is taken. This initial withdrawal rate is then increased each year by the rate of inflation. The strategy is based on research by retired financial planner William Bengen. (Required minimum distributions, or RMDs, were not used because age, account type and life expectancy would impact the calculation of the withdrawal rate.)
The year-over-year change in the consumer price index for all urban consumers (CPI-U) is used to determine the inflation adjustment. This benchmark can be substituted with a different measure.
Withdrawals were taken evenly from each of the funds in the moderate allocation portfolios. In the aggressive allocation portfolios, 10% of the withdrawal amount was taken from the bond fund and the remaining 90% evenly taken from the equity funds.
Rebalancing took place whenever a specific allocation was more than five percentage points above or below its target at year-end. This threshold band is based on research by Vanguard. It allows the portfolio to benefit from short-term momentum in asset class groups while not straying too far from its targeted allocation.
Rebalancing Helped the Moderate Allocation Portfolios
The benefit rebalancing had when sequence risk occurred can be seen in Tables 1 and 2. These tables show 25-year returns for the moderate non-withdrawal and withdrawal portfolios.
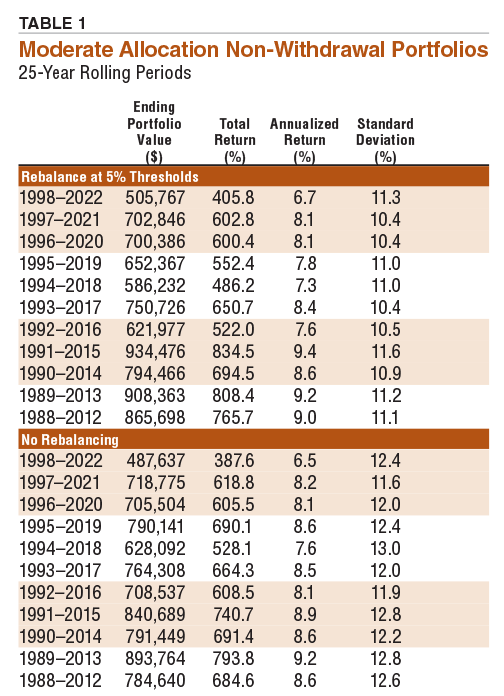
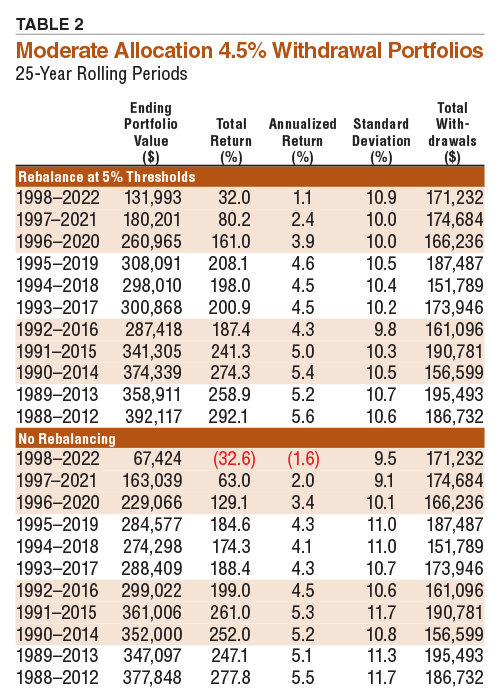
For the latest rolling period (1998–2022), the rebalanced portfolios had larger ending balances under both the non-withdrawal and the withdrawal strategies. There are different reasons for this.
The non-rebalanced, non-withdrawal portfolio ended 2021 with an 80.1% allocation to equities versus a 68.4% equity allocation for the rebalanced, non-withdrawal portfolio. This made the non-rebalanced portfolio more sensitive to a drop in equities prices in 2022. All four of the equity funds used fared worse than the bond fund in 2022. The reduced volatility of the rebalanced portfolio helped its return.
The big problem for the non-rebalanced withdrawal portfolio was the combination of withdrawals and early sequence risk. The timing of the dot-com bust coincided with rising withdrawal amounts. This drained dollars from those positions. The subsequent timing of the 2008 bear market compounded the problem and the portfolio never recovered. Its equity exposure at the end of 2022 was a mere 30.2%.
The rebalanced withdrawal portfolio did not experience this issue since the periodic rebalancing preserved the allocation. This portfolio was rebalanced nine times—including four out of the five years between 1999 and 2003.
The lesson for soon-to-be/new retirees is to have a plan in place to deal with sequence risk. Besides direct rebalancing, the withdrawal strategy could have been adjusted to avoid selling shares from positions incurring a large loss. The size of withdrawals could have been reduced too.
In terms of all rolling periods, rebalancing led to higher returns than not rebalancing during five of the 11 rolling periods for the non-withdrawal portfolios and reduced the level of volatility during all 11 rolling periods. On the withdrawal side, the rebalanced withdrawal portfolios realized higher returns during nine of the 11 rolling periods compared to their non-rebalanced counterparts. Volatility was lower during nine of the 11 rolling periods.
Rebalancing Reduced Volatility and Returns for the Aggressive Portfolios
Tables 3 and 4 show the 25-year rolling returns for the aggressive non-withdrawal and withdrawal portfolios.
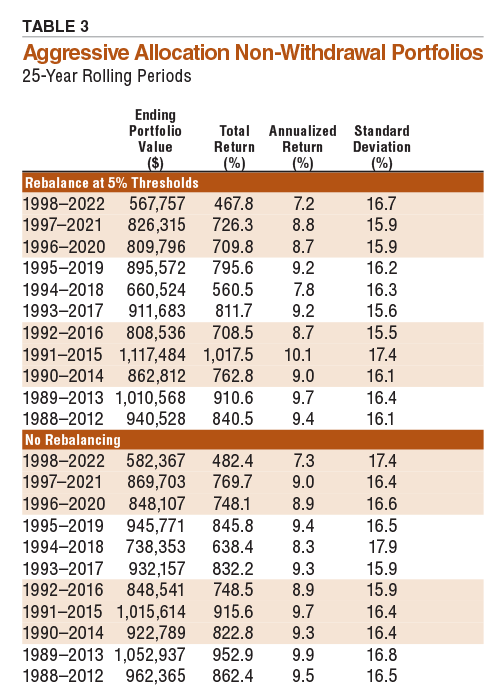
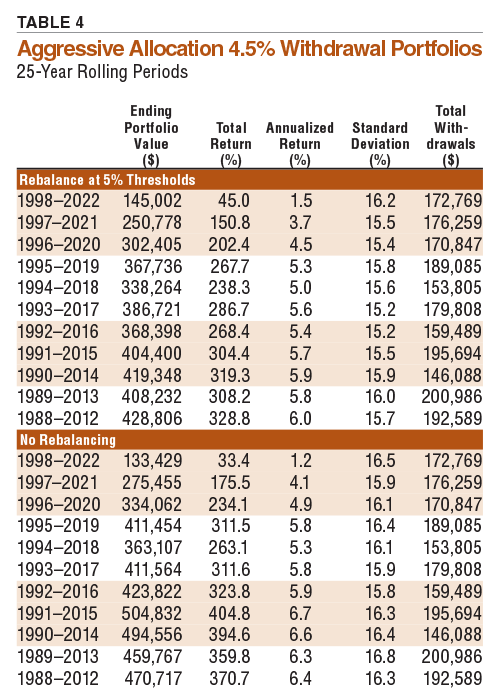
Rebalancing led to lower volatility than not rebalancing for the aggressive non-withdrawal portfolios during all 11 periods. This was because rebalancing preserved the bond allocation. The non-withdrawal rebalanced portfolio ended 2022 with an equity allocation of 91.8% for instance. Its non-rebalanced counterpart ended 2022 with a 95.6% allocation to equities.
Rebalancing only outperformed not rebalancing during the period of 1991–2015 for the non-withdrawal portfolios. By allowing the equity allocation to rise in the non-rebalanced portfolio, returns improved but volatility increased as the original allocation was abandoned.
Not rebalancing also led to both higher returns and higher volatility for the withdrawal portfolios compared to rebalancing. Withdrawals had an impact that went beyond what is shown in Table 4, however. As a reminder, 10% of the annual withdrawal amount was taken from the bond allocation, with the remainder evenly taken from the equity funds.
Consider the latest rolling period (1988–2022). Both the large-cap stock and bond fund positions were close to being completely drained at the end of 2022 in the non-rebalanced withdrawals portfolio. This is due to a function of the returns for both of these funds relative to those of the other three funds, the sequence in which those returns occurred and how withdrawals were being taken.
The Level3 withdrawal strategy, which allocates up to four years’ worth of withdrawals to defensive assets, could have been used as an alternative to the rebalancing strategy used for this article. Withdrawals would have come out of the defensive allocation (cash equivalents or short-term bonds) from 2000–2003 as well as at year-end 2008, 2018 and 2022. Withdrawals for all other years would have come from the equity allocation.
This strategy also requires some rebalancing. The defensive asset allocation (cash equivalents or short-term bonds) would have needed replenishment following those down years. However, this strategy would have allowed an investor to better navigate the sequence risk of the past 25 years than simply not rebalancing at all.
Where Rebalancing Has the Biggest Impact
As we have shown in past updates, rebalancing is most beneficial to investors who wish to maintain an allocation, find themselves unnerved by downside volatility in the markets and/or are taking withdrawals.
Rebalancing lessens the magnitude of swings in a portfolio’s returns and gives investors something positive to do during periods of market turbulence. The combination can make it easier to maintain a larger allocation to stocks over the long term.
In the withdrawal stage, rebalancing preserves the portfolio’s diversification over longer periods. A modified version of rebalancing can be undertaken by adjusting the withdrawals each year in a manner to maintain the allocation. This would be akin to annual rebalancing. However, depending on the size of the withdrawals, it may not be enough to fully preserve the allocation.

Related

Portfolio Strategies
Why You Should Consider Volatility When Building a Portfolio
Related

Portfolio Strategies
The Sequence in Which Returns Occur Affects Your Wealth
Discussion
FREE REPORT

Get your free copy of our special
report analyzing the tech stocks
most likely to outperform the
market.
RICHARD A from FL posted over 3 years ago:
GARY F from KY posted over 3 years ago:
CHARLES R from IL posted over 3 years ago:
BARRY J from TX posted over 3 years ago:
BARRY J from TX posted over 3 years ago:
ROBERT A from NC posted over 3 years ago:
ROBERT A from NC posted over 3 years ago:
JOHN L from NJ posted over 3 years ago:
ROBERT A from NC posted over 3 years ago:
J J from WI posted over 3 years ago:
CHARLES R from IL posted over 3 years ago:
J M from NJ posted over 3 years ago:
CHARLES R from IL posted over 3 years ago:
J M from NJ posted over 3 years ago:
CRAIG B from WI posted over 2 years ago:
You need to log in as a registered AAII user before commenting.
Log InCreate an account