


Related


Portfolio Strategies
Using Vanguard Funds and ETFs for Your Asset Allocation Needs

Portfolio Strategies
Developed country stocks saw their returns bounce back in a big way last year.

Charles Rotblut leads a class in AAII's new Essential Investing Video Course. Go to https://www.aaii.com/ves for more information and to subscribe.
International (developed country) stocks saw their returns bounce back in a big way last year. The asset class soared 35.2% in 2025, its largest return in at least 19 years. Emerging markets stocks also did well in 2025 with a 24.7% gain.
Economic growth was a contributing factor. Rising prices for gold and copper helped emerging markets countries. The declining U.S. dollar also played a role by inflating the value of foreign assets for U.S. investors.
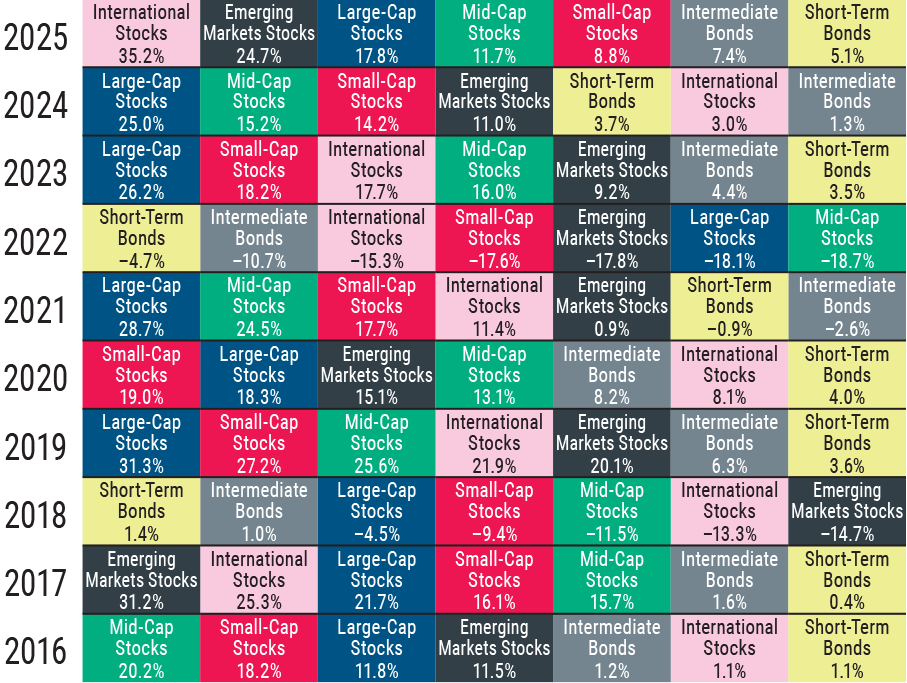
Annual returns for international and emerging markets stocks are displayed below in the pink and dark grey boxes, respectively, on the updated “heat map.” Their returns are based on the performance of Vanguard Developed Markets Index Admiral fund  (VTMGX) and Vanguard Emerging Markets Index Admiral fund (VEMAX), respectively. The heat map shows how the returns for the seven asset class groups that comprise the AAII Asset Allocation Models have compared over the past several years.
The figure below shows the annual returns for each of the asset class groups used in the AAII Asset Allocation Models. The asset class groups are sorted in descending order of return (left to right) for each calendar year. As you can see, the best-performing asset class frequently changed from year to year, demonstrating the benefits of diversification.
Prior to December 2020, the following mutual funds were used as proxies for calculating historical performance: Vanguard 500 Index Investor (VFINX), BNY Melon Mid Cap Index Investor (PESPX), Vanguard Small Cap Index Investor (NAESX), Schwab International Index (SWISX), Vanguard Emerging Markets Stock Index Investor (VEIEX), Vanguard Intermediate-Term Treasury Investor (VFITX) and Vanguard Short-Term Treasury Investor (VFISX).
As of December 2020, the following funds are used to calculate historical performance: Vanguard 500 Index Admiral (VFIAX), Vanguard Mid-Cap Index Fund Admiral (VIMAX), Vanguard Small Cap Index Admiral (VSMAX), Vanguard Developed Markets Index Fund Admiral (VTMGX), Vanguard Emerging Markets Stock Index Admiral (VEMAX), Vanguard Intermediate-Term Treasury Investor (VSIGX) and Vanguard Short-Term Treasury Admiral (VFISX).
Effective January 2025, Vanguard Short-Term Treasury Index Admiral (VSBSX) is being used for short-term bonds.
Source: Morningstar. Data as of 12/31/2025.
Each asset class group is ranked by its calendar-year performance in descending order from left to right. The groups are color coded so you can track their relative performance.
This is the first time international stocks have had the highest calendar return since 2012, when they rose 18.9%. Emerging markets stocks last had the highest return in 2017 (31.2% gain). Even with last year’s good performance, foreign stocks as a group remain undervalued relative to their domestic counterparts.
Small-cap U.S. stocks also remain undervalued relative to large-cap U.S. stocks. This is partially attributable to the growing concentration of technology-related stocks in the S&P 500 index. At the end of last year, the 10 largest stocks in the S&P 500 accounted for almost 41% of the index’s total market capitalization, according to J.P. Morgan Asset Management.
Take note of the year-by-year shifts in the best-performing categories. Six different asset class categories have led over the last 10 years. While large-cap stocks have done very well over the past 10 years, they mostly underperformed for several years prior to 2016.
Diversification increases the odds of being allocated to the right asset class at the right time.
Portfolio Strategies
Portfolio Strategies

ROBERT A from NC posted 8 months ago:
CHARLES R from IL posted 8 months ago:
ROBERT A from NC posted 8 months ago:
BARRY J from TX posted 7 months ago:
JOSEPH S from ISR posted 7 months ago:
JOSEPH S from ISR posted 7 months ago:
JOSEPH S from ISR posted 7 months ago:
JOSEPH S from ISR posted 7 months ago:
JOSEPH S from ISR posted 7 months ago:
JOSEPH S from ISR posted 7 months ago:
You need to log in as a registered AAII user before commenting.
Log InCreate an account