



Featured Tickers:
- Understand why AAII Asset Allocation Models use large-cap stocks as a core 20% portfolio component.
- Learn criteria for selecting low-cost, high-performing large-cap ETFs and mutual funds across blend, growth and value styles.
- Compare index and active fund options, expenses, risk measures and index construction to align choices with your objectives.
The AAII Asset Allocation Models provide sample allocations based on an investor’s time horizon and ability to withstand short-term market volatility. The models incorporate stocks, bonds and cash to build an allocation strategy. Allocations to diversified stocks decrease with investors’ time horizons and risk tolerance.
Previous articles on the AAII Asset Allocation Models have provided a broad overview of exchange-traded funds (ETFs) and mutual funds that could be used to meet both equity and fixed-income asset allocation needs. The rationale for casting a wide net was to provide options for those who face investment choice limitations or prefer a specific fund family.
Here, we take a closer look at the ETF and mutual fund options that can fill the large-cap domestic equity portion of a portfolio. Large-cap U.S. stocks are designed to provide long-term growth potential and are widely recognized for their liquidity, making them a core building block of well-diversified portfolios. A typical large-cap company has a market capitalization of about $10 billion or greater. Many of these companies also provide income through dividend payments.
We narrowed the list of large-cap funds to just those with strong AAII A+ Investor Grades for both expense and performance. Expense ratios are a big consideration because they directly determine how much of a fund’s gross return you get to keep. Both index and select actively managed funds are included to provide choices based on AAII member preferences.
How Large-Cap Funds Were Selected
We required mutual funds to be identified by Morningstar as true no-load funds and open to new investors. None were classified as adviser, institutional, other, retirement or S class shares.
Additionally, all funds have a minimum purchase requirement of $5,000 or less. They must be able to be purchased by individual investors directly through a brokerage account. Funds were required to have assets greater than $500 million.
Expense ratios were required to be lower than the category average. ETFs and mutual funds with fees greater than 0.70% were not included. Consequently, most have A+ Grades of A or B for their expense ratios.
Returns for one-year, three-year and five-year periods were required to rank in the range of 40% to 100% within their category. Most return grades are A or B. We only considered funds with at least a five-year history.
Large-cap equity categories for the funds include large blend, large growth and large value. The growth and value funds are options for those investors who wish to tilt their portfolios toward either style.
Large-Cap ETFs
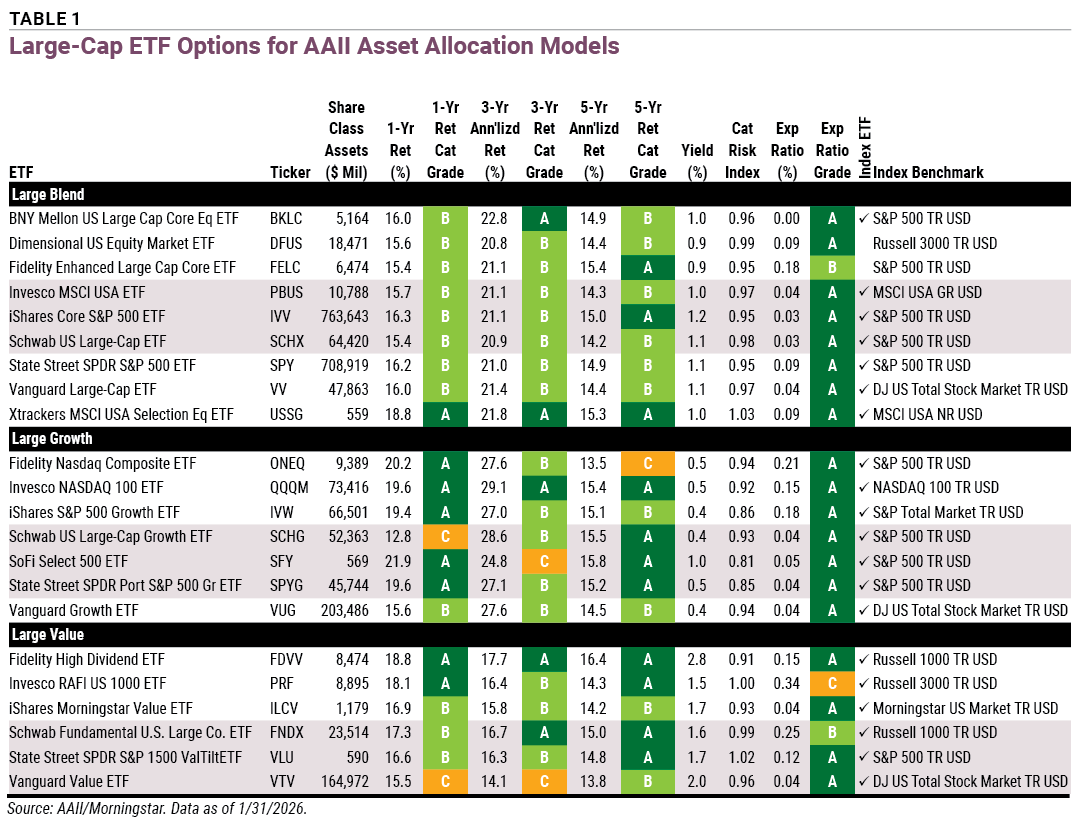
Table 1 shows ETFs that could be used for large-cap stock allocation.
Download the Excel spreadsheet for Table 1.
Most of these ETFs are passively managed, with a median expense ratio of 0.07%, compared to 0.23% for the mutual funds.
Large Blend ETFs
The nine large blend ETFs provide different strategies and below-average expense ratios. Despite having the smallest asset base of the large blend ETFs, Xtrackers MSCI USA Selection Equity ETF  (USSG) delivered the strongest overall performance across the one-, three- and five-year periods. This ETF tracks the MSCI USA Selection index, which screens the U.S. equity universe and selects a subset of stocks based on defined quality, valuation and profitability criteria.
BNY Mellon US Large Cap Core Equity ETF (BKLC) has an expense ratio of 0.00%. The zero cost is part of BNY Mellon’s pricing strategy for this ETF. The fund is offered “without fee waivers or other restrictions,” making it a genuinely fee-free product rather than one with a waiver that could expire later.
Familiar and popular ETFs such as iShares Core S&P 500 ETF (IVV), Schwab US Large-Cap ETF (SCHX), State Street SPDR S&P 500 ETF Trust (SPY) and Vanguard Large-Cap ETF (VV) offer above-average performance and below-average expense ratios. The first three track the S&P 500 index, while Vanguard Large-Cap tracks the CRSP US Large Cap index. [Vanguard S&P 500 ETF (VOO) is also an option for investors seeking an S&P 500–tracking ETF.]
Fidelity Enhanced Large Cap Core ETF (FELC) uses active management to seek capital appreciation. Its 0.18% expense ratio is the highest among the large blend ETFs in Table 1, but it is far below the large blend category average of 0.43%.
Large Growth ETFs
Invesco NASDAQ 100 ETF (QQQM) is included among the large growth ETFs because of its exceptional performance and comparatively low expense ratio of 0.15%. This ETF is the younger sibling of Invesco QQQ Trust (QQQ) and was launched in 2020 to provide an open-end ETF structure that offered a lower expense ratio with the same exposure to the Nasdaq-100 index. Invesco QQQ Trust recently converted to an open-end ETF structure but has a slightly higher expense ratio.
Fidelity Nasdaq Composite ETF (ONEQ) has 1,033 securities in its portfolio but is not diversified. Its top 10 holdings constitute 60.6% of its assets. Mega-cap companies heavily influence portfolio weights.
Schwab U.S. Large-Cap Growth ETF (SCHG) tracks the Dow Jones U.S. Large-Cap Growth Total Stock Market index. This index uses six factors, including past and projected future growth, to classify stocks as growth or value. State Street SPDR Portfolio S&P 500 Growth ETF (SPYG) and Vanguard Growth ETF (VUG) track the more traditional S&P 500 Growth and CRSP US Large Cap Growth indexes, respectively.
Large Value ETFs
ETF choices for a large value allocation include Fidelity High Dividend ETF (FDVV). This ETF emphasizes stocks that offer higher dividend payouts relative to its peers, making it well-suited for investors seeking income. Its below-average category risk index of 0.91 is the lowest among the large value ETFs shown. Not surprisingly, it also has the highest yield of all the ETFs and mutual funds shown. Note that Fidelity High Dividend allocates 5.4% of its assets to foreign stocks.
Invesco RAFI US 1000 ETF (PRF) is passively managed but selects holdings based on four fundamental measures of firm size: book value, cash flow, sales and dividends. The 1,000 equities with the highest fundamental strength are weighted by their fundamental scores. Invesco RAFI US 1000’s expense ratio of 0.34% is the highest of all the large-cap ETFs shown.
iShares Morningstar Value ETF (ILCV) and Vanguard Value ETF (VTV) both offer the lowest expense ratios, 0.04%, for the large value ETFs.
Large value ETFs exhibit slightly lower category risk compared to large value mutual funds, which may result from the index-based structure of the ETFs compared to the active management typical of mutual funds.
Large-Cap Mutual Funds
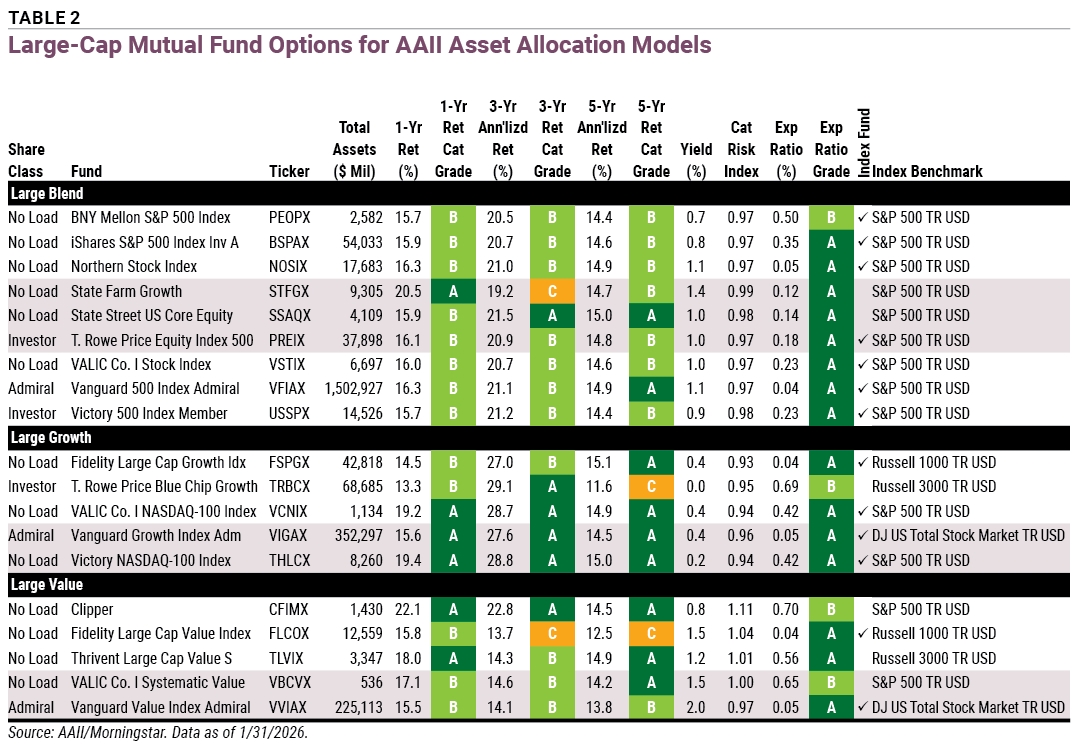
Table 2 presents the large-cap mutual funds that could be used for the domestic large-cap stock allocation in the AAII Asset Allocation Models.
Download the Excel spreadsheet for Table 2.
Large Blend Mutual Funds
Of the nine mutual funds in the large blend category, Vanguard 500 Index Admiral fund (VFIAX) is the largest, with assets under management (AUM) of $1.5 trillion. It is followed in size by iShares S&P 500 Index Investor A fund (BSPAX), then by T. Rowe Price Equity Index 500 fund (PREIX).
Vanguard 500 Index Admiral is a classic large blend index mutual fund and is used as one of the proxies for calculating historical performance for the AAII Asset Allocation Models. It has the lowest expense ratio (0.04%) among the large blend mutual funds. While iShares S&P 500 Index Investor A provides the same index exposure, its investor A share class has an expense ratio of 0.35%. T. Rowe Price Equity Index 500’s expense ratio is in between these two at 0.18%.
Actively managed choices include State Farm Growth fund (STFGX) and State Street US Core Equity fund (SSAQX). The expense ratios for these two funds are among the lowest in our list of large blend mutual funds and are far below the large blend category average of 0.81%.
State Street US Core Equity has the best A+ Grades of all the large blend mutual funds in Table 2 for its three- and five-year returns. Launched in January 1980, this is one of State Street’s oldest mutual funds.
Approximately 38% of these large blend mutual funds’ total portfolios is invested in their top 10 holdings, reflecting the S&P 500’s current concentration.
Large Growth Mutual Funds
Five mutual fund choices exist in the large growth category. Their benchmarks and strategies are broader than those that track the S&P 500.
Fidelity Large Cap Growth Index fund (FSPGX) tracks the Russell 1000 index. This index represents the largest 1,000 U.S. companies by market cap.
The Russell 3000 index is even broader, containing the largest 3,000 U.S. companies. Actively managed T. Rowe Price Blue Chip Growth fund (TRBCX) uses the Russell 3000 as its benchmark, but that doesn’t mean it holds all 3,000 stocks in the index. This is a very concentrated mutual fund with only 64 securities in its portfolio. The top 10 holdings constitute 66.6% of the fund’s assets. Foreign stocks currently comprise 4.3% of its total assets. Fewer holdings allows the managers to focus on their best ideas. T. Rowe Price Blue Chip Growth’s 0.69% expense ratio is the highest among the large growth mutual funds shown, but it is well below the large growth category average of 0.96%.
VALIC Company I NASDAQ-100 Index fund (VCNIX), Vanguard Growth Index Admiral fund (VIGAX) and Victory NASDAQ-100 Index fund (THLCX) have performed the best over the one-, three- and five-year periods, earning A+ Grades of A. Vanguard Growth Index Admiral has the lowest expense ratio of the three and tracks the Dow Jones U.S. Total Stock Market index. The index is designed to represent the performance of the entire U.S. equity market, capturing nearly all publicly traded U.S. companies, regardless of market cap.
The category risk index values included in Table 2 relate the volatility of a fund to the average volatility for funds in the same investment category. Values of 1.00 suggest average risk. Values below 1.00 indicate lower risk, and those above 1.00 signal higher risk.
Large Value Mutual Funds
Clipper fund (CFIMX) is a standout among large value mutual funds, with A+ Grades of A for its one-, three- and five-year returns. The fund is actively managed and has the highest expense ratio (0.70%) among the all the mutual funds in Table 2, though it charges significantly less than the average mutual fund in the large value category (0.93%).
Thrivent Large Cap Value S fund (TLVIX) and VALIC Company I Systematic Value fund (VBCVX) are actively managed and have expense ratios that reflect the hands-on approach. Fidelity Large Cap Value Index fund (FLCOX) has the lowest expense ratio in the category at 0.04%, but it also has above-average one-year performance and average three- and five-year performance due to tracking the Russell 1000 Value index. Vanguard Value Index Admiral fund (VVIAX), which tracks the CRSP US Large Cap Value index, has above-average returns over all periods shown, a below-average expense ratio and the highest yield among all the large-cap mutual funds shown.
Three of the large value mutual funds included in Table 2 have category risk index values that are modestly above 1.00. Such risk indexes are assigned when a fund’s returns have been more volatile than those of their category peers over the past three years. VALIC Company I Systematic Value’s category risk index of 1.00 implies a level of risk equivalent to the average large value mutual fund.
Determining Your Large-Cap Allocation
AAII Asset Allocation Models suggest a 20% allocation of large-cap stocks for aggressive, moderate and conservative investors.
Suggested Allocation Breakdowns
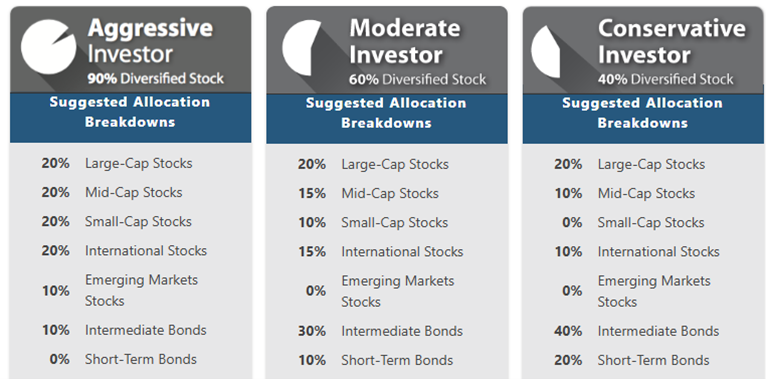
Since this allocation is constant across risk tolerances, investors could create suballocations to match their risk profile. By selecting ETFs and mutual funds with differing category risk and yield, exposure to higher-yielding funds could be increased as you become less risk tolerant and shift from maximizing growth to preserving capital.
Large value options carry above-average category risk with higher yields. But it is important to understand that these category risks are only slightly above average and not far out of line with those of the large blend and large growth categories.
Doing Your Research
AAII members have access to portfolio and performance data through the ETF and Mutual Fund Evaluators. You can use the Evaluator as a starting place to learn more about a fund’s characteristics. To access a fund’s Evaluator page, type its name or ticker symbol into the search box at the top of any AAII.com page, and then choose the fund from the drop-down list. Those interested in learning more about asset allocation and the AAII Asset Allocation Models can visit the Asset Allocation home page.
When considering any index fund, pay attention to how it actually tracks the index named. Two funds with similar names can show differences in their returns. Most of the indexes mentioned here are market-cap weighted. This means that the largest companies in the index will have the greatest influence on returns and the smallest companies will have the least impact. Understanding the index construction and methodology will help ensure that you make informed decisions and select funds that align with your objectives.
Also, consider how much you want to specifically target each component of an asset allocation model versus your desire to hold fewer funds.

Related

Related

Portfolio Strategies
Tilting AAII's Asset Allocation Models to Match Your Growth or Value Style
Discussion
FREE REPORT

Get your free copy of our special
report analyzing the tech stocks
most likely to outperform the
market.
BARRY J from TX posted 7 months ago:
BARRY J from TX posted 7 months ago:
Cynthia M from IL posted 7 months ago:
You need to log in as a registered AAII user before commenting.
Log InCreate an account