



- Long-term data shows that mid- and small-cap U.S. stocks outperform large caps over 25 years despite recent large-cap dominance
- Equal allocations to large-, mid- and small-cap funds improved returns, reduced volatility and strengthened retirement portfolio outcomes
- Broad diversification across multiple asset classes can create a more resilient, balanced investment portfolio
Over the past 25 years (2001–2025), mid-cap and small-cap U.S. stocks have outperformed large-cap U.S. stocks.
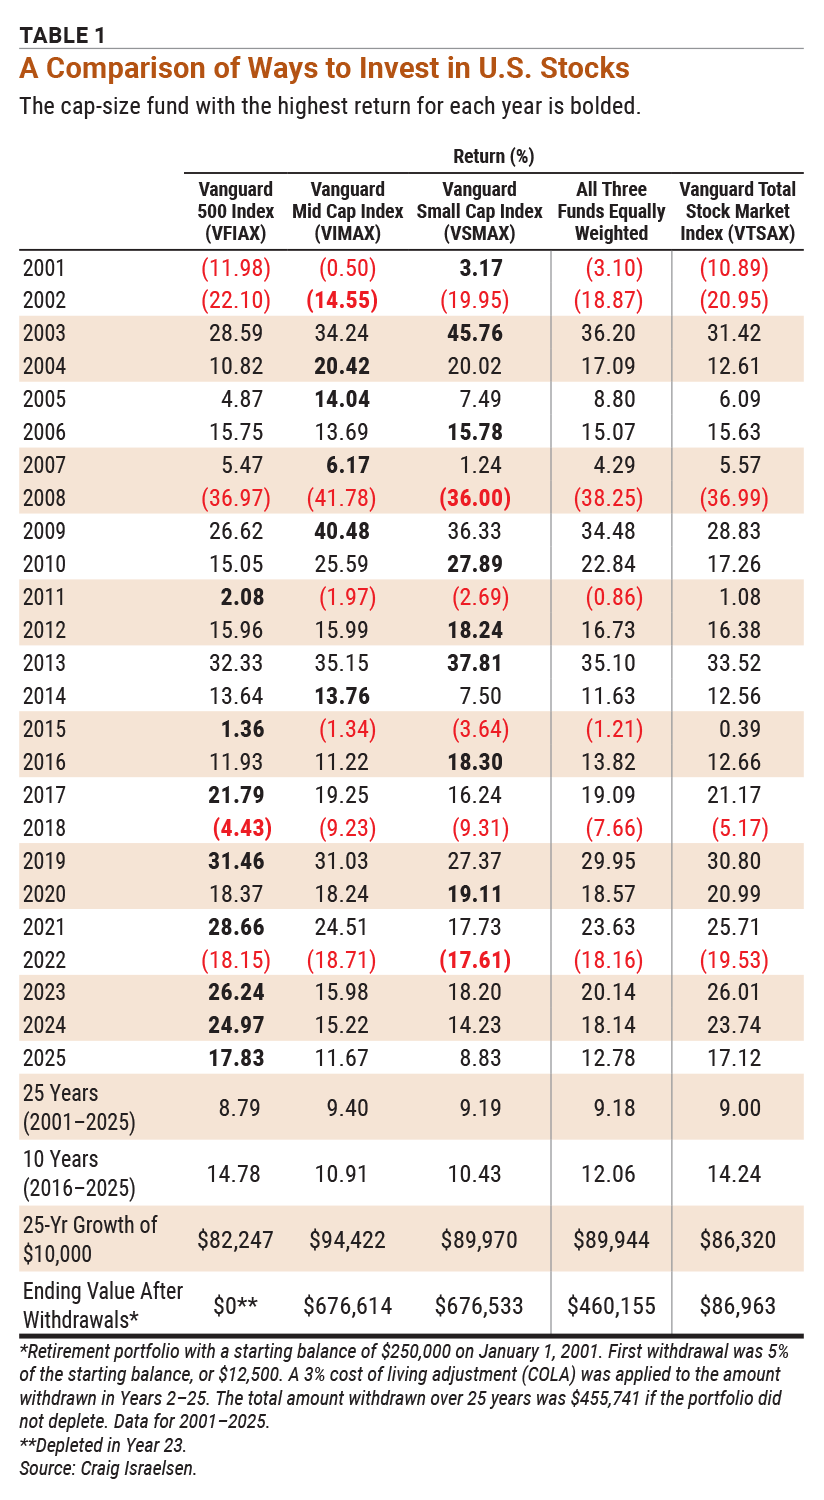
This may be surprising to some because of the popularity of the S&P 500 index, which comprises 500 large U.S. stocks. During the past 10 years (2016–2025), large-cap U.S. stocks outperformed mid- and small-cap U.S. stocks by a considerable margin (Table 1).
In the analysis presented here, large-cap U.S. stocks are represented by Vanguard 500 Index Admiral fund  (VFIAX), mid-cap U.S. stocks are represented by Vanguard Mid Cap Index Admiral fund (VIMAX) and small-cap U.S. stocks are represented by Vanguard Small Cap Index Admiral fund (VSMAX).
Investors may ask whether asset allocations should be based on longer-term results or more recent performance. I suggest that a longer time frame—in this case, the past 25 years of performance—should be our guide.
Performance over the past 25 years suggests that we should allocate more heavily to mid- and small-cap U.S. stocks, whereas performance over the more recent 10+ years favors large-cap U.S. stocks. What is the right approach? Or should we simply invest in all three market-capitalization vectors of the U.S. stock market? The answer is “yes” to investing in all three market-cap vectors.
Allocations should not be limited to trivial percentages for mid- and small-cap stocks. To produce material results, we need material allocations.
Comparing to a Total Market Fund
Some may ask: Why not use a total stock market index fund, such as Vanguard Total Stock Market Index Admiral fund (VTSAX), instead? Wouldn’t that be a more convenient way to gain exposure to large-, mid- and small-cap U.S. stocks? It is indeed convenient, but it’s suboptimal. Let me show you why.
As you can see in Table 1, Vanguard Total Stock Market Index Admiral had a 25-year average annualized return of 9.00%, which was only slightly better than Vanguard 500 Index Admiral’s 8.79% return over the same period. The asset allocation of Vanguard Total Stock Market Index Admiral is roughly 70% large-cap U.S. stocks, 20% mid-cap U.S. stocks and 10% small-cap U.S. stock. The growth of $10,000 over 25 years was comparable between the two funds. However, the ending value of a retirement portfolio with withdrawals consisting only of Vanguard Total Stock Market Index Admiral was $86,963, versus total depletion in Year 23 for a portfolio consisting only of Vanguard 500 Index Admiral. This is strong evidence that spreading out the allocation to mid- and small-cap stocks is helpful—particularly for retirees.
But now consider the performance of an equally weighted portfolio of Vanguard 500 Index Admiral, Vanguard Mid Cap Index Admiral and Vanguard Small Cap Index Admiral. It had a 25-year average annualized return of 9.18%, which was 18 basis points (bps) higher than Vanguard Total Stock Market Index Admiral. As a bonus, the equal-weight portfolio had 15% lower standard deviation, meaning it incurred less variance in its returns. The growth of $10,000 over 25 years in the equal-weight portfolio was more than $3,000 higher than Vanguard Total Stock Market Index Admiral.
The Equal-Weight Portfolio in Retirement
The retirement portfolio scenario where money is being withdrawn each year is where the equal-weight portfolio truly shone. Starting with a balance of $250,000 on January 1, 2001, this portfolio had an ending balance on December 31, 2025, of $460,155. The ending balance for the same amount invested in Vanguard Total Stock Market Index Admiral was $86,963. Put another way, the equal-weight approach outperformed the total stock market index fund approach by more than $373,000.
Here is the amazing part: The total amount of money withdrawn over the 25-year period was $455,741! The equal-weight portfolio had an ending balance that was greater than the amount withdrawn. In the domestic equity portion of a retirement portfolio, the allocations to mid- and small-cap U.S. stocks should be comparable to the allocation in large-cap U.S. stocks. Very simply, meaningful exposure to mid- and small-cap U.S. stocks is crucial.
Though convenient, a total stock market index—in this example, Vanguard Total Stock Market Index Admiral—fails to achieve meaningful exposure to mid- and small-cap U.S. stocks. The results over the past quarter century reveal the price of that convenience.
This analysis used Vanguard mutual funds to calculate the performance of the various U.S. equity investing approaches. Fidelity funds could have been used as well. For example, Fidelity Total Market Index fund (FSKAX) is analogous to Vanguard Total Stock Market Index Admiral and Fidelity 500 Index fund (FXAIX) is comparable to Vanguard 500 Index Admiral. Additionally, Fidelity Mid Cap Index fund (FSMDX) is comparable to Vanguard Mid Cap Index Admiral, and Fidelity Small Cap Index fund (FSSNX) is very similar to Vanguard Small Cap Index Admiral.
U.S. Stocks in the Context of an Overall Portfolio
The evidence presented thus far suggests that mid- and small-cap U.S. stocks deserve as much attention as large-cap U.S. stocks in the overall asset allocation of an investment portfolio. But what else should be included in a diversified investment portfolio? Figure 1 presents a 12-asset portfolio model of mutual funds or exchange-traded funds (ETFs) that covers many of the important asset classes.
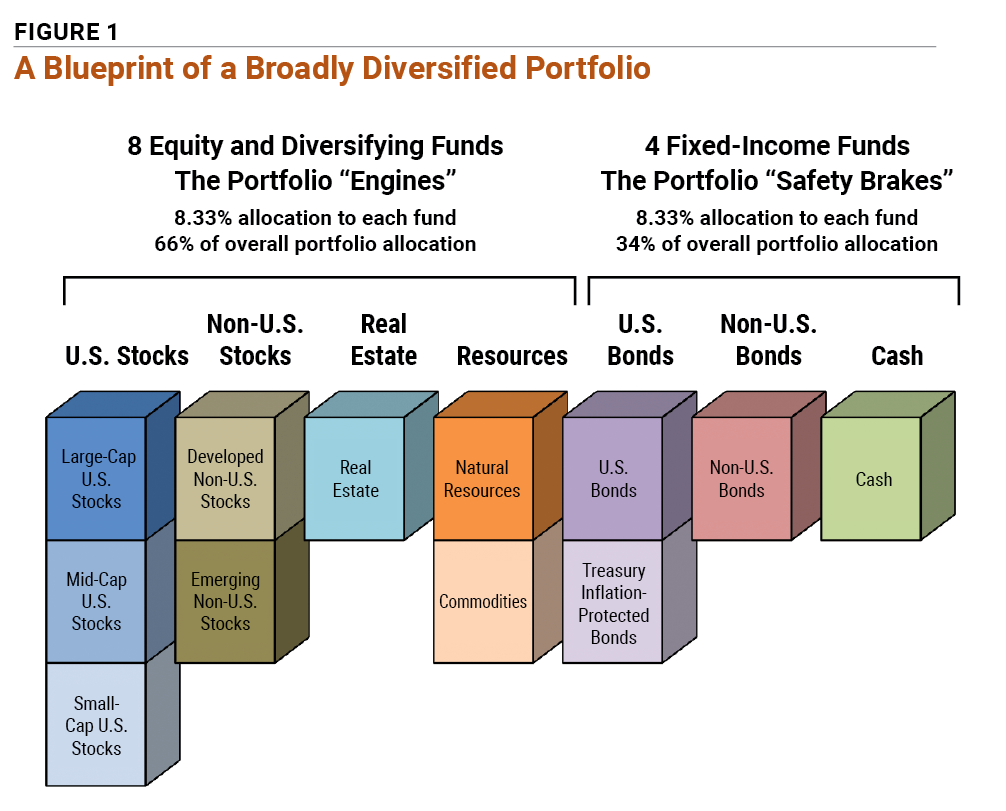
In this 12-asset portfolio, there are seven broad asset classes, or “silos”: U.S. stocks, non-U.S. stocks, real estate, resources, U.S. bonds, non-U.S. bonds and cash. The U.S. stocks silo is built with three separate funds: one large cap, one mid-cap and one small cap. The non-U.S. stocks silo has two positions: developed non-U.S. stocks and emerging non-U.S. stocks.
Real estate is a single-fund silo where one mutual fund or ETF suffices. Resources is a silo that requires two funds, one focusing on natural resources stocks and another targeting commodities. The U.S. bonds silo also requires two funds, one focusing on U.S. bonds and the other on Treasury inflation-protected securities (TIPS). The non-U.S. bond silo utilizes one fund, as does the cash silo.
Overall, 12 mutual funds or ETFs are employed. The allocation to each of the 12 funds is up to the individual investor, but a reasonable starting point would be to equally weight all 12 funds. By doing so, the overall asset allocation of this model is 66% “growth engine” components (from large U.S. stocks to commodities) and 34% “brakes” (from U.S. bonds to cash).
Using Vanguard mutual funds and ETFs, the 12-asset model produced an average annualized return of 6.90% over the past 25 years. In 2025, the return was 18.92%. If using Fidelity funds, the 25-year return as of December 31, 2025, was 7.38% and the 2025 return was 14.23%.
Comparing this type of investment model to the S&P 500 is not meaningful, as this model represents a holistic, broadly diversified investment portfolio while the S&P 500 is a single asset class with no broad asset class diversification.
Takeaways
The data shows three things investors should consider doing with their portfolios. First, diversify equitably across large-, mid- and small-cap U.S. stocks. Second, diversify even further by holding funds that offer exposure to a wide range of asset classes, or silos. Finally, give the portfolio time to do its job.
Equal Weighting Across Market-Cap Sizes Beats a Total Market Fund Video
We think you’d like this related webinar! How to Test Retirement Decisions Before You Make Them

Related

Portfolio Strategies
Tempering the Risks of Market-Cap Weighting
Related

Portfolio Strategies
The Relationship Between Stock Market Volatility and Returns
Discussion
FREE REPORT

Get your free copy of our special
report analyzing the tech stocks
most likely to outperform the
market.
ANURAG M from CA posted 6 months ago:
JOHN L from NJ posted 6 months ago:
Mahlon M from WA posted 6 months ago:
ROBERT A from NC posted 6 months ago:
K W from CA posted 6 months ago:
BARRY J from TX posted 6 months ago:
BOHDAN C from PA posted 6 months ago:
DAVID H from IL posted 6 months ago:
MICHAEL S from CA posted 6 months ago:
ROBERT A from NC posted 6 months ago:
Craig I from UT posted 5 months ago:
DAVID L from UT posted 5 months ago:
RICHARD B from FL posted 5 months ago:
JOHN P from CO posted 5 months ago:
RICHARD H from PA posted 2 months ago:
You need to log in as a registered AAII user before commenting.
Log InCreate an account