


- Sequence of returns risk is not unavoidable; preparation possible for retirement transitions
- Analysis of different portfolio allocations shows varying degrees of risk over 25-year periods
- Equity-heavy portfolios show lower sequence of returns risk; conservative portfolios are more susceptible
Is sequence of returns risk a reality we are defenseless against? More bluntly, sequence of returns risk is thought of as an accident waiting to happen with little we can do to avoid it. I present evidence that we can, in fact, do something to prepare for sequence of returns risk as we transition into our retirement years.
The general idea behind sequence of returns risk is that when we start pulling money out of a retirement portfolio, we are naturally more sensitive to the performance of the portfolio each year. In other words, making our withdrawal at the end of a bad year (or a bad sequence of years) will magnify the pain already inflicted on our portfolio by poor returns.
Consider an example scenario. A person retires at the start of the year 2000 and has a 60% equity/40% bond retirement portfolio. The year 2000 was the start of the “tech wreck” and led a 60%/40% portfolio to incur a 0.68% loss. In 2001, things got worse with the portfolio losing 1.89%. The year 2002 was even worse with a loss of 10.20%.
This retiree must make annual withdrawals based on their need for income and/or their required minimum distribution (RMD). In the early 2000s, they were faced with the distasteful task of withdrawing money from a portfolio that has been beaten up by bad market returns. This is an example of a bad sequence of returns for a new retiree (or any retiree). Withdrawals from their retirement portfolio only exacerbate the negative returns experienced by their portfolio. Very simply, this is sequence of returns risk.
An understandable “reaction” to the possibility of being adversely affected by sequence of returns risk would be to build a more conservative retirement portfolio. Entirely logical, but likely the wrong choice for reasons that are only indirectly related to the sequence of returns experienced by a retirement portfolio.
Sequence of Returns Risk Across Four Different Portfolios
In Figures 1, 2 and 3, you can see the correlation between the sequence of returns of a retirement portfolio in five different five-year periods with the eventual ending value of the portfolio after 25 years of withdrawals (i.e., after five of the five-year increments). We are measuring which five-year period’s returns had the most impact on the eventual ending value of the portfolio after 25 years of withdrawals. The higher the five-year correlation between the five-year returns and the portfolio’s eventual ending value, the higher the sequence of returns risk.
This analysis examined all of the 74 rolling 25-year periods from 1926–2023 using index-based annual returns for large U.S. stock, small U.S. stock, U.S. bonds and cash. Fifty basis points (bps) were subtracted from the annual returns of each index to simulate the actual costs of a retirement portfolio composed of actual mutual funds and/or exchange-traded funds (ETFs).
Four different retirement portfolio asset allocations were tested: a very conservative model with a 20% equity/80% fixed-income allocation, a conservative 40% equity/60% fixed-income model, a moderate 60% equity/40% fixed-income model and an aggressive 80% equity/20% fixed-income model. The composition of those portfolios was:
- 20%/80% 15% large U.S. stock, 5% small U.S. stock, 60% bonds and 20% cash
- 40%/60% 30% large U.S. stock, 10% small U.S. stock, 45% bonds and 15% cash
- 60%/40% 40% large U.S. stock, 20% small U.S. stock, 30% bonds and 10% cash
- 80%/20% 55% large U.S. stock, 25% small U.S. stock, 15% bonds and 5% cash
The equity allocations are composed of large U.S. stocks, represented by the S&P 500 index, and small U.S. stocks, represented by the Ibbotson Small Companies index from 1926–1978 and the Russell 2000 index from 1979–2023. The bond allocation is represented by the SBBI U.S. Intermediate Government Bonds index from 1926–1975 and the Bloomberg Aggregate Bond index from 1976–2023. Cash is represented by three-month Treasury bills from 1926–2023.
The portfolios were rebalanced annually.
The 25 annual withdrawals (made at year-end) shown in Figure 1 were determined by the mandated RMD percentage withdrawal starting at age 73 through age 98.

Correlations Inversely Related to Smallest and Largest Equity Allocation
The very conservative 20%/80% model asset allocation model had the highest correlation in each five-year period relative to the ending portfolio value after 25 years (as noted by the dark blue bars). In other words, the 20%/80% retirement portfolio presented the highest sequence of returns risk in each five-year period. The specific five-year period that exposed the portfolio to the highest sequence of returns risk was the third one (years 11 through 15).
Note that the correlation findings for a retirement portfolio experiencing RMD-based withdrawals were virtually identical to a retirement portfolio sustaining withdrawals of 4% of the portfolio’s ending value each year (as shown in Figure 2).
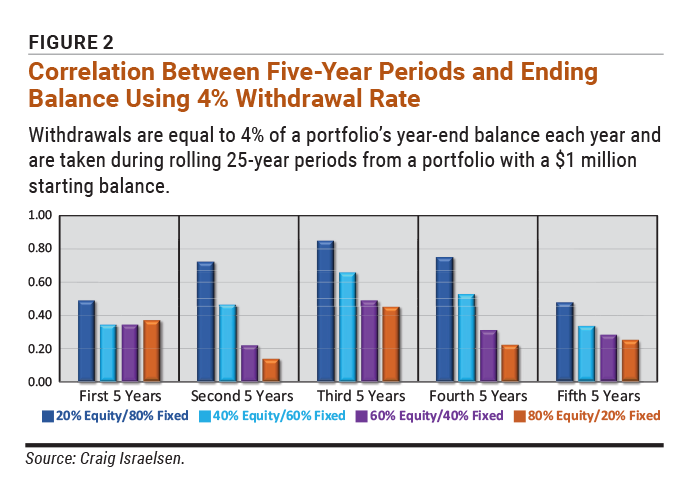
In Figures 1 and 2 (RMD-based annual withdrawals and 4% annual withdrawals, respectively), the retirement model with the smallest overall exposure to sequence of returns risk was the 80% stock/20% bond portfolio. The only slight exception was the first five-year period where the 40%/60% and 60%/40% asset allocations had fractionally lower correlations compared to the 80%/20% model.
The Withdrawal Amount Makes a Difference
The results get more interesting when we change how money is being withdrawn from a retirement portfolio. In Figure 3, the first-year withdrawal was set at $40,000 (4% of the initial portfolio value). Then in years 2 through 25, the annual withdrawal was inflated by the actual consumer price index (CPI) rate of inflation in each rolling 25-year period.
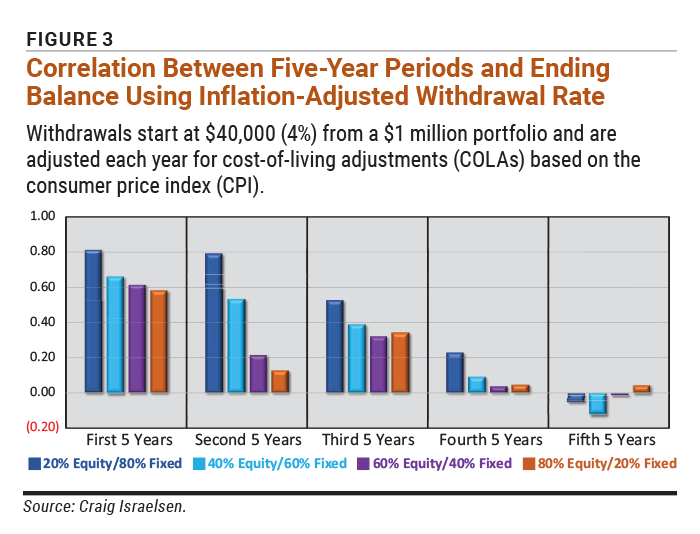
When the dollar amounts withdrawn are raised to keep pace with inflation, the exposure to sequence of returns risk is highest during the first five-year period. In Figures 1 and 2, the performance of a 20%/80% portfolio during the first five years had a correlation of roughly 50% to the ending value of the portfolio after 25 years. As shown in Figure 3, the correlation of the 20%/80% portfolio’s first five-year returns to the ending value of the portfolio after 25 years increases to 81%. In fact, the high sequence of returns risk correlations for a 20%/80% and a 40%/60% portfolio extend into the second five-year period as well.
The 60%/40% (purple bars) and 80%/20% (copper bars) portfolios show very low sequence of returns risk during the second five-year period in Figures 1, 2 and 3. In the last two five-year periods (years 16 to 20 and years 21 to 25), the correlation between sequence of returns and ending portfolio value after 25 years is negligible when money is being withdrawn based on the CPI cost-of-living adjustment (COLA). Apparently, the correlation die is cast in the first half of the 25-year period under such a withdrawal method.
It should be noted that three of the four retirement portfolios survived intact throughout each of the 74 rolling 25-year periods being analyzed. Put another way, those portfolios did not run out of money.
The exception was the 20% equity/80% fixed-income model. In four of the rolling 25-year periods, portfolios using this allocation ran out of money before 25 years when withdrawals were based on an annual COLA. Thus, the 20%/80% model had a 94.6% success rate (where “success” means the portfolio never ran out of money).
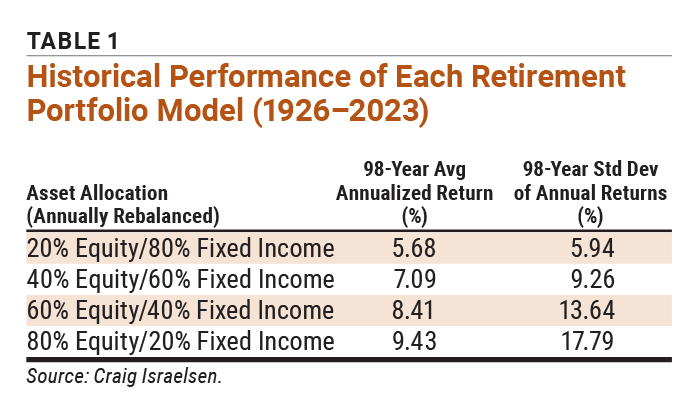
To this point, we have been focused on the sequence of returns for four retirement models and the associated impact on the retirement portfolio’s ending value after 25 years of withdrawals. Perhaps contrary to intuition, the conservative 20% equity/80% fixed-income portfolio was the most susceptible to sequence of returns risk regardless of how money was being withdrawn (based on RMD, 4% fixed withdrawal percentage or COLA) despite having the lowest standard deviation of return (see Table 1). Standard deviation is often used as a technical measure of volatility (or risk).
Size of Returns Risk
Volatility is not the only driver of sequence of returns risk. There is another version: namely, size of returns risk. Size of returns risk is the risk of returns not being large enough to support the desired withdrawal strategy. A retirement portfolio is exposed to both sequence of returns risk and size of returns risk. These two versions of risk both matter and impact the ability of a retirement portfolio to survive 25 years or longer.
As we examine Figures 1, 2 and 3, the retirement portfolio asset allocation “sweet spot” appears to be a 60% equity/40% fixed-income model. A 60%/40% allocation is the classic “balanced” portfolio.
The virtue of a 60%/40% retirement portfolio allocation (maintained through annual rebalancing) is clearly illustrated in the second five-year period of Figure 2 (withdrawal years 6 through 10). The correlation of annual returns between that particular five-year period with the ending balance after 25 years is 22%. This is a very low correlation compared to the very high correlations exhibited by the 20%/80% and 40%/60% models during the same five-year period.
Lessons About Allocation and Retirement Withdrawals
Is there a lesson to be learned here? I suggest that the primary lesson is hunkering down in a very “low-risk” retirement portfolio (meaning 20% or less exposure to equities) exposes a retiree to size of returns risk while attempting to avoid sequence of returns risk. Size of returns risk often masquerades as sequence of returns risk.
A secondary lesson is that a withdrawal method that attempts to keep pace with inflation is a particularly demanding withdrawal strategy. The size of returns in a 20%/80% retirement portfolio (and to a lesser extent a 40%/60% portfolio) will likely not be high enough to sustain the demanding withdrawal schedule while counteracting the natural performance variability that sequence of returns risk is generally blamed for.
There is one more issue to consider. Table 2 highlights the average annualized five-year return of each retirement model during the first five-year period of all 74 rolling 25-year withdrawal periods. Also shown is the historical frequency of experiencing negative annualized returns during each first five-year period.
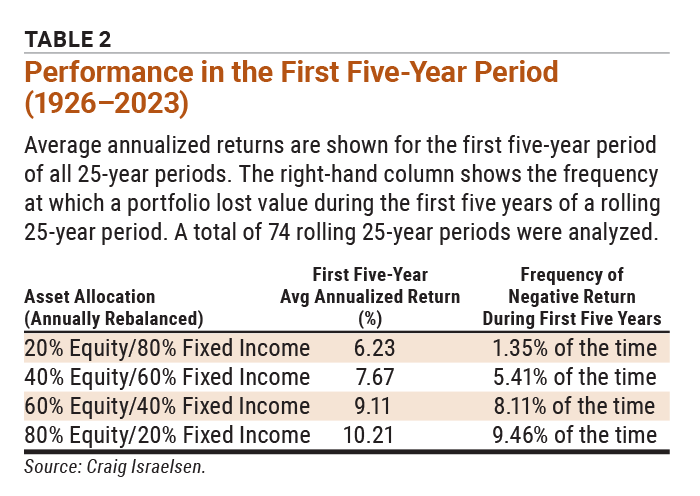
The likely rationale for a new retiree to build a conservative retirement portfolio (such as the 20% equity/80% fixed-income model) is that it will be less susceptible to sequence of returns risk. Put another way, a conservative portfolio is less likely to experience a negative five-year annualized return in the first five years of retirement.
That is indeed true. Since 1926, a 20%/80% portfolio experienced a negative five-year annualized nominal return (which does not account for inflation) a mere 1.35% of the time during the first five years of withdrawals. This compares to 9.46% of the time for an 80%/20% portfolio. In reality, both percentages are encouragingly low. However, the problem in attempting to avoid sequence of returns risk is that an investor increases their size of returns risk.
This is evidenced by the average first five-year returns shown in Table 2. The 20%/80% had an annualized five-year return of 6.23% compared to 10.21% for an 80%/20% portfolio.
For those who insist on building a conservative retirement portfolio, a percentage-based withdrawal method (such as the RMD or a 4% withdrawal rate) appears to modestly insulate a conservative retirement portfolio (20%/80% and 40%/60%) from both sequence and size of returns risk during the first five years of retirement. We observe this in Figures 1 and 2 by noting that the dark blue bars (20%/80% portfolio) and the bright blue bars (40%/60% portfolio) have materially lower correlation with the ending portfolio balance in year 25 in the first five-year withdrawal period compared to the second, third and fourth five-year periods.
Interestingly, the performance of 60%/40% and 80%/20% retirement portfolios have a higher correlation with the ending balance in year 25 during the first five-year withdrawal period than in the second five-year period when money is being withdrawn based on a percentage of the portfolio’s value (see Figures 1 and 2). However, in both five-year periods, the correlations are quite low. This suggests that 60%/40% and 80%/20% portfolios are naturally resistant to both forms of return risk during the first 10 years of annual withdrawals.
For percentage-based withdrawals (Figures 1 and 2), the highest correlations between the sequence of returns and the ending account value after 25 years occurred in the third five-year period (withdrawal years 11 to 15). This was true for each of the four portfolio models. One of the important attributes of a percentage-based withdrawal method is that it allows the annual withdrawals to decrease if the portfolio suffered a loss that year. This is a form of “portfolio compassion.” Conversely, a CPI-based COLA withdrawal method forces each year’s withdrawal to increase, more often than not because inflation is generally positive. (The annual rate of inflation was above zero 80% of the time during the 98 years studied.)
Suggestions for Retirees
A new retiree could—in many cases—view themself as a long-term investor and, as such, consider the appropriateness of a portfolio with at least a 60% overall allocation to equities and equity-like asset classes (such as real estate investment trusts). Furthermore, retirees should consider using a percentage-based withdrawal method where possible. RMDs are, of course, percentage-based. Thus, percentage-based withdrawals will naturally happen with retirement accounts that are governed by RMD withdrawal rules. The RMD is easy to hate because it is forced upon us, but the percentage-based nature of the RMD is a feature that is genuinely advantageous.
These two modest guidelines—a 60% equity/40% fixed-income retirement portfolio (or an overall asset allocation in that ballpark) and a percentage-based withdrawal method—will naturally insulate a retirement portfolio from both sequence and size of returns risk during the early years of portfolio withdrawals.
Conversely, a withdrawal method that forces the withdrawal to increase each year—such as a mandated 3% or 4% annual COLA or a CPI-based COLA (which forces an increase in the next year’s withdrawal a high percentage of the time)—exposes a retiree to the highest amount of sequence of returns risk—regardless of their retirement portfolio asset allocation.

Related

Portfolio Strategies
Key Numbers for Your Retirement Prep Checklist
Related

Portfolio Strategies
The Sequence in Which Returns Occur Affects Your Wealth
Discussion
FREE REPORT

Get your free copy of our special
report analyzing the tech stocks
most likely to outperform the
market.
MAX C from CA posted over 2 years ago:
DAVID L from NC posted over 2 years ago:
ROBERT A from NC posted over 2 years ago:
BARRY J from TX posted over 2 years ago:
RICHARD S from TX posted over 2 years ago:
JOHN B from OH posted over 2 years ago:
DAVE D from CA posted over 2 years ago:
M H from VA posted over 2 years ago:
CRAIG B from WI posted over 2 years ago:
MICHAEL D from CA posted over 2 years ago:
MICHAEL D from CA posted over 2 years ago:
BARRY J from TX posted over 2 years ago:
You need to log in as a registered AAII user before commenting.
Log InCreate an account