

Related

PRISM Wealth-Building Process
You can retire with confidence by estimating four numbers that are used to calculate a Secure Income Score.

Have you saved enough to retire? Are you going to run out of money in retirement? Will you be okay?
As you gear up for the next chapter of your life, these are some of the most frequently asked questions about retirement planning. There is also a myriad of circumstances that remain beyond your control as you plan for retirement. For instance, what will the stock market’s performance be like? Will bonds balance stock market volatility going forward as they have in the past? Will interest rates increase or decrease? Will inflation remain high? How long does your money need to last? Will your health insurance be adequate to cover a major health care event?
William Sharpe, a Nobel Prize–winning economist and professor emeritus at Stanford University, once said, “Having enough income to meet your current needs and also having enough to last your lifetime is the nastiest, hardest problem in finance.”
The investment industry responds to these retirement challenges with asset allocation, diversification and dynamic withdrawal rates. The insurance industry responds with annuities to pool life expectancy risks and guaranteed lifetime income.
Amid all the uncertainty in a retirement plan, there is one thing that is certain: You have the greatest influence over your spending in retirement. If you want to achieve greater confidence heading into retirement, carefully monitor your spending before deciding anything about asset allocation, diversification, withdrawal strategies or purchasing annuity income.
The purpose of this article is to simplify the complex and help you understand the four numbers you need to know to retire with confidence. Those numbers are:
Retirement is an exercise in cash flow: It is making sure you have enough income coming in every month to cover your expenses. Too often, people start the retirement process by adding up all of their investment accounts and then asking, “How much can I spend or what is a sustainable withdrawal rate?” We’re suggesting that this process be turned upside down. Add up all of your spending first, and then use that spending number to determine if you have saved enough.
As you begin to create a retirement spending plan, there are some nuances to consider:
Let’s unpack these areas and then we will conclude the article with some insights about portfolio construction, asset allocation, diversification and sustainable withdrawal rates to help create an investment strategy to complement your spending plan and help you achieve your retirement lifestyle goals.
Don’t be intimidated by those four numbers. You can reasonably determine each by following these suggestions.
None of us knows how long we will live. We could get hit by the proverbial bus tomorrow. But we can make an educated guess regarding life expectancy.
A starting point for life expectancy is using the Social Security mortality tables to understand the averages for men and women in the U.S. Then consider your health and family history as well as the fact that medicine, science and technology are getting better all the time. Medical advancements may provide for a longer life expectancy than we have seen in the past.
Once you have considered all this information, you can make a hereditary adjustment. Many people using the Retirement Budget Calculator at Parker Financial’s Sound Retirement Planning website adjust life expectancy to age 100 so they can see if their money will last that long.
You will want to add up all your guaranteed and reliable retirement income sources. This often includes Social Security benefits, pensions, rental income and a reverse mortgage for tax-free cash flow, among others.
Knowing how much of your income sources are stable will help inform much of the rest of your cash flow planning strategies. The most recent Social Security trustees report says that without changes, the benefits of Social Security will be reduced by about 23% starting in 2034. If you want to be ultraconservative, then you could model reduced future income from Social Security to reflect the projections in the trustees report.
This is one of the easiest numbers to understand as it simply involves adding up all the liquid accounts that you can use to supplement your income. Common account types include IRA, 401(k), 403(b), Roth IRA, Roth 401(k), brokerage accounts and savings accounts, among others.
Here is an ironic, but true, generalization: The closer people get to retirement and the higher their income, the less they understand their spending. High-income individuals tend to max out their savings and retirement accounts simply as a result of making much more than they spend. But many don’t know how much they are spending every year.
Dialing in your actual monthly and annual expenses is one of the first action items you’ll want to focus on before retiring. A solid grasp of your expenses will lead to greater confidence in your retirement planning.
As you begin thinking about your spending, you will want to identify which expenses are essential instead of discretionary. Essential items are those you cannot live without. Buying food and paying for costs associated with shelter are essential. Discretionary is usually associated with fun money—stuff and activities you can live without, such as discretionary travel, Netflix or Amazon Prime.
The purpose of the Secure Income Score is to calculate what percentage of your lifetime income is coming from guaranteed and stable sources such as Social Security, pensions and rental income compared to your lifetime of essential expenses. Ideally, 80% or more of your essential expenses are covered by guaranteed income. The more secure your income is to cover your basic essential needs, the less you will have to worry about volatility in your investment portfolio.
If your Secure Income Score is below 80%, you may want to consider reducing essential expenses or purchasing an income annuity with some of your retirement funds.
Here is the calculation from Parker’s Retirement Budget Calculator for the Secure Income Score:
For example, if your guaranteed lifetime income is $1 million and your essential expenses are $2 million, then your calculation is:
$1,000,000 ÷ $2,000,000 = 0.5
Converted to a percentage, this is a Secure Income Score of 50%.
When you model your expenses, you will also want to account for inflation. Rather than assume global inflation across all expenses, recognize that some expenses have no inflation while others have higher inflation.
For example, if you are heading into retirement with a mortgage, then the principal and interest of your mortgage payment would have a 0% inflation factor and that expense would have an eventual end date. On the other hand, property taxes and homeowner’s insurance may have a higher-than-average inflation rate and continue throughout retirement. Expenses for Medicare premiums may also increase at a higher-than-average rate of inflation, while increases in your food budget may only experience—over time—the long-term inflation average of 3% per year.
Retirement spending is not smooth. Spending levels, especially on discretionary expenses, are often higher at the onset of retirement as you explore new hobbies, travel and have more time, good health and your significant other as a companion. These years represent your go-go years.
As retirees approach age 80, they start to slow down and not travel as much. They share a meal when eating out and begin to stay closer to home. It is common for discretionary expenses to begin to decrease. These are the slow-go years.
In your no-go years, it’s not unusual to have medical expenses rise and your ability to travel decrease. Thus, as you think about your spending, it would be wise to assume some expenses such as travel will be higher at the onset of retirement and then will likely reduce over time. It would also be wise to plan for higher medical expenses later in retirement.
As you plan for the future, be sure to take into consideration any expenses that will cease or increase upon the loss of a spouse. Health insurance for one person will end, but you may need to hire someone to help with maintenance around the house.
Retirement is both one of the most important financial decisions and one of the most important transitions of your life. Going back to work in your 60s, 70s or 80s may not be an option.
With a retirement budget in place, we now turn our attention to the composition of a retirement portfolio. Here are five general guidelines.
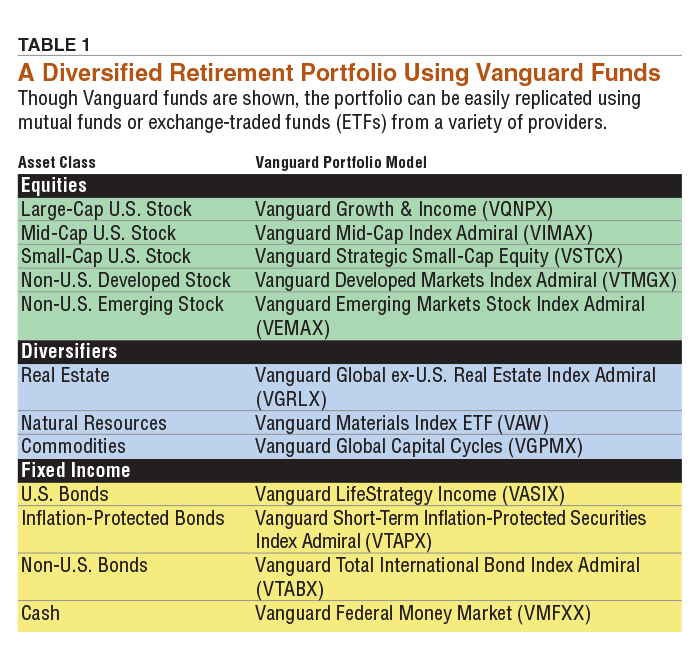
Retirement is a time to be broadly diversified because you want to have choices when it comes time to withdraw money. A diversified portfolio will naturally include mutual funds and/or exchange-traded funds (ETFs) that cover a wide variety of asset classes, including U.S. large-cap, mid-cap and small-cap stocks; non-U.S. stocks; real estate; commodities, bonds (U.S. and non-U.S.); and good old cash. Table 1 shows an example of a broadly diversified retirement portfolio, in this case using Vanguard funds. A comparable retirement portfolio could easily be built using mutual funds or ETFs from Fidelity, Charles Schwab, T. Rowe Price, American Century, etc.
The percentage allocation to each of the various funds is at the discretion of each retiree. That said, a commitment of at least 35% to the equity funds (highlighted in green) and at least 10% to 15% to the diversifier funds (highlighted in blue) would give the portfolio the “engines” needed to power a portfolio for 20 to 30+ years of retirement withdrawals.
Any investment portfolio that includes stocks, diversifiers and fixed income will experience volatility and there will be some years when some of the funds in the portfolio experience negative returns—like 2008 and 2022. The key is to stay in the boat. Let patience prevail. (The only way to avoid portfolio volatility is to park all your investment assets in cash or an annuity. The performance potential of those will not likely get the job done.)
Consider this: Since 1926 a 60% equity/40% fixed-income portfolio produced positive annual returns 75% of the time. The average annualized return was roughly 8% (assuming a portfolio cost of 80 basis points, or 0.8%). But patient investors (including retirees) who stayed committed to a 60%/40% portfolio for at least five years experienced positive five-year annualized returns 94% of the time since 1926. And investors who stayed committed for at least 10 years in a 60%/40% portfolio experienced positive 10-year returns 100% of the time.
Success comes to those who are consistent and patient. It’s up to us to add the “asset class” of patience to our own portfolio. (The 60%/40% portfolio was 40% large U.S. stock, 20% small U.S. stock, 30% bonds and 10% cash.)
There have been 73 rolling 25-year periods from 1926 to 2022. The first 25-year period was 1926–1950, the second from 1927–1951 and so on. Let’s assume that each of those 25-year periods represents a retirement period for 73 different retirees from the age of 73 to 98. If each retiree annually withdraws the amount of money stipulated by the IRS’ required minimum distribution (RMD) from retirement plan accounts, how often was their 60% equity/40% fixed-income retirement portfolio larger at age 98 than their starting balance at age 73? The answer is 82% of the time, assuming an annual portfolio cost of 80 basis points.
What would the results be if each of the 73 retirees withdrew 4% (the famous 4% withdrawal rate) of the portfolio’s end-of-year balance each year? The portfolio was larger than the starting balance 100% of the time. If, however, the retiree was invested 100% in cash during a 25-year retirement period, their portfolio was larger after 25 years of 4% withdrawals only 38% of the time.
These results assume the retiree stayed in the portfolio for the entire 25 years. They were patient and committed to a retirement portfolio that had a meaningful allocation to equity mutual funds. They didn’t let the natural volatility in an investment portfolio derail their commitment.
The RMD uses a percentage-based system. When only withdrawing a percentage of the portfolio’s value, it is not possible to completely liquidate the portfolio because after bad years (like 2008 or 2022), the next year’s annual withdrawal will be smaller than the prior year—precisely because the retirement portfolio’s value declined after a bad year. This is a self-protecting mechanism built into a percentage-based withdrawal system.
A hard-dollar withdrawal system (for example, a predetermined $50,000 annual withdrawal each and every year) does not have any sympathy after bad years like 2008. A dollar-based withdrawal system pulls out a set amount of money or a larger amount if a cost of living adjustment (COLA) is imposed, which essentially punishes a portfolio after it has already had a bad year.
We hope this article has prompted some ideas that are helpful to you as you prepare for, or continue in, wonderful and productive retirement years.
Taking a little extra time up front to have a solid retirement cash flow plan that includes making estimates about life expectancy, guaranteed income, savings and expenses will help you to develop a greater sense of confidence as you make the transition into retirement.
PRISM Wealth-Building Process

Financial Planning

Portfolio Strategies

ROBERT A from NC posted over 3 years ago:
DONALD M from AZ posted over 3 years ago:
JAMES H from PA posted over 3 years ago:
HARRY M from PA posted over 3 years ago:
Tom W from NJ posted over 3 years ago:
BARRY J from TX posted over 2 years ago:
BARRY J from TX posted over 2 years ago:
CRAIG B from WI posted over 1 year ago:
You need to log in as a registered AAII user before commenting.
Log InCreate an account