



Related

AAII Model Portfolios
A look at what happens to portfolio performance by acting on the January Barometer.
by John Bajkowski | April 2023

With the strong start to 2023, investors were hopeful that the old adage “as goes January, so goes the year” would hold true. A weak January in 2022 certainly set the tone for the year. Would a strong January in 2023 set a positive tone for this year?
Yale Hirsch, the founder of the Stock Trader’s Almanac, first documented the January observation in 1972 based upon a study of the S&P 500 index since 1950. The Stock Trader’s Almanac refers to this as the January Barometer and notes in the 2023 edition that since 1950 this barometer has only had 12 major errors and eight flat-year errors (less than +/– 5%) for an accuracy ratio of 72%.
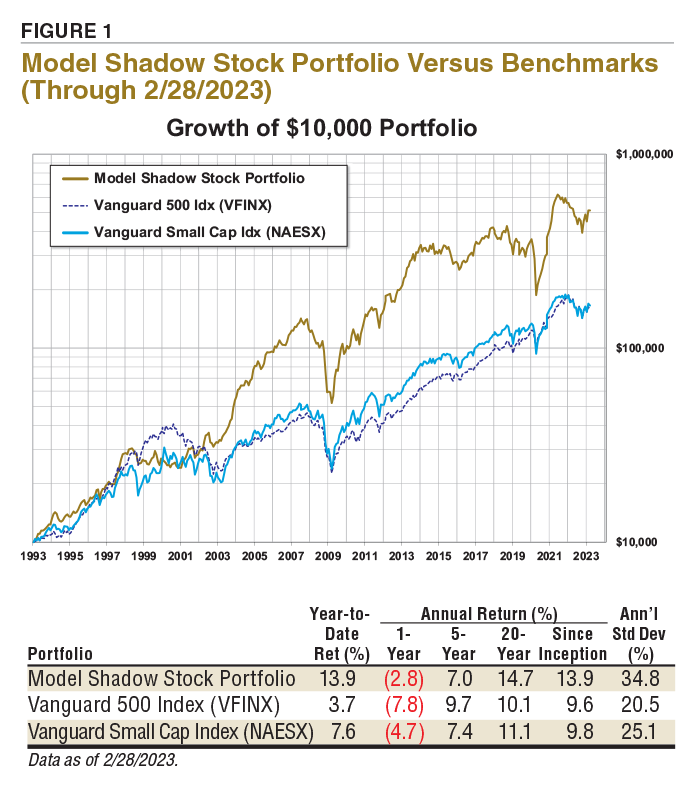
The Model Shadow Stock Portfolio gained 13.9% in January, after being down 19.7% during 2022. Was it time to celebrate? Small-cap stocks, such as those held in the Model Shadow Stock Portfolio, often move in a cycle slightly different than that of the large-cap S&P 500, so we thought it might be interesting to examine whether the January Barometer held true.
Table 1 displays the year-by-year performance for both the Model Shadow Stock Portfolio and the S&P 500, as measured by the Vanguard 500 Index fund  (VFINX), coupled with our analysis of the January Barometer.
One issue with the barometer is that annual price performance presented in the Stock Trader’s Almanac includes the performance during January. We present four columns of data in Table 1. The first column for each investment displays its total-return performance for the whole year. The next column simply notes if the model portfolio or Vanguard 500 Index fund had a negative January return for a given year. The next two columns for each investment make an adjustment based upon the January performance. For the third columns, we skip the entire year if the given portfolio was down during January. For the last column for each portfolio, we assume that you are always invested during January, and then that you are invested for the rest of the year if January was up or not invested if January was down.
Overall, over the last 30 full years, the Model Shadow Stock Portfolio had 12 losses during January, compared to 13 for the Vanguard 500 Index fund. However, comparing the second columns in the table reveals that for over one-third of the years, the January signal is different for the two investments. This confirms how differently the portfolio and index can behave over time.
The third and fourth columns seek to answer the question of whether you could have benefited from acting on the January Barometer with the Model Shadow Stock Portfolio. Unfortunately, over the last 30 years, the market moves were such that any advantages gained through the January Barometer were outweighed by the misses of either being out of the market when the market was strong after a weak January or suffering losses for the given year after a positive January.
For the Model Shadow Stock Portfolio, some of the most impactful misses occurred during the financial crisis and the years that followed. The Model Shadow Stock Portfolio gained 1.9% in January 2008, only for the portfolio lose 50.8% for the year. The next year, the Model Shadow Stock Portfolio lost 0.6% during January, while the portfolio gained 72.3% during 2009.
Overall, the Model Shadow Stock Portfolio has a compound annual gain of 13.9% over its full history. Following the January Barometer and being out of the market in the years January was down would have actually lowered the compound annual return to 11.5%. Staying invested during January and then going into cash for the remainder of the year when January performance was negative would have reduced the performance even further to 9.8%.
The January Barometer is different from the January effect, during which small out-of-favor companies often perform strongly during January. The other thing to keep in mind is that these returns ignore the impact of swiftly buying and selling the type of less-liquid stocks that constitute the Shadow Stock universe.
The Shadow Stock approach is best suited for the investor willing to take a longer-term perspective and capable of withstanding the greater volatility of smaller-company stocks, which will likely undergo periods of underperformance.
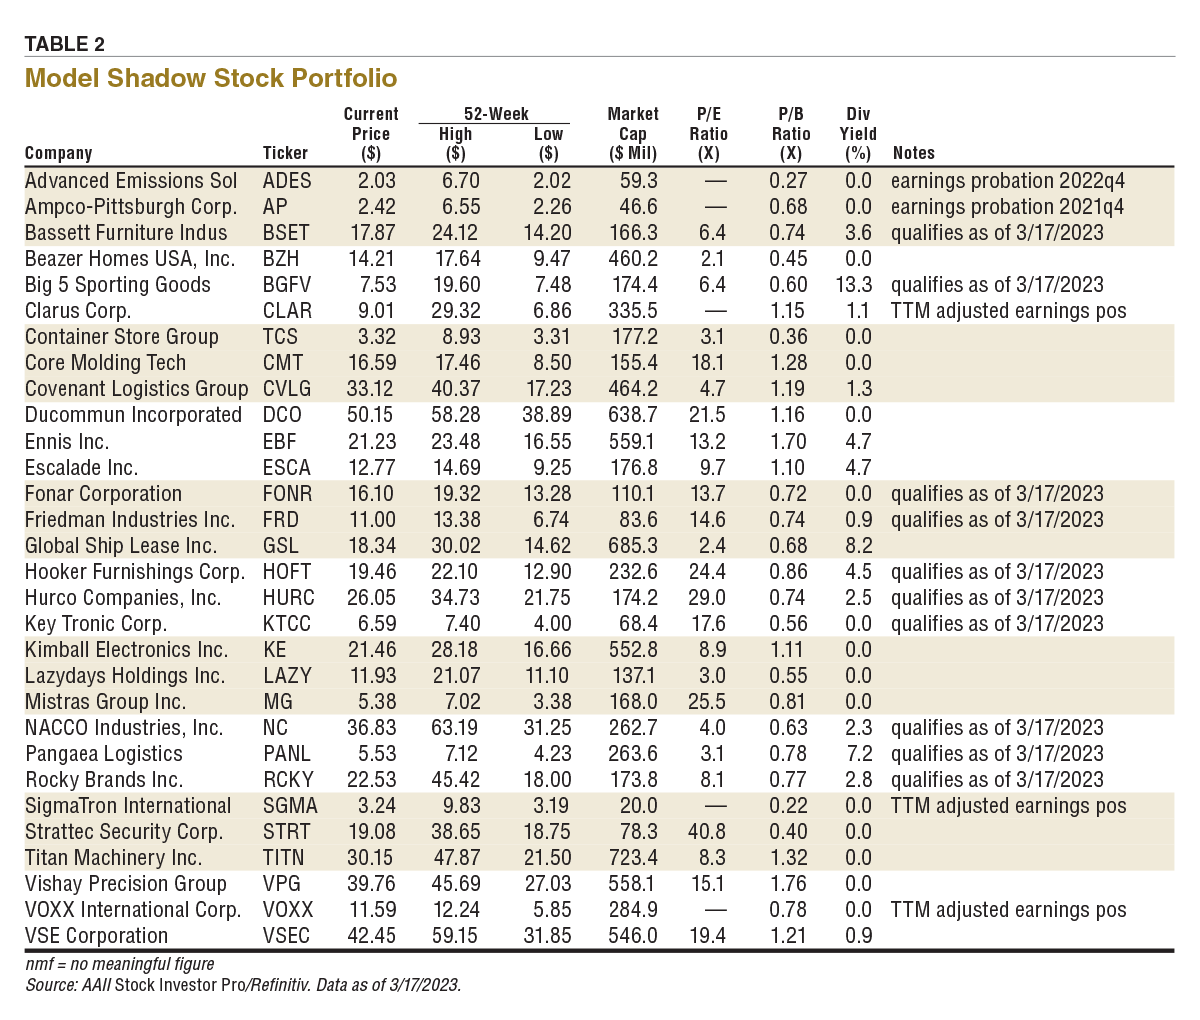
Figure 1 provides historical returns for the portfolio compared to benchmarks over various periods as of February 28, 2023. Table 2 shows the current holdings in the Model Shadow Stock Portfolio.
Approaching Size Limit: Stocks are sold if their market capitalization goes above three times the initial maximum criterion and there is a stock to replace it. The current market capitalization maximum for initial screening is $300 million. Stocks are marked “approaching size limit” if their current market cap exceeds 2½ times the initial criterion, or $750 million.
Approaching Value Limit: Stocks are sold once their price-to-book-value ratio goes above three times the initial criterion and there is a stock to replace it. The current initial price-to-book ceiling is 0.90. Stocks are marked “approaching value limit” if their current price-to-book-value ratio exceeds 2½ times the initial criterion, or 2.25.
Earnings Probation: If last 12 months’ earnings are negative, the stock is put on probation; if a subsequent quarter has negative earnings prior to 12-month earnings becoming positive, the stock is sold. When available, adjusted (non-GAAP) earnings are used to put stocks on probation or sell them. Otherwise, earnings from continuing operations are used. The date is the fiscal quarter during which the company first reported negative trailing 12-month earnings.
Qualifies as of: Stock still qualified as a buy when the screen was run with current data. Stocks that don’t currently qualify as a buy are held until they meet one of the sell rules.
TTM Adjusted Earnings Positive: Trailing four-quarter GAAP earnings are negative, resulting in no meaningful figure for the price-earnings ratio. However, adjusted earnings for the period are positive.
We conducted our quarterly Model Shadow Stock Portfolio review with the environment of a developing crisis of confidence in the strength of the banking system after the rapid failure of large regional banks such as Silicon Valley Bank. The Model Shadow Stock Portfolio does not hold any financials such as banks because their financial structure does not lend itself to valuation analysis using the price-to-book-value (P/B) ratio.
Nevertheless, investor concern suddenly shifted from the Federal Reserve’s tightening in an effort to contain an overheated economy to the potential economic fallout from weakness in regional banking activity. Regional banks play a critical role in local activities such as real estate development and providing loans and credit to smaller companies.
We completed our review on March 15, 2023, after most companies had reported quarterly earnings.
Profitability is the primary quality filter used to add and remove companies within the model portfolio, and we were curious to see how the holdings fared after the Fed’s recent aggressive action.
Looking at the market as a whole, earnings for the latest quarter have come in softer than initially projected. FactSet stated that 68% of the S&P 500 companies reported actual earnings per share above estimates, which is below the five-year average of 77%. The aggregate earnings reported by the companies in the S&P 500 have exceeded the estimated earnings by 1.3%, marking the seventh consecutive quarter in which earnings surprises grew weaker.
Turning our attention on the Model Shadow Stock Portfolio, one-third of the companies in the model portfolio are truly in the shadows of Wall Street and do not have any analyst coverage that generates an earnings estimate. Of the 20 stocks with a consensus earnings estimate, 13 (65%) had a positive earnings surprise for the latest quarter. As a whole, the surprises averaged 22.5%, while the median or midpoint surprise was 12.1%.
The range was quite wide with Core Molding Technologies Inc. (CMT) on the high end, reporting $0.57 per share, 307.1% above the $0.14 per share estimate provided by the single analyst following the company. Lazydays Holdings Inc. (LAZY) provided the biggest earnings miss with a loss of $0.24 per share, 265.5% below the positive $0.145 average earnings per share estimate.
The Model Shadow Stock Portfolio seeks positive earnings for the latest reported quarter and trailing 12 months. Companies with consensus estimates must also have positive expected earnings for the current quarter and fiscal year when adding stocks. However, there is a little leeway when removing stocks from the model portfolio. If a company reports trailing 12-month earnings from continuing operations that are negative, the stock is placed on probation; if a subsequent quarter has negative earnings prior to trailing 12-month earnings becoming positive, the stock is removed. When available, adjusted (non-GAAP) earnings are used to put stocks on probation or remove them. These are earnings that have been adjusted to eliminate the impact of nonrecurring events, such as markdown of inventory or goodwill. These are earnings reported in the media and firms reporting consensus estimates. The I/B/E/S adjusted earnings reported in AAII’s Stock Investor Pro fundamental stock screening and research database are used for Model Shadow Stock Portfolio decisions when they are available.
Coming into the quarter, only Ampco-Pittsburgh Corp. (AP) was on earnings probation. The company first went on probation after reporting negative trailing 12-month earnings for the quarter ended December 31, 2021. It has reported positive earnings for each of the last three quarters since going on probation and is not scheduled to report fourth-quarter results until March 21, 2023. The stock remains on probation for now.
During the quarter, Advanced Emissions Solutions Inc. (ADES) reported a loss of $0.17 per share, which pushed its trailing 12-month earnings into the red, placing the company on earnings probation.
Outside of profitability, the primary factors driving portfolio additions and deletions involve company size and value. Overall, stocks are removed from the model portfolio if earnings turn negative or if strong growth and positive expectations push up the size of the company and its valuation beyond desired levels.
The Model Shadow Stock Portfolio selection criteria targets the “cheapest” 10% of domestic stocks as measured by the price-to-book-value ratio. The decile breakpoint for value is determined by examining price-to-book levels of domestic companies listed on the New York Stock Exchange (NYSE) and then using the price-to-book breakpoint for stocks listed on all domestic exchanges.
The price-to-book cutoff had increased slightly from 0.84 in December to 0.88 in early March this year. With the current initial qualifying maximum price-to-book ratio at 0.90, we are leaving it unchanged. Qualifying stocks must have a price-to-book ratio of 0.90 or lower. Stocks in the model portfolio are removed for valuation if they exceed three times the minimum initial price-to-book ratio at the time of a quarterly portfolio review.
Vishay Precision Group Inc. (VPG) has the highest price-to-book-value ratio in the Model Shadow Stock Portfolio. Its price-to-book ratio of 1.76 on March 17, 2023, is well below the 2.70 value used to remove stocks from the model portfolio. Therefore, no stocks are being deleted this quarter for exceeding the valuation limit of the model portfolio.
We then examined market-capitalization levels of the domestic companies listed on the NYSE to determine the size cutoff for the lowest decile. Here, the market-cap level maximum was $297 million, compared to $300 million in December 2022. With the current market-cap cutoff at $300 million, there was no need to change the portfolio rules.
When we conducted the portfolio review using data as of March 14, 2023, Titan Machinery Inc. (TITN) had a market cap of $917 million, which exceeded the size limit and slated the stock to be removed. However, the market cap and stock price were down the next day when it was time to act upon the decision and send out the alert, such that it no longer qualified as a deletion for size. Market cap is determined by multiplying share price by the number of shares outstanding, and the price decline pushed the market cap below the $900 million maximum level for the portfolio. Therefore, no stocks are being removed this quarter for exceeding the valuation market-cap limit of the model portfolio, so we are leaving the portfolio unchanged.
The next quarterly review takes place after the end of May 2023. Any changes to the portfolio are reported at the time they are made in our Model Shadow Stock Portfolio Update emails (sign up at www.aaii.com/email).
AAII Model Portfolios

AAII Model Portfolios

No comments have been added yet. Add your thoughts to the discussion!
You need to log in as a registered AAII user before commenting.
Log InCreate an account