


Related

AAII Model Portfolios
Small-cap returns have been greater than that of large caps over the long term, but there are often streaks of outperformance followed by underperformance.
by John Bajkowski | July 2022

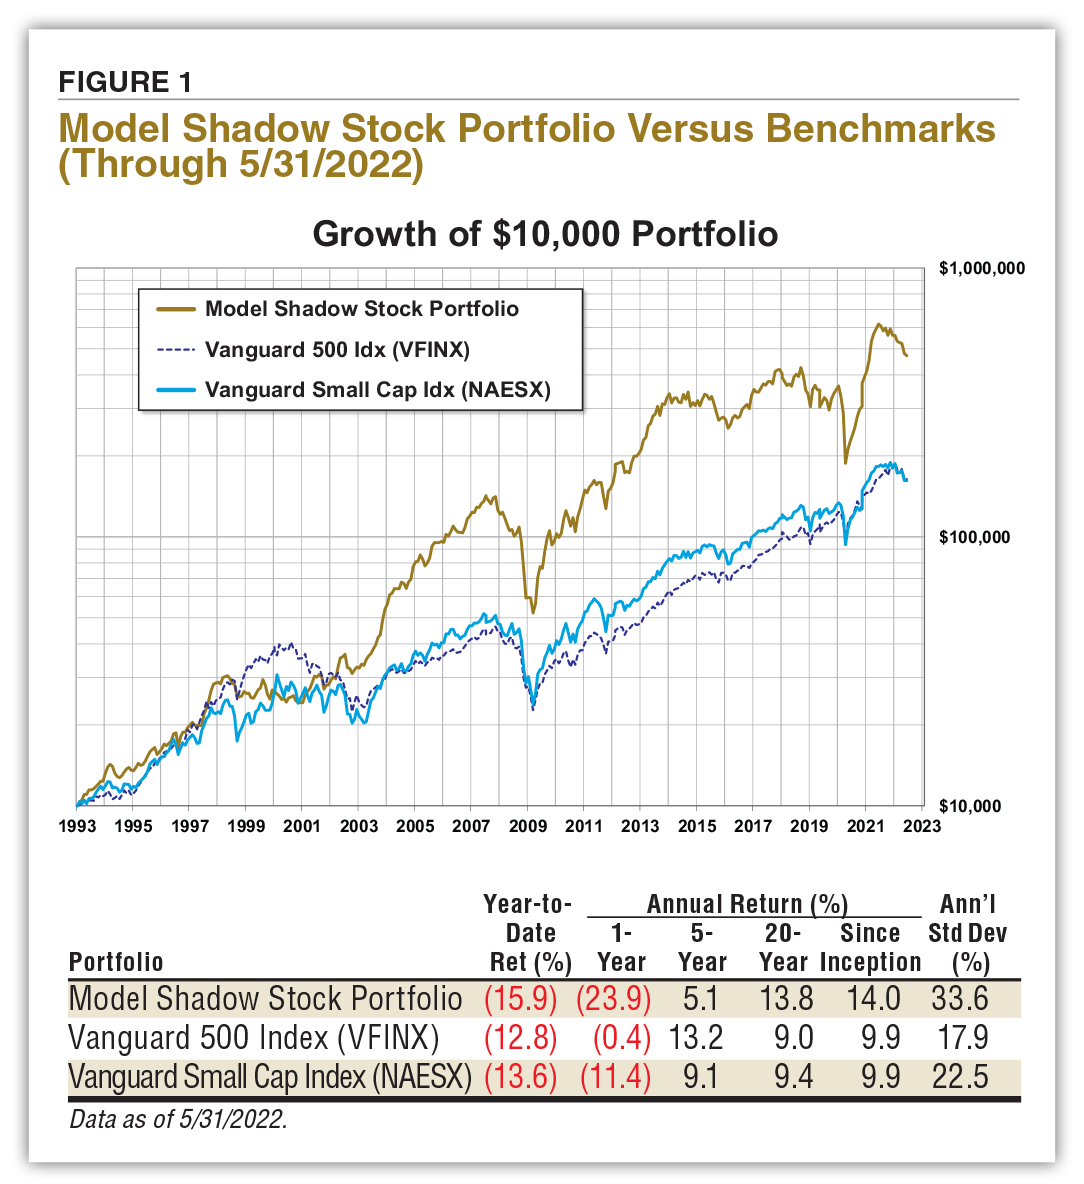
While the S&P 500 index squeaked out a 0.2% gain during May, growing concerns over persistent inflationary pressure and need for tightening monetary policy weighed on investor sentiment, pushing the S&P 500 into a bear market during June. Figure 1 shows returns for the Model Shadow Stock Portfolio compared to benchmarks over longer periods of time.
Inflationary pressure has spread from a relatively narrow segment of goods tied to pandemic-related shortages to a wide array of goods, food, housing, energy and even services. Transitory inflation has turned persistent. Consumer purchasing patterns are changing. Supply constraints of goods and services continue. The war continues between Russia and Ukraine with human, political and economic impact. Even the coronavirus continues to mutate and disrupt the world.
The Federal Reserve’s policy has reversed from accommodating to tightening to rein in inflation and the economy. The stock market is forward-looking and one of the best predictors of the direction of the economy. Investor appetite for risk has decreased as concerns over the possibility of a recession have increased while also recognizing the headwinds that corporate profits face. We see the collective impact with weak stock market performance and bearish investor sentiment.
It is important to remember that bear markets turn into bull markets, and normally the strongest gains come early in the bull market. It is best to follow a disciplined investment approach and not let your emotions (fear or greed) drive your actions.
As is often noted, less-liquid micro-capitalization stocks typically go down more deeply during corrections, only to bounce back more strongly in the subsequent market upturn.
Generally, riskier and less-liquid assets are the stronger-performing groups during a recovery. During the financial crisis, the Model Shadow Stock Portfolio lost more than the large-cap S&P 500 (down 63.4% versus 51.0%) but recovered to its previous high more quickly (3.4 years versus 4.8 years). It is important to note that past patterns do not always repeat, but it is helpful to study historical patterns.
The Model Shadow Stock Portfolio has a 14.0% annualized rate of return since inception, compared to 9.9% for the Vanguard 500 Index fund  (VFINX). The Model Shadow Stock Portfolio’s return has come with more frequent corrections and bear market periods.
We examined the monthly total returns of the Model Shadow Stock Portfolio along with the Vanguard 500 Index fund to gain a sense of the frequency, duration and severity of corrections and bear markets over its history.
Drawdowns measure the severity of a loss. The drawdown is the decline from a prior high in portfolio or market value. Drawdowns reflect the total drop experienced during a bear market, but the duration is longer since the drawdown also reflects time needed before the full loss is recouped, not just when the downturn is reversed. For example, the Vanguard 500 Index fund hit bottom during March 2021, but it did not recoup its losses until June 2021.
Our analysis relied on monthly total-return data, which can mask some of the shorter-lived corrections that occur mid-month. For example, the S&P 500 correction that occurred on February 22, 2022, was not part of the monthly return data, which registered a combined 8.0% total-return loss for the Vanguard 500 Index fund in the first two months of 2022. We did however include the June 2022 performance through June 17, 2022, in our analysis to capture the current bear market.
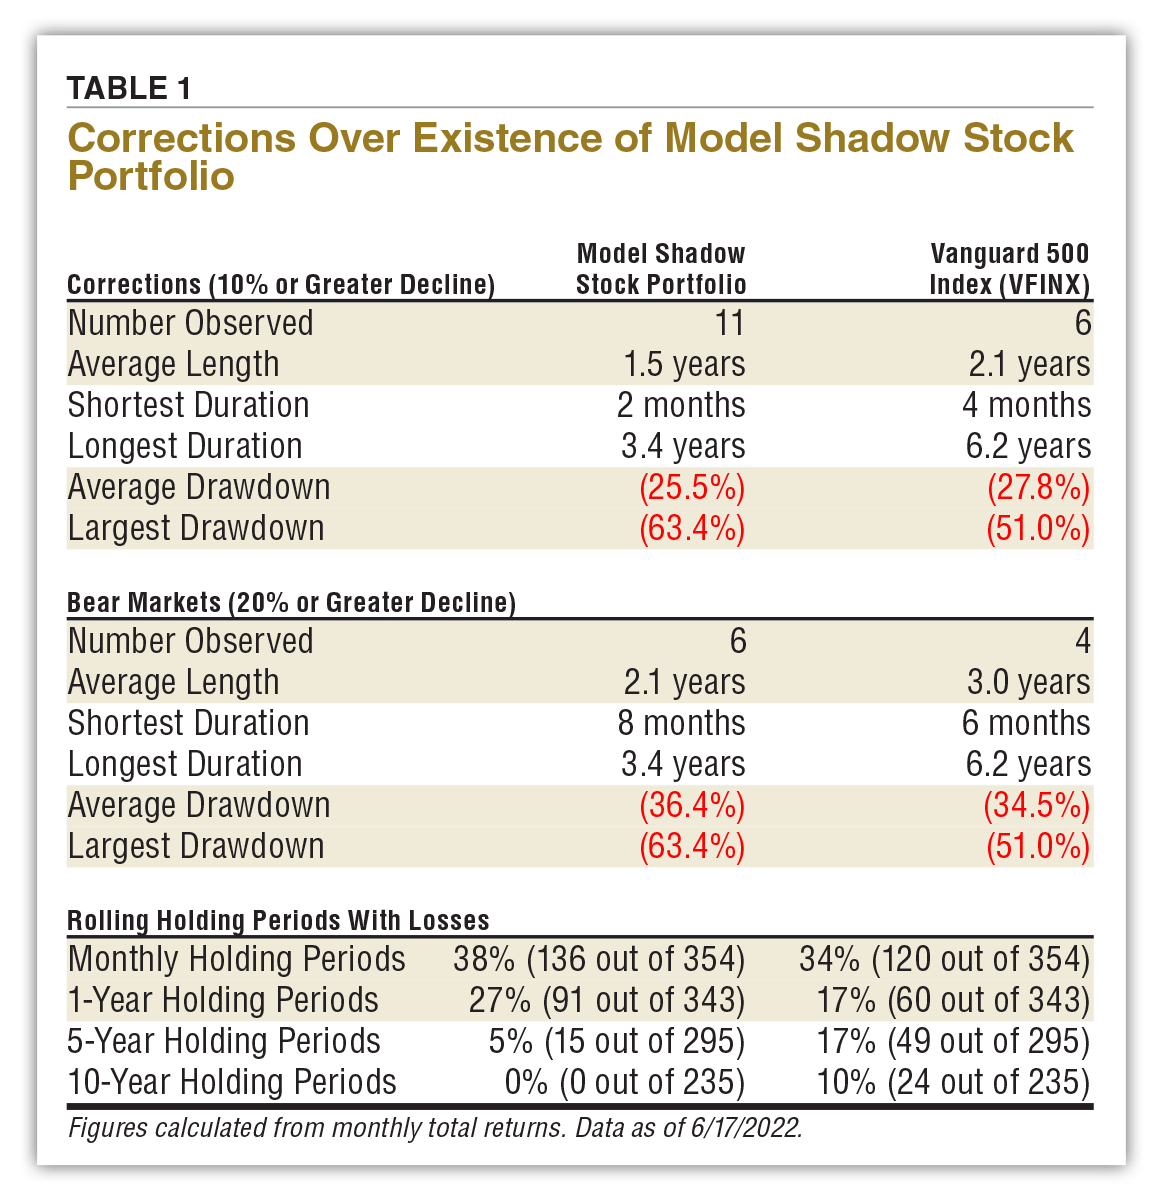
Corrections are generally classified as declines of 10% or greater. As Table 1 shows, the Model Shadow Stock Portfolio has had 11 observed corrections, and six of them have turned into bear markets of 20% or greater. The average correction has been 1.5 years in length, with an average drawdown of 25.5%. The longest correction for the Model Shadow Stock Portfolio was 3.4 years and had a drawdown of 63.4% (July 2007 to November 2010).
Using monthly total-return data, the Vanguard 500 Index fund has had six observed corrections and four of them have gone on to become bear markets of 20% or greater. The average correction has been 2.1 years in length, with an average drawdown of 27.8%. The longest correction (September 2000 to October 2006) was 6.2 years, with a drawdown of 44.8%, but the greatest drawdown of 51.0% was with the 2007 bear market that lasted 4.8 years (November 2007 to July 2012).
The greater volatility combined with the stronger long-term return of the Model Shadow Stock Portfolio is also reflected in observed losses for various holding periods over the history of the portfolio. Looking at individual monthly returns, the Model Shadow Stock Portfolio has been down for 38% of individual months compared to 34% for the S&P 500 as measured by the Vanguard 500 Index fund.
If you examine various rolling holding periods, the likelihood of seeing a loss starts to diminish, yet the possibility remains until the holding period extends out many years. For the Model Shadow Stock Portfolio, we observed losses 27% of the time over rolling one-year periods compared to 17% of the time for the Vanguard 500 Index fund.
With five-year holding period returns, losses were observed only 5% of the time for the Model Shadow Stock Portfolio, compared to 17% of the time for the Vanguard 500 Index fund. Historically, with 10-year holding periods, there were no losses for the Model Shadow Stock Portfolio, while around 10% of the Vanguard 500 Index fund’s 10-year holding periods resulted in losses. The 10-year holding period returns that capture both the tech bubble bursting in the early 2000s and the financial crisis of 2007–2008 hurt large-cap stocks more than small-cap value stocks.
It is important to consider that past performance is no guarantee of future results, but a study of historical market performance is insightful. Small-cap returns have been more volatile than the returns of large companies. Small-cap returns have been greater than the returns of large-cap companies over the long term, but there are often streaks of outperformance followed by underperformance. The Model Shadow Stock Portfolio has more frequent corrections and bear market cycles than the S&P 500, but the down periods have generally been shorter in duration and bull market reversals stronger.
We conducted our quarterly Model Shadow Stock Portfolio review with the background of a volatile and uncertain stock market. We let the model portfolio rules guide our actions. The quarterly portfolio review is tied to the quarterly earnings reporting cycle of domestic companies. Companies are normally sold from the model portfolio if earnings turn negative or if strong growth and positive expectations push up the size of the company and its valuation beyond our desired levels.
The review begins with an examination of the prevailing valuation segments of the marketplace. The Model Shadow Stock Portfolio selection criteria targets the “cheapest” 10% of domestic stocks as measured by the price-to-book-value (P/B) ratio. The decile breakpoint for value is determined by examining price-to-book levels of domestic companies listed on the New York Stock Exchange (NYSE) and then using the price-to-book breakpoint for stocks listed on all domestic exchanges.
We determined the maximum price-to-book value for the lowest decile (lowest 10%) value universe among NYSE-listed stocks using AAII’s Stock Investor Pro stock screening program. The price-to-book cutoff had decreased slightly from 0.90 in March to 0.89. With the current initial qualifying maximum price-to-book ratio at 0.90, we are leaving it unchanged. Qualifying stocks must have a price-to-book ratio of 0.90 or lower. Stocks in the model portfolio are sold for valuation if they exceed three times the minimum initial price-to-book ratio at the time of a quarterly portfolio review. In other words, for this quarter’s review we use a price-to-book cutoff of 0.90 to screen for stocks to add to the Model Shadow Stock Portfolio and 2.70 (0.90 (AP) 3) as the maximum price-to-book ratio to keep stocks in the portfolio.
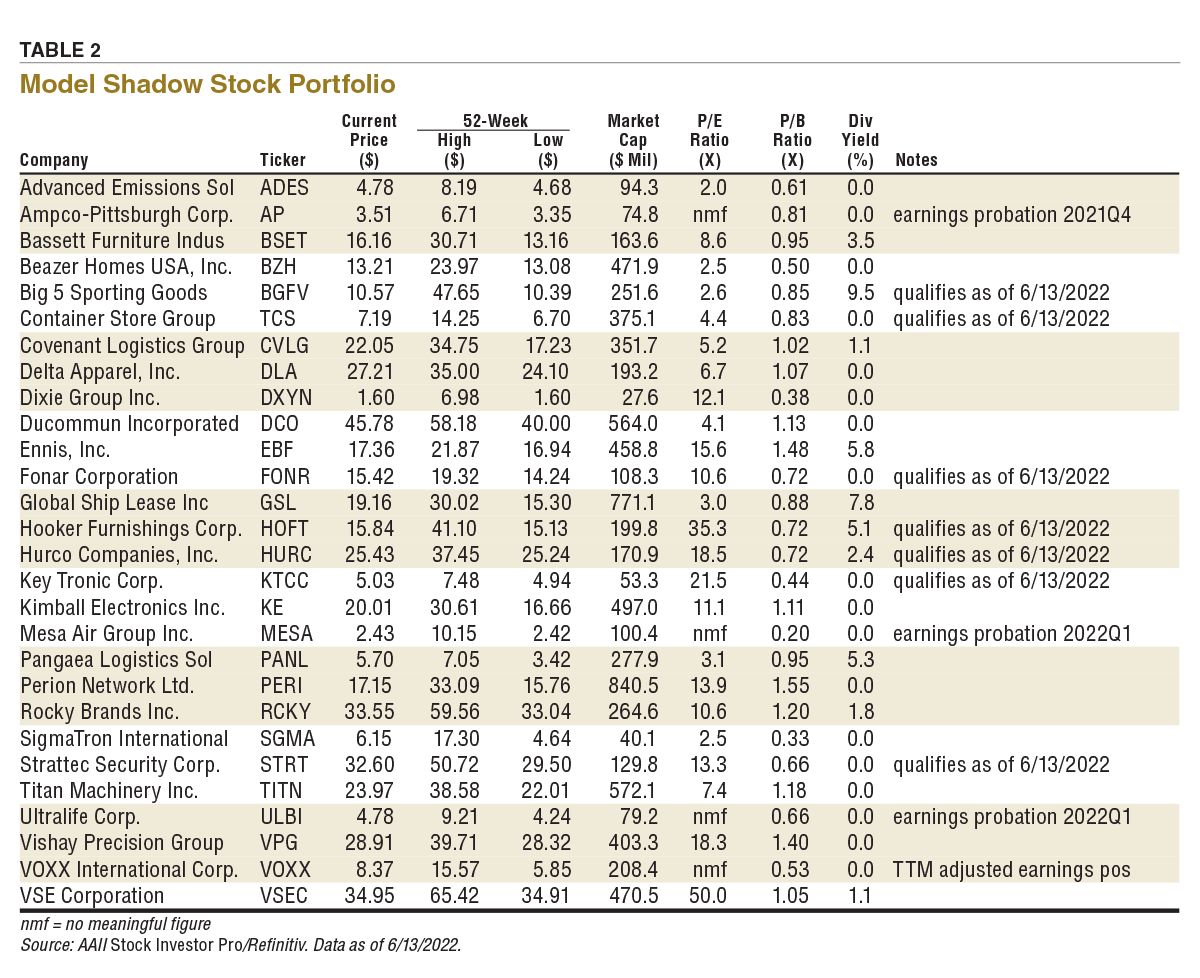
Table 2 shows the current holdings in the Model Shadow Stock Portfolio. As of June 13, 2022, Perion Network Ltd. (PERI) had the highest price-to-book-value ratio in the portfolio. Its price-to-book ratio of 1.55 is well below the 2.70 value used to remove stocks from the model portfolio. Therefore, no stocks are being sold this quarter for exceeding the valuation limit of the model portfolio.
We then examined market-cap levels of the companies listed on the NYSE to determine the size cutoff for the lowest decile. Here the market-cap level maximum was $383 million, compared to $429 million in March 2022. The decline was not significant enough to warrant a change to the portfolio rules. The maximum market cap for inclusion in the Model Shadow Stock Portfolio is $400 million, and holdings are sold if their market cap goes above three times the initial criterion at the time of the quarterly review: $1.2 billion.
Perion Network also had the highest market cap in the portfolio, with a value of $840.5 million as of June 13, 2022. Its market cap was well below the removal level of $1.2 billion, so no stocks are being removed this quarter for exceeding the size limit of the model portfolio.
The other major factor that leads to portfolio turnover is tied to negative earnings. If a company reports trailing 12-month earnings from continuing operations that are negative, the stock is placed on probation; if a subsequent quarter has negative earnings prior to trailing 12-month earnings becoming positive, the stock is sold.
Coming into the quarter, only Ampco-Pittsburgh Corp. (AP) was on earnings probation. The company reported positive fully diluted earnings of $0.084 per share for the quarter ending March 31, 2022. While the results were not strong enough to raise the trailing earnings per share figure into positive territory, the company does not meet the earnings sell rule. During the quarter both Mesa Air Group (MESA) and Ultralife Corp. (ULBI) reported losses great enough to push their trailing 12-month earnings into negative territory. The firms are now on earnings probation.
A stock can also be removed if it has been held for over four years if it also no longer meets the initial rules for qualifying and has not gained at least 10% annually from its purchase price and there is a new qualifying stock to replace it. The four-year rule is normally enforced during the year-end review.
No stocks met the portfolio sell rules during the quarterly review, so we are leaving the portfolio unchanged.
The next quarterly review takes place after the end of September 2022. Any changes to the portfolio are reported at the time they are made in our Model Shadow Stock Portfolio Update emails (sign up at www.aaii.com/email).
AAII Model Portfolios
AAII Model Portfolios
AAII Model Portfolios

GUY M from NH posted over 3 years ago:
You need to log in as a registered AAII user before commenting.
Log InCreate an account