

Related

Investor Professor
The earnings yield is frequently used to assess the valuation of stocks compared to the valuation of bonds.

Charles Rotblut leads a class in AAII's new Essential Investing Video Course. Go to https://www.aaii.com/ves for more information and to subscribe.
One method for assessing the relative valuation of stocks is to compare their earnings yields to the yields on bonds. This is a method used by Warren Buffett’s mentor Benjamin Graham and many others throughout the years.
The earnings yield is the inverse of the price-earnings (P/E) ratio. Rather than dividing price by earnings, earnings are divided by price (E/P). The S&P 500 index’s earnings yield at the start of March 2023 was 4.73%, according to Nasdaq. The long-term median according to Multpl.com is 6.70%.
The percentages use trailing 12-month earnings for the S&P 500. Variations exist. The so-called Fed Model, for instance, uses estimated earnings for the next 12 months. In his famous book “The Intelligent Investor,” Graham used average earnings for the last three years as an example.
Regardless of which earnings number is employed, the earnings yield is frequently used to assess the valuation of stocks compared to the valuation of bonds. The cheaper asset class is the one with the higher yield.
For the chart below, we used the trailing 12-month earnings yield from Nasdaq and the 10-year Treasury bond yield from the U.S. Department of the Treasury. Beginning of month values were used for both. We specifically started the period at the beginning of the coronavirus pandemic to show how the comparative yields have gone from being quite separated to moving close together.
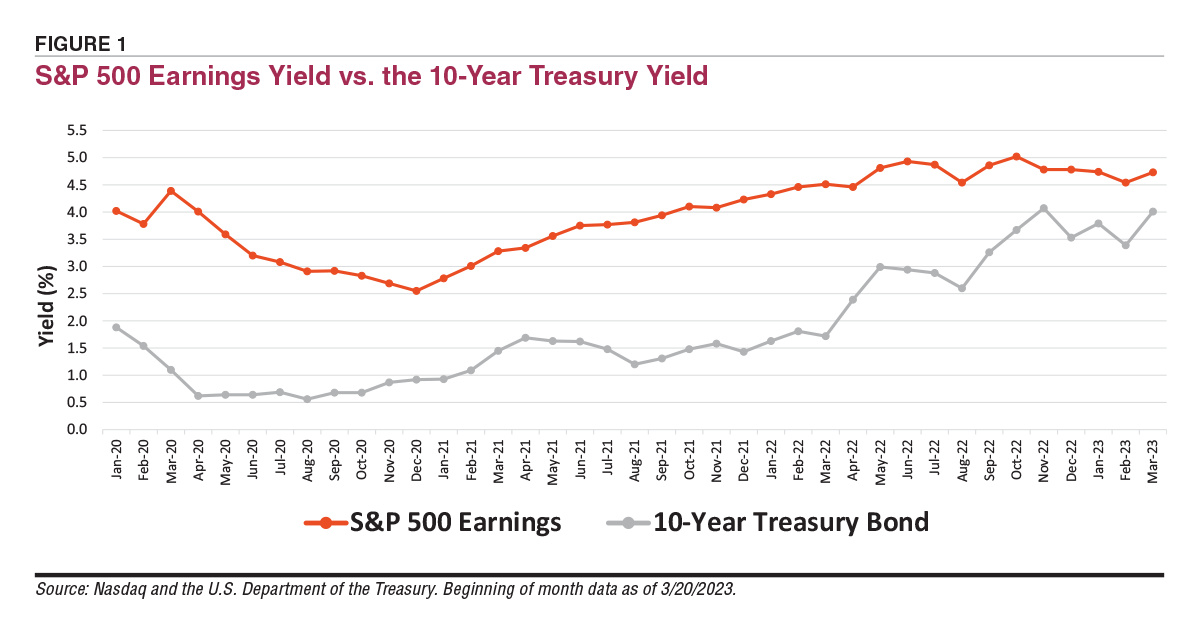
At the beginning of April 2020, the S&P 500’s earnings yield was 6.5 times greater than the yield on the 10-year Treasury bond (4.01% versus 0.62%). This coincided with the early days of the last bull market.
This gap narrowed as the Federal Reserve aggressively tightened monetary policy. The S&P 500’s earnings yield at the start of March 2023 was 4.73%, while the 10-year Treasury bond yielded 4.01%. This equates to a ratio of 1.18. (The post–World War II median ratio based on Robert Shiller’s data is 1.25.)
The many interest rate hikes since March 2022 have reduced bond valuations. Since yield and price are inverted, the higher yields have made bonds more attractive. Meanwhile, the earnings yield on stocks has been rangebound since May 2022, fluctuating between a low of 4.54% in February 2023 and a high of 5.02% in October 2022.
Like other valuation indicators, comparisons between earnings yields and bond yields have had a questionable history as a shorter-term timing tool. Valuations can veer from their historical ranges for an extended period.
What these comparisons can tell you is whether stocks or bonds appear cheap or expensive relative to each other. When valuations of either appear to be unusually cheap or expensive, it can be a sign to review your asset allocation to determine if you are overweighted or underweighted to certain asset classes relative to your target allocation.
Investor Professor

Stock Strategies


David D from USA posted over 3 years ago:
JOHN L from NJ posted over 3 years ago:
JOHN L from NJ posted over 3 years ago:
You need to log in as a registered AAII user before commenting.
Log InCreate an account