


Related

AAII Stock Ideas
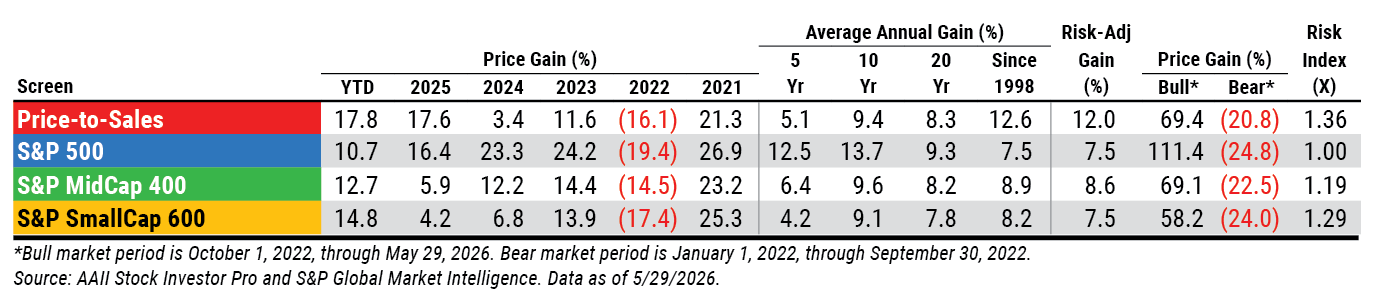
AAII’s Price-to-Sales screen is a solid performer, delivering positive returns in 21 out of the 28 years since its origination.

During the latter part of the 1990s, investors bid up the stock prices of companies with high expected future prospects. Because many of these firms had little, if any, current profits, investors sought alternatives to traditional earnings-based valuation models. The price-to-book-value (P/B) ratio was also of limited use for these new-era companies because their value came from intangibles that were not reflected in their book value. Instead, the price-to-sales (P/S) ratio—current stock price divided by sales per share for the past 12 months—gained momentum as a valuation metric.
Ken Fisher first popularized the strategy of selecting stocks based on the price-to-sales ratio in his 1984 book, “Super Stocks.” Later, James O’Shaughnessy promoted the use of the price-to-sales ratio when his research made it a cornerstone of his single-factor value and growth approaches.
Advocates of the price-to-sales ratio strategy argue that earnings-based approaches to selecting stocks are imperfect because earnings themselves are subject to many management assumptions trickling through the accounting books. In addition, temporary developments—such as costs involved with new product rollouts or cyclical slowdowns—can affect earnings more than sales. When this results in negative earnings, it prevents the use of earnings-based models.
The price-to-sales ratio continues to be a useful tool amid the current artificial intelligence (AI) boom, but it requires special consideration to be used effectively. Price-to-sales figures are not perfect. Desirable price-to-sales levels tend to be tied to profit margins and growth rates.
AAII tracks more than 50 stock screening methodologies on AAII.com and reports both the companies passing each screen and the performance of simple hypothetical portfolios invested in those passing companies.
AAII developed a low price-to-sales ratio screening strategy that also considers industry factors and seeks companies with:
The full criteria used for the screen is listed in the box below.
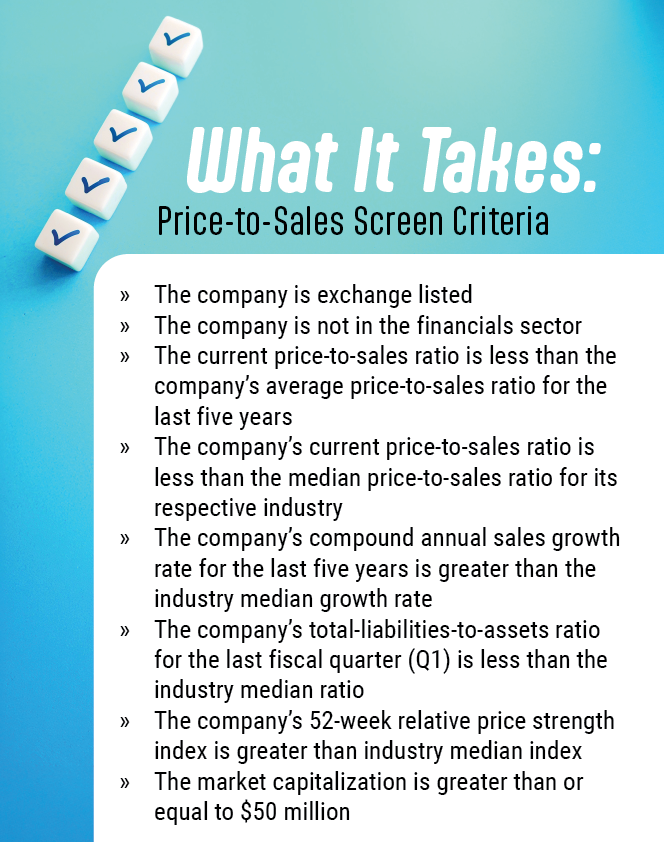
The AAII Price-to-Sales screen is available to all AAII members through the AAII Investor Hub. Members can see the companies passing the screen each day, along with monthly performance for a simple hypothetical portfolio.
The screen can be customized by A+ Investor and AAII Platinum subscribers through the AAII Custom Stock Screener. The screen is preprogrammed in AAII’s Stock Investor Pro fundamental stock screening and research database, where it can also be modified by subscribers.
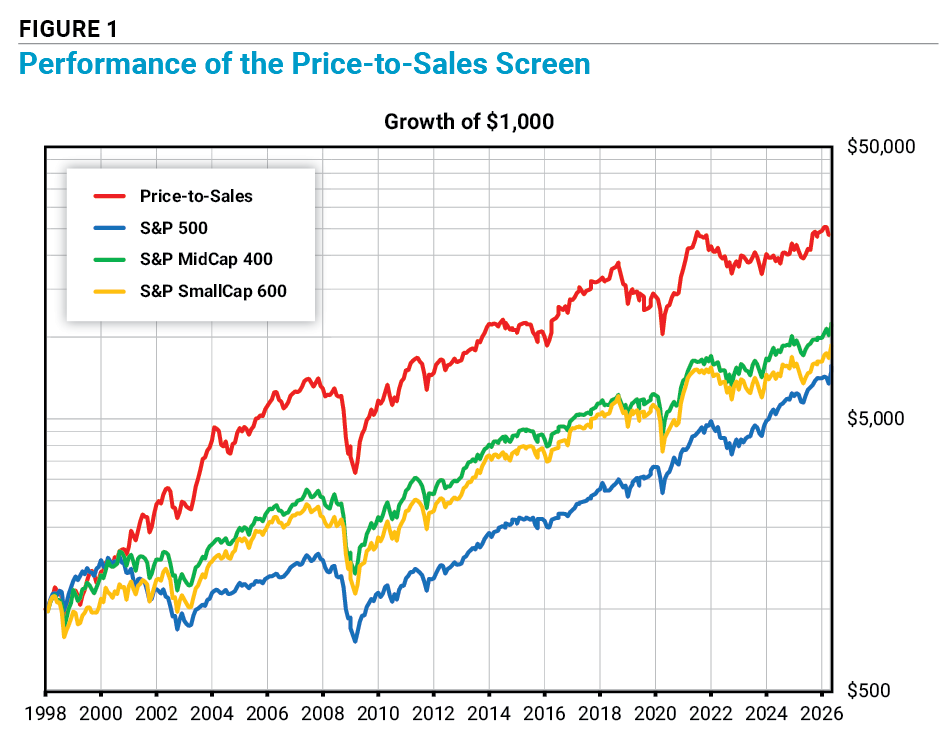
The AAII Price-to-Sales screen has produced solid performance since its inception in 1998. In fact, it has delivered positive returns in 21 out of the 28 years since its origination.
The Price-to-Sales screen carries a risk index of 1.36. This reading suggests that the screen is roughly one-third more volatile than the S&P 500 index.
Figure 1 illustrates how the Price-to-Sales screen has easily outpaced both the small- and large-cap indexes over the study period. Between January 1998 and the end of May 2026, the screen returned an annualized 12.6%, or a risk-adjusted 12.0%, compared to an annualized return of 7.5% for the S&P 500, 8.9% for the S&P MidCap 400 index and 8.2% for the S&P SmallCap 600 index. As of May 29, 2026, the Price-to-Sales screen is up 17.8% year to date, compared to 10.7% for the S&P 500, 12.7% for the S&P MidCap 400 and 14.8% for the S&P SmallCap 600 over the same period.
As shown in Table 1, the stocks currently passing the Price-to-Sales screen tend to be cheaper across most valuation metrics. They also have historical and expected growth roughly equal to that the median for the S&P 500 constituents and exchange-listed stocks, but they are smaller as measured by market capitalization.
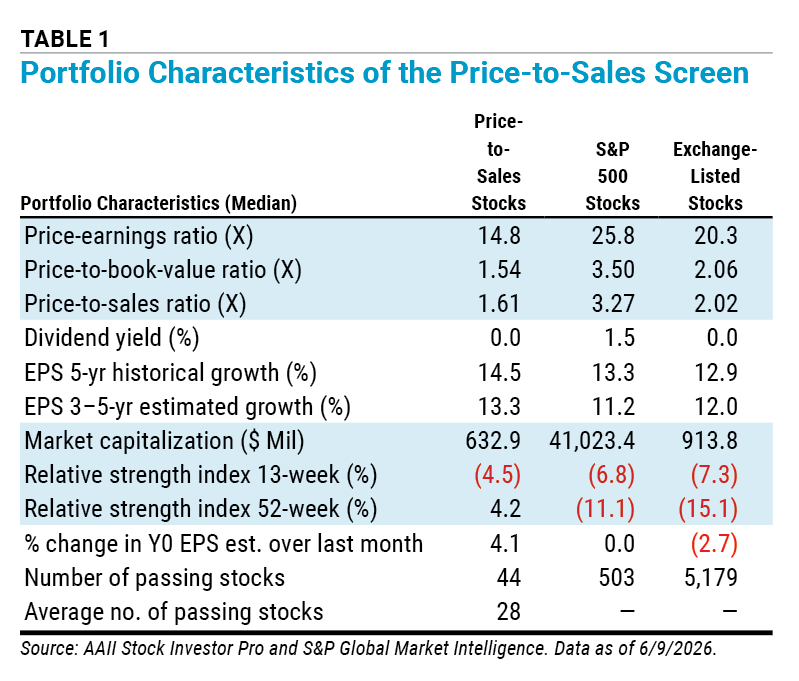
An average of 28 companies typically pass the Price-to-Sales screen, but 44 firms passed the screen with data as of June 9, 2026. To reduce the list of passing companies, we compared the stocks’ price-to-sales ratios to the median ratio for each company’s respective industry. We also excluded two real estate investment trusts (REITs) since the price-to-sales ratio is less meaningful for that industry.
Table 2 presents the 30 companies with greatest discount relative to their industry medians. The companies are ranked lowest to highest by their price-to-sales ratio relative to the industry median price-to-sales ratio.
Go to All Screens for an updated list of stocks passing this screen.
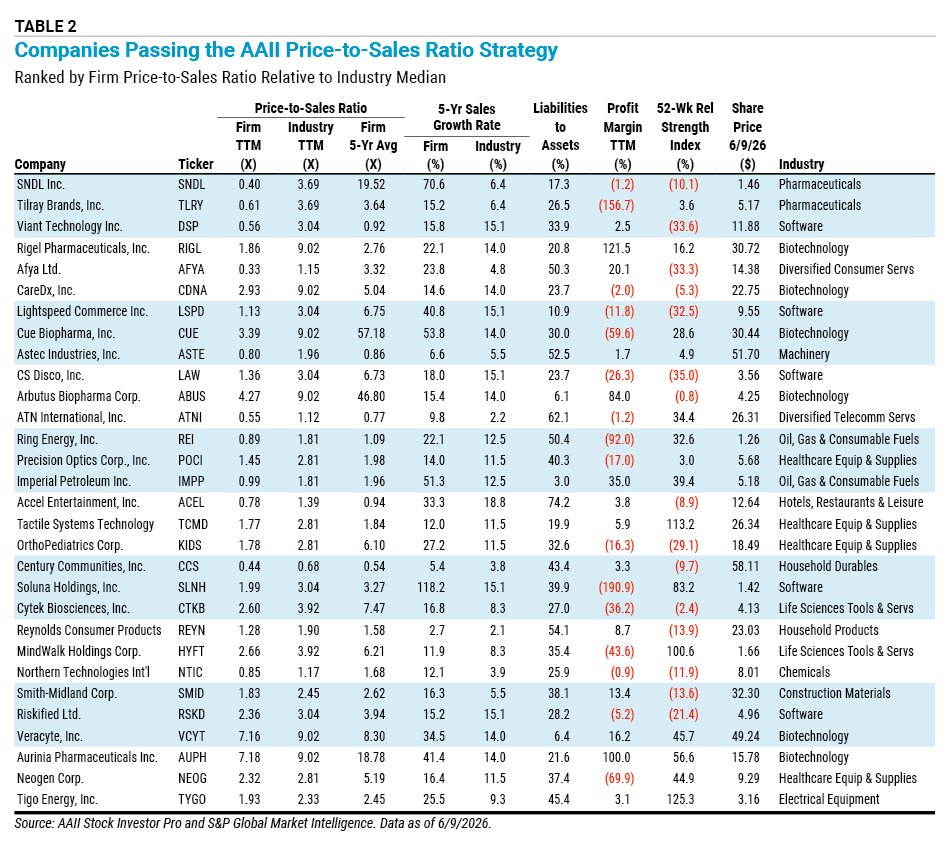
Companies with a price-to-sales ratio below the industry median may be undervalued and neglected by investors, provided that they have comparable growth, financial strength and profitability. Price-to-sales levels are tied to expectations of future company growth, profitability and risk. The higher the expected growth, the higher the price-to-sales ratio a stock can support. Higher profit margins also translate into higher price-to-sales ratios. Profit margins measure the level of income produced for a given level of sales.
SNDL Inc.  (SNDL) has the largest price-to-sales discount relative to its industry median, with a ratio of 0.108 (its current price-to-sales ratio of 0.40 divided by the industry median of 3.69). While SNDL Inc. is classified within the pharmaceuticals industry, the company primarily produces, distributes and sells cannabis products for the adult-use market in Canada and internationally. As a result, investors may question whether SNDL Inc. is truly comparable to traditional pharmaceutical companies and whether its attractive valuation relative to its industry is meaningful.
The company’s historical price-to-sales ratios also illustrate the challenges of relying solely on quantitative measures. SNDL Inc.’s five-year average price-to-sales ratio is 19.52, compared to its three-year average of just 0.78. The dramatic difference largely reflects the company’s transformation from a small cannabis producer into a diversified retail operator through a series of acquisitions over the last five years.
This example highlights an important consideration when using the price-to-sales ratio—or any quantitative screening metric. Investors should look beyond the numbers to understand a company’s business model, revenue mix and industry dynamics in order to properly assess whether its valuation is justified.
Tilray Brands Inc. (TLRY) falls closely behind SNDL Inc. with a strong discount in its price-to-sales ratio relative to the pharmaceuticals industry. Tilray Brands offers similar products to SNDL Inc.’s but provides more diversified services, such as entertainment options. Tilray Brands’ sales have grown 4.1% year over year and 9.3% on average over the past three years, compared to the industry median sales growth of 8.3% and 5.5% for the respective periods. Understanding a firm’s sales growth relative to that of its industry is critical when deciding to invest in a company from the Price-to-Sales screen, as it enables you to formulate a big-picture layout.
Several biotechnology companies—such as Rigel Pharmaceuticals Inc. (RIGL), CareDx Inc. (CDNA) and Cue Biopharma Inc. (CUE)—are also included in the table. The biotechnology industry has an average price-to-sales ratio of 9.02 for the trailing 12 months, whereas those three companies’ price-to-sales ratios are 1.86, 2.93 and 3.39, respectively. Assessing the pulse of an industry helps the investor determine whether companies may truly be undervalued, or if the industry itself carries special consideration. In this case, the relatively high median price-to-sales ratio of the biotechnology industry implies that investors are willing to pay a higher multiple of sales for companies within the industry on the expectation of greater earnings. Understanding this implication helps drive investor awareness, as companies with lower ratios relative to their industry may have a better story to tell.
At the other end of the spectrum is energy solutions firm Tigo Energy Inc. (TYGO), which has a current price-to-sales ratio of 1.93. This is just slightly below the electrical equipment industry median of 2.33. Tigo Energy expanded its sales from $54.0 million in 2024 to $103.5 million in 2025, showcasing strong demand amid evolving industry competitors. Tigo Energy also boasts a gross profit margin of 43.7%, compared to the industry median of 28.0%.
Of the 30 companies in Table 2, biotechnology is the most represented industry with six companies. The software and healthcare equipment & services industries follow closely behind with five and four companies, respectively. Nine of the passing companies are the sole representative of their industry in the table. This includes industries such as household durables, machinery and chemicals, among others.
The Price-to-Sales screen identifies interesting companies with below-average price-to-sales ratios, sales growth that exceeds industry norms, reasonable levels of debt and above-average price performance relative to their respective industry medians. However, investors must view the companies passing this screen as only a starting point. The stocks passing this or any other quantitative screen do not represent a “buy” or “recommended” list.
AAII Stock Ideas

AAII Stock Ideas


ROBERT A from NC posted 3 months ago:
JOHN L from NJ posted 3 months ago:
You need to log in as a registered AAII user before commenting.
Log InCreate an account