



- Learn how the Model Shadow Stock Portfolio performed in August, including returns versus small- and micro-cap benchmarks
- Review the portfolio’s quarterly changes, including the acquisition-related deletion and two new stock additions
- Understand the strategy’s value, size and earnings criteria, and how they guide portfolio selections
After the quarterly review of the Model Shadow Stock Portfolio at the beginning of September, one stock was removed due to acquisition and two new stocks were added.
Market and Portfolio Performance
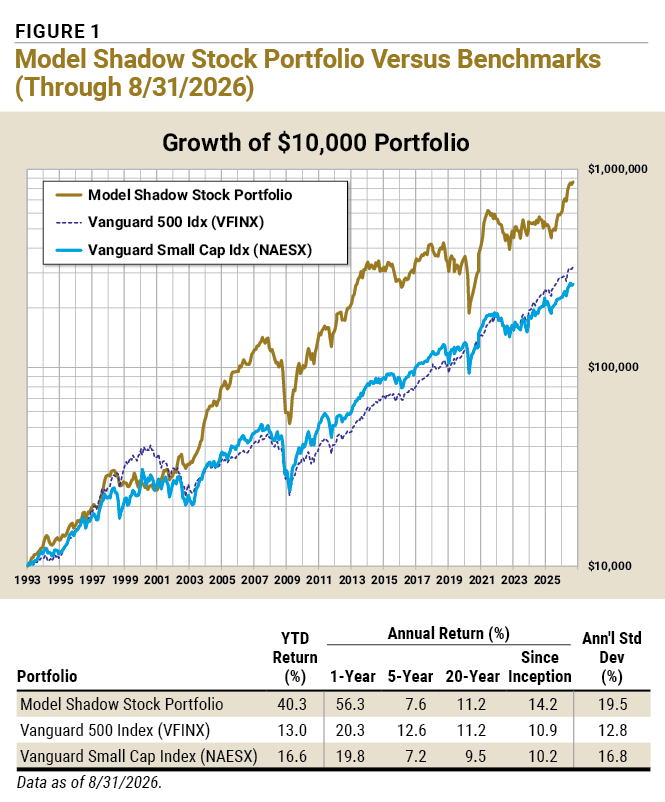
The Model Shadow Stock Portfolio gained 3.2% in August, increasing its year-to-date return to 40.3%. The portfolio outperformed Vanguard 500 Index fund  (VFINX), which gained 2.7% during the month, Vanguard Small Cap Index fund (NAESX), which rose 1.3%, and DFA U.S. Micro Cap fund (DFSCX), which declined 0.1%. The Model Shadow Stock Portfolio also remains well ahead of all three benchmarks year to date and over the trailing year; the portfolio has a one-year return of 56.3%, compared to one-year gains ranging from 19.8% to 26.6% for the benchmarks.
Since its inception in 1993, the AAII Model Shadow Stock Portfolio has a compound average annual return of 14.2%, versus Vanguard 500 Index’s average annual gain of 10.9% and Vanguard Small Cap Index’s average annual gain of 10.2% over the same period.
Figure 1 shows performance over a variety of time periods.
Weaker Environment for Small Stocks
Unlike earlier months of the year, August favored large-cap stocks. The S&P 500 index gained 2.7%, while the S&P MidCap 400 index edged up 0.2% and the S&P SmallCap 600 index declined 0.6%.
Market breadth reflected this weaker environment for smaller stocks, with declining issues outnumbering advancing issues among both mid- and small-cap companies. Despite August’s reversal, small-cap stocks remain the strongest size segment year to date, with the S&P SmallCap 600 up 20.8%, compared to gains of 14.7% for the S&P MidCap 400 and 13.1% for the S&P 500.
Model Portfolio Standouts
The Model Shadow Stock Portfolio’s 3.2% August gain was especially notable given the weaker performance of smaller companies. Strong gains from Amplify Energy Corp. (AMPY), Friedman Industries Inc. (FRD), Kolibri Global Energy Inc. (KGEI) and Mistras Group Inc. (MG) helped the portfolio overcome declines in several holdings and outperform its small- and micro-cap benchmarks.
Friedman Industries was the Model Shadow Stock Portfolio’s strongest performer in August, gaining 30.1% after reporting record quarterly sales and sharply higher earnings. Amplify Energy rose 25.8%, helped by improving production, favorable operating developments and strength in energy stocks. Mistras Group gained 23.3% after reporting strong growth in the infrastructure, power generation, and aerospace & defense markets. Kolibri Global advanced 16.2% after revenue more than doubled and production increased 46%. Castor Maritime Inc. (CTRM) rounded out the top five holdings with a 14.9% gain, as shipping rates remain high due to the continued Middle East conflict.
USANA Health Sciences Inc. (USNA) was the portfolio’s weakest performer in August, falling 35.5% after reporting lower sales and an adjusted quarterly loss. Smith Douglas Homes Corp. (SDHC) declined 18.5%, as weaker margins and earnings overshadowed growth in home closings and orders. Hudson Technologies Inc. (HDSN) fell 11.6%, as lower refrigerant pricing pressured margins and earnings despite higher sales volume.
Quarterly Portfolio Review and Deletion
The Model Shadow Stock Portfolio is reviewed quarterly to determine portfolio deletions and additions. The quarterly review cycle is tied to the reporting cycle of most firms and limits costly portfolio turnover. AAII’s stock analysis and screening service Stock Investor Pro, with data as of September 14, 2026, was used to determine the value and size break points for the quarterly review.
The primary Model Shadow Stock Portfolio selection criteria target the intersection of the smallest 10% of domestic stocks as measured by market capitalization, along with the “cheapest” 10% of domestic stocks as measured by the price-to-book-value (P/B) ratio.
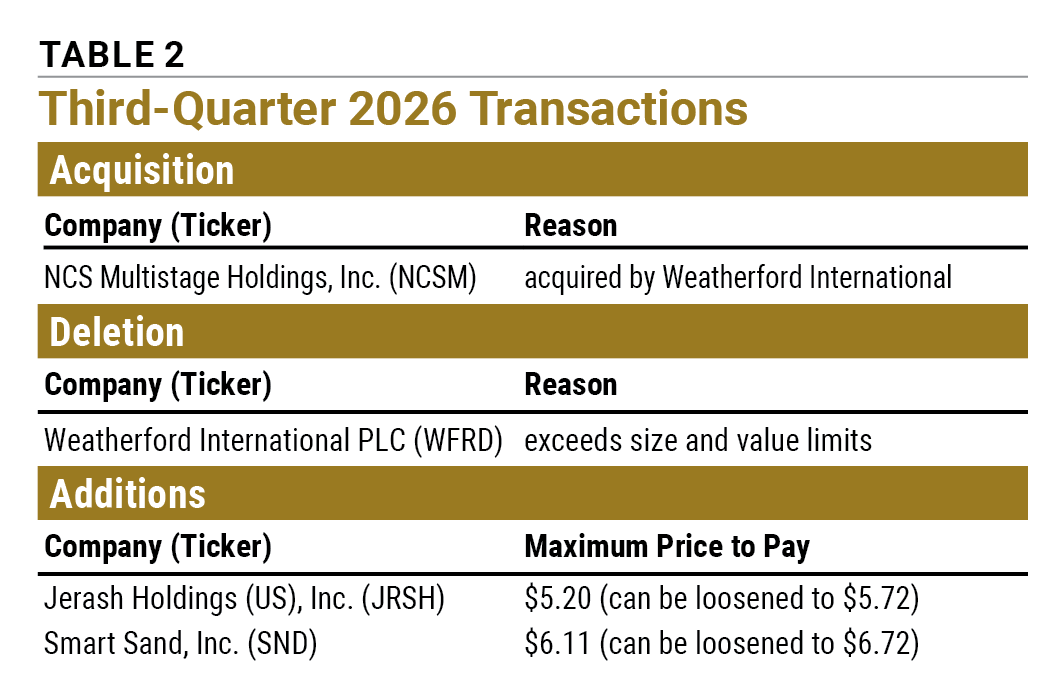
The current portfolio holdings are presented in Table 1, and a list of the changes is shown in Table 2.
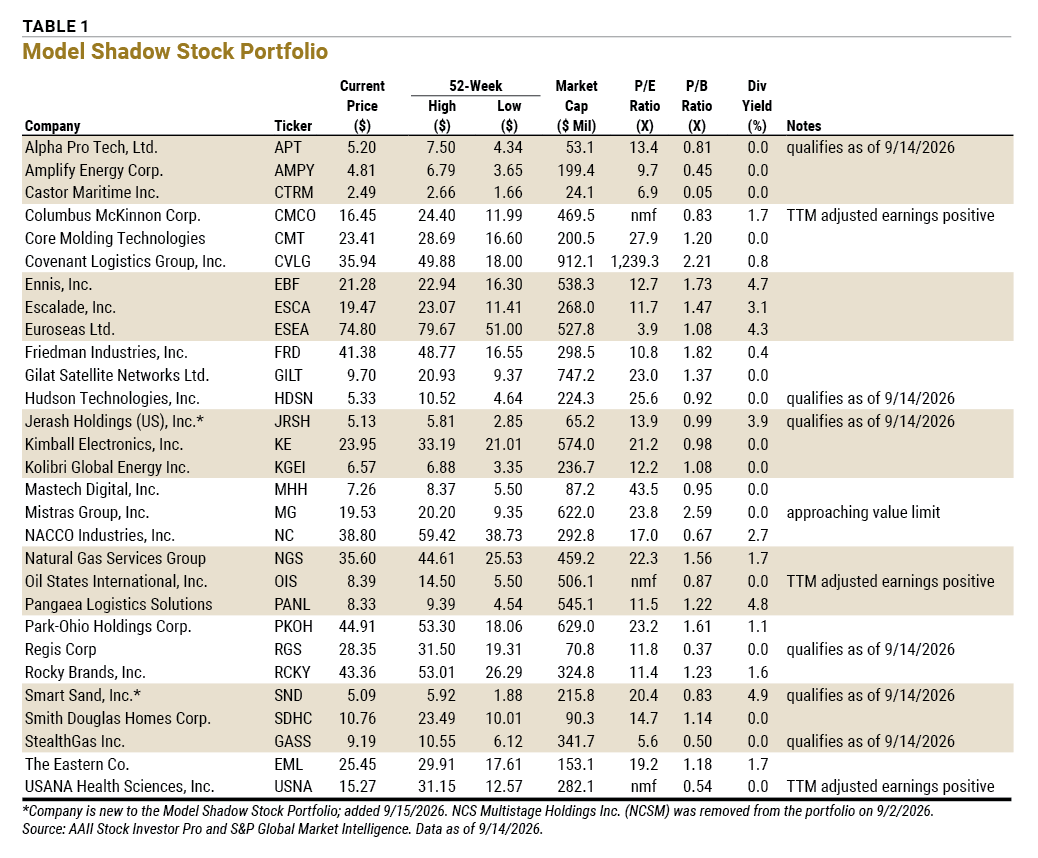
Approaching Size Limit: Stocks are sold if their market capitalization goes above three times the initial maximum criterion and there is a stock to replace it. The current market-cap maximum for initial screening is $400 million. Stocks are marked “approaching size limit” if their current market cap exceeds 2½ times the initial criterion, or $1.0 billion.
Approaching Value Limit: Stocks are sold once their price-to-book-value (P/B) ratio goes above three times the initial criterion and there is a stock to replace it. The current initial price-to-book ceiling is 1.00. Stocks are marked “approaching value limit” if their current price-to-book ratio exceeds 2½ times the initial criterion, or 2.50.
Earnings Probation: If the last 12 months’ earnings are negative, the stock is put on probation; if a subsequent quarter has negative earnings prior to 12-month earnings becoming positive, the stock is sold. When available, adjusted (non-GAAP) earnings are used to put stocks on probation or remove them. Otherwise, earnings from continuing operations are used. The date is the calendar quarter for which the company first reported negative trailing 12-month earnings.
Qualifies As Of: Stock still qualified as an addition when the screen was run with current data. Stocks that don’t currently qualify as an addition are held until they meet one of the deletion rules.
TTM Adjusted Earnings Positive: Trailing four-quarter GAAP earnings are negative, resulting in no meaningful figure for the price-earnings (P/E) ratio. However, adjusted earnings for the period are positive.
See the AAII Shadow Stocks area for more information.
Value
The price-to-book cutoff has increased slightly from 0.97 in June to 0.99. The cutoff was 0.92 one year ago. The current initial qualifying maximum price-to-book ratio is 1.00 and we left it unchanged. Qualifying stocks must have a price-to-book ratio of 1.00 or lower when added to the model portfolio. Stocks in the model portfolio are removed for valuation if they exceed three times the initial maximum price-to-book ratio at the time of a quarterly portfolio review.
Mistras Group had the highest price-to-book ratio among the portfolio holdings at 2.59, below the 3.00 maximum at the time of the review.
Size
We examined the market-cap levels of domestic companies listed on the New York Stock Exchange (NYSE) to determine the size cutoff for the lowest decile when adding stocks to the model portfolio. The lowest decile market-cap level decreased from $420 million in June to $407 million using data in Stock Investor Pro as of September 11, 2026. We maintained the maximum initial qualifying market-cap value at $400 million. Holdings are removed if their market cap goes above three times the initial criterion at the time of the quarterly review.
Covenant Logistics Group Inc. (CVLG) had the highest market cap in the portfolio at $912.1 million, below the $1.2 billion market-cap maximum at the time of review.
Earnings
If a company has trailing 12-month earnings from continuing operations that are negative, the stock is placed on probation. If a subsequent quarter has negative earnings before trailing 12-month earnings become positive, the stock is deleted. When available, normalized earnings are used to place stocks on probation or remove them.
No holdings were on earnings probation at the start of the quarterly reporting season, and no current holdings were placed on earnings probation during the quarter.
Acquisition
Portfolio Deletion: NCS Multistage Holdings Inc.
NCS Multistage Holdings Inc. (NCSM) was removed from the Model Shadow Stock Portfolio following the completion of its acquisition by Weatherford International PLC (WFRD). The transaction closed on September 1, and the portfolio’s NCS Multistage shares were exchanged for Weatherford International shares on September 2. As a merger consideration, NCS Multistage shareholders were entitled to receive a combination of Weatherford International shares and cash.
Weatherford International does not meet the Model Shadow Stock Portfolio’s market-cap size or price-to-book requirements, so the Weatherford International shares received in the transaction were removed rather than retained in the portfolio.
Quarterly Portfolio Additions
As of September 14, 27 stocks met the initial selection criteria for the Model Shadow Stock Portfolio. AAII members can see and research companies currently meeting the initial selection criteria in the Shadow Stock Ideas table. The list of new Shadow Stock Ideas is updated daily, Tuesday through Saturday.
Four of the 27 qualifying stocks were already in the Model Shadow Stock Portfolio at the time of the review. The remaining 23 stocks were examined for adequate liquidity, timely financial filings, and appropriate industry and foreign considerations. The Shadow Stock Portfolio Rules provide guidance on factors to consider when selecting stocks for your portfolio.
With the proceeds from the deletion, as well as the cash held in the portfolio, two holdings were added to the Model Shadow Stock Portfolio at position sizes just below the average position size. Jerash Holdings (US) Inc. (JRSH) and Smart Sand Inc. (SND) were selected for their attractive valuations, relatively strong financial positions and recent price performance.
Portfolio Addition: Jerash Holdings (US) Inc.
Jerash Holdings manufactures and exports custom, ready-made sportswear and outerwear for leading global brands and retailers, including VF Corp. (VFC)—which owns brands such as The North Face, Timberland and Vans—New Balance Athletics Inc., G-III Apparel Group Ltd. (GIII)—which licenses brands such as DKNY and Nautica—Acushnet Holdings Corp. (GOLF)—which owns the brand FootJoy—American Eagle Outfitters Inc. (AEO) and Skechers U.S.A. Inc. The company primarily manufactures its products at facilities in Jordan. Jerash Holdings was incorporated in 2016 and is based in Fairfield, New Jersey.
Jerash Holdings has a current book value of $5.20 per share. If you wish to stay within the 1.00 price-to-book maximum, you should pay no more than $5.20 per share. However, if the stock price has moved up after being added to the portfolio, you can still purchase the stock unless the price-to-book ratio goes above 1.10, which equates to a price of $5.72 per share.
Portfolio Addition: Smart Sand Inc.
Smart Sand is a fully integrated supplier of frac and industrial sand as well as related logistics services in the U.S. and Canada. The company provides mine-to-wellsite proppant solutions to oil and natural gas producers and oilfield service companies. Its sand segment produces and sells frac sand and industrial products, while its SmartSystems segment provides portable wellsite sand storage and management equipment and related services.
Smart Sand has a current book value of $6.11 per share. If you wish to stay within the 1.00 price-to-book maximum, you should pay no more than $6.11 per share. However, if the stock price has moved up after being added to the portfolio, you can still purchase the stock unless the price-to-book ratio goes above 1.10, which equates to a price of $6.72 per share.
Mistras Group to Be Acquired
Shortly after our quarterly portfolio review, Mistras Group Inc. (MG) announced that it entered into an agreement to be acquired by affiliates of H.I.G. Capital for $20.35 per share in cash. The transaction is expected to close in late 2026 or early 2027, subject to shareholder and regulatory approvals. As we went to press in late September, Mistras Group’s share price largely reflected the proposed cash acquisition price.
A 40-day period for considering alternative offers is in effect through October 27, 2026. We anticipate that Mistras Group will ultimately be removed from the Model Shadow Stock Portfolio after this period ends. A qualifying replacement candidate will be investigated and announced in the Model Shadow Stock Portfolio Update email.
Conclusion
The addition of Jerash Holdings and Smart Sand reflects the Model Shadow Stock Portfolio’s disciplined focus on smaller companies trading at low valuations. While individual holdings can experience significant price swings, the strategy seeks to maintain a diversified portfolio of qualifying stocks and relies on consistent application of its value, size and earnings rules rather than short-term market forecasts.
The next quarterly review of the Model Shadow Stock Portfolio will take place following the release of third-quarter 2026 earnings results at the beginning of December. If there are any changes to the model portfolio, they will be announced at that time. Sign up for the Model Shadow Stock Portfolio Update email to stay informed of any changes.

Related

AAII Stock Ideas
Tiny Titans Screen Targets Stocks That Institutions Miss
Related

AAII Stock Ideas
Stock Market Winners: Nine Rules to Identify the Next Outperformers
Discussion
FREE REPORT

No comments have been added yet. Add your thoughts to the discussion!
You need to log in as a registered AAII user before commenting.
Log InCreate an account