



- Learn how the Tiny Titans strategy identifies undervalued micro-cap stocks using market capitalization, the price-to-sales (P/S) ratio and momentum
- Understand why combining low valuations with strong price performance has historically generated returns that exceeded those of major market indexes
- Discover the benefits, risks and volatility of investing in micro-cap stocks, plus the importance of portfolio diversification and due diligence
AAII tracks several screens inspired by James O’Shaughnessy, who founded O’Shaughnessy Asset Management in 1993. The O’Shaughnessy screens that AAII has developed are based on the strategies outlined in his books “What Works on Wall Street” (Third Edition, 2005, McGraw-Hill) and “Predicting the Markets of Tomorrow” (2006, Penguin Group). It is from the latter book that the concept of the Tiny Titans approach was derived.
O’Shaughnessy notes that although many investors believe the market will return about 10% per year over the long term, the figure can be misleading as it does not take inflation into account, which can eat away at returns. O’Shaughnessy calculated the long-term inflation-adjusted average return to be about 7% per year and believes that the market will always revert to this mean. If the market has returned more than 7% per year over several years, it will spend the next years regressing back toward the average, often overshooting this mark and falling below it.
O’Shaughnessy presented the Tiny Titans screen for the more aggressive investor looking to increase their potential long-term rate of return. The strategy searches for cheap micro-cap stocks with upward price momentum. Micro-cap stocks have market capitalizations (share price times shares outstanding) smaller than those of the firms held by most small-cap funds.
O’Shaughnessy believes that there are many advantages to investing in micro-cap stocks. Few analysts cover these small stocks, leaving more upside potential when they are discovered. Additionally, micro-cap stocks have a low correlation with other market-cap strategies—especially large stocks in the S&P 500 index—providing additional portfolio diversification. However, these tiny stocks can be highly volatile and are best suited for investors who can handle the dramatic swings that a portfolio of these stocks can experience.
Screen Overview
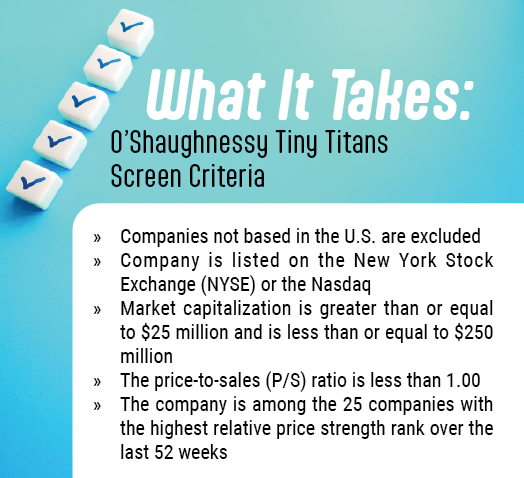
The AAII O’Shaughnessy Tiny Titans screen consists of very few criteria. First, all foreign stocks and over-the-counter stocks are eliminated to ensure proper liquidity as well as timely and comparable financial filings. Next, a stock’s market cap must be between $25 million and $250 million. By way of comparison, within the universe of exchange-listed stocks as of the end of July, the median market cap was $962.6 million and the average market cap was $19.9 billion.
After filtering out all but the smallest companies, the Tiny Titans screen looks for stocks with price-to-sales (P/S) ratios of less than 1.00. The price-to-sales ratio is the current price divided by the sales per share for the most recent 12 months. O’Shaughnessy uses this as a proxy for “cheapness,” as opposed to a price-earnings (P/E) ratio. He explains that all viable companies have sales, and sales are harder to manipulate than earnings. In “What Works on Wall Street,” O’Shaughnessy found that stocks with low price-to-sales ratios produced higher returns when used as a single value factor. As of August 7, 2026, a price-to-sales ratio of 1.00 ranked in the bottom 31% of all U.S.-listed stocks.
Finally, O’Shaughnessy thinks that investors should hold 25 stocks in this micro-cap portfolio to diversify the risk that goes along with holding more volatile stocks. He narrowed the list to 25 stocks by looking for the stocks with the strongest 52-week relative price strength rank. Relative strength or price momentum is often used as a signal that the market has recognized that a stock’s price is reacting to either proven performance or an increase in expectations. Investors look for stock price performance better than that of other stocks with the belief that the rising price will attract other investors, who will drive up the price even more. O’Shaughnessy found that stocks with the highest price changes over the past year tend to produce the highest returns in the following year. As of the end of July, the cutoff to make the Tiny Titans screen was a relative price strength rank of 80%, indicating price performance greater than 80% of all companies over the last 52 weeks. Note that the relative strength figures in Table 1 use the relative strength index, which compares a stock’s performance to that of the S&P 500.
Performance
For a stock investing strategy to be useful, it must be investable. This means that a quantitative approach should generate a large-enough universe of passing companies on which to perform additional due diligence to identify investment candidates. Since the Tiny Titans screen looks for the 25 companies with the highest relative price strength over the last year after applying the market cap and value filters, there are always passing companies.
Keep in mind, however, that there may be periods when the companies with the “best” relative price strength are still down over the last 52 weeks. The Tiny Titans methodology looks for those companies with the strongest price performance, but not necessarily a positive price change.
The average monthly price returns in 2026 for the stocks comprising the Tiny Titans screen’s hypothetical portfolio ranged from a loss of 9.4% in July to a gain of 11.9% in January. Looking back to 2025, the average monthly price change of the Tiny Titans passing stocks ranged from a loss of 15.9% in March to a substantial gain of 56.2% in November.
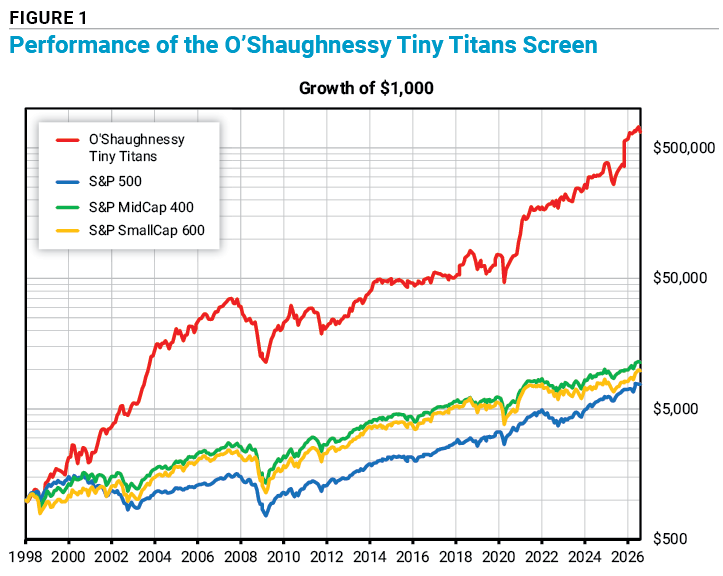
Despite, or perhaps because of, the volatility displayed by the Tiny Titans screen, it is worth noting that the long-term historical performance of the screen easily surpassed the common market benchmarks. As displayed in Figure 1, the Tiny Titans screen has outpaced both the small- and large-cap indexes over the observable period. Between January 1998 and the end of July 2026, the screen generated an annualized price gain of 25.5%, or a risk-adjusted gain of 17.8%, compared to an annualized gain of 7.4% for the S&P 500. Over the same period, the S&P MidCap 400 index generated an annualized gain of 8.8%, or a risk-adjusted gain of 8.6%, and the S&P SmallCap 600 index generated an annualized gain of 8.3%, or a risk-adjusted gain of 7.7%. As of July 31, 2026, the Tiny Titans screen is up 12.6% year to date, compared to 9.4% for the S&P 500, 13.7% for the S&P MidCap 400 and 20.5% for the S&P SmallCap 600.
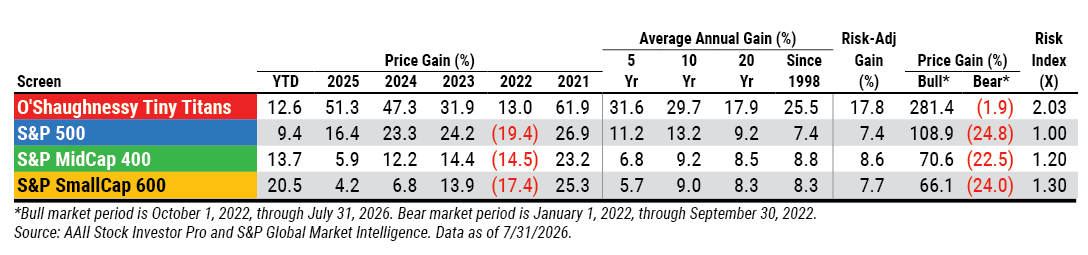
The Tiny Titans screen has delivered positive gains in 22 out of the observable 28 years of its testing. The screen carries a risk index of 2.03, indicating that it is approximately twice as volatile as the S&P 500.
Passing Companies
Table 2 presents the 25 companies passing the Tiny Titans screen as of July 31, 2026. Vince Holding Corp.  (VNCE) tops the list with a 52-week relative price strength rank of 99%, outperforming 99% of all stocks over the last year. Vince Holding offers clothing products and other accessories for men and women, which it sells via its branded stores, outlet stores and e-commerce platform. Vince Holding has a price-earnings ratio of 9.6, compared to the industry median of 21.5. A low price-earnings ratio can signal a higher level of risk being priced in, but it also shows an opportunity for upside if Vince Holding continues to outperform. Vince Holding’s price-to-sales ratio is 0.28, well below the 1.00 threshold that O’Shaughnessy labels as a requirement and determinant of “cheapness.”
Go to All Screens for an updated list of stocks passing this screen.
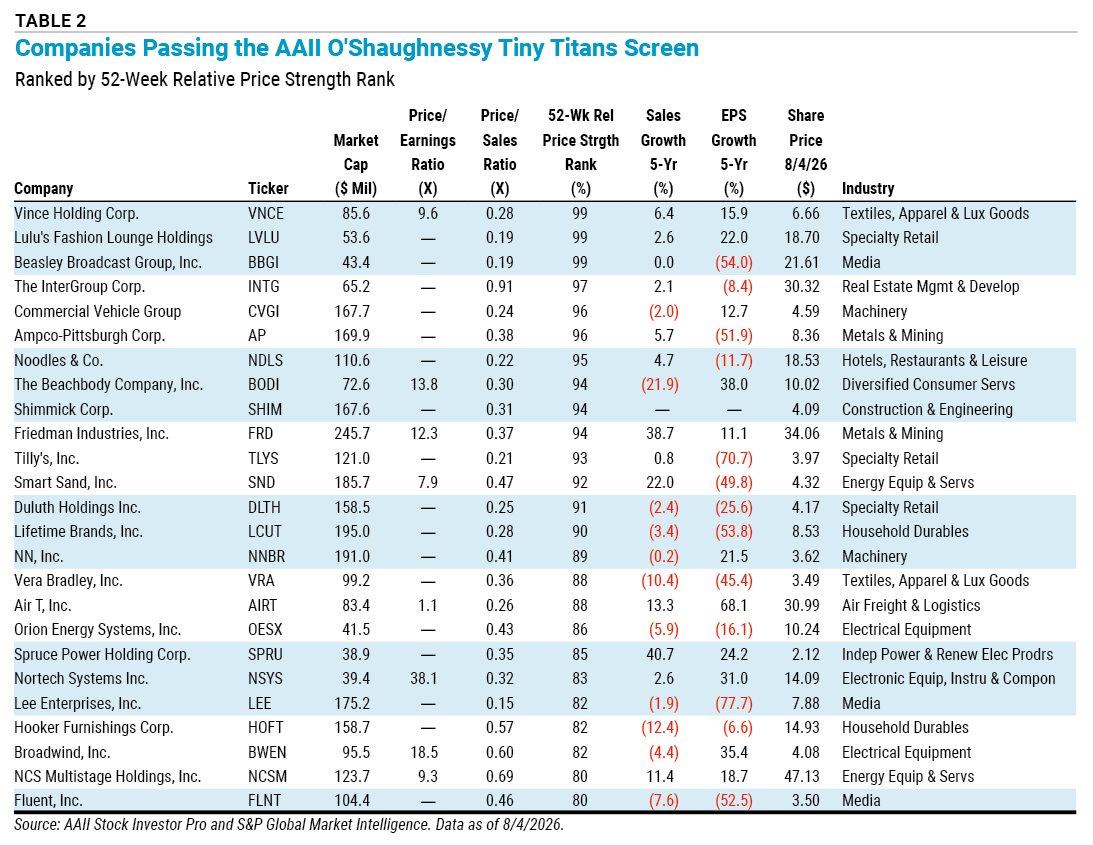
Coming in at the bottom of the passing companies list is Fluent Inc. (FLNT), a digital marketing services provider that specializes in digital marketing campaigns where the company connects its advertiser clients with consumers. Fluent lacks a price-earnings ratio, but its price-to-sales ratio of 0.46 is below the industry median of 0.80, suggesting that Fluent may be undervalued relative to its peers. However, Fluent’s sales decreased 18% over the past year and 16.7% annualized over the last three years. Although the Tiny Titans screen contains metrics that are meant to uncover cheap micro-caps, it is essential that all investors analyze the passing companies further to determine investment upside. Performing extra due diligence allows investors to grasp a more complete picture of each company rather than solely relying on the performance metrics used to generate the list of passing stocks.
Characteristics
Looking at the composition of the Tiny Titans list, 15 separate industries are represented among the present passing companies. Media and specialty retail lead the way with three companies each. Six industries have two companies each: electrical equipment, energy equipment and services, household durables, machinery, metals and mining, and textiles, apparel and luxury goods.
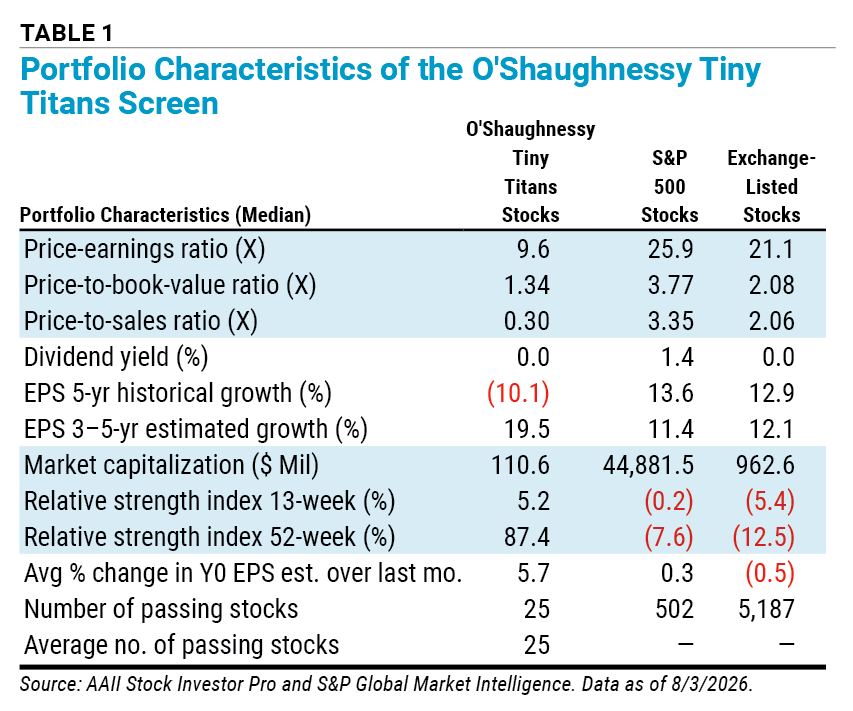
As of July 31, 2026, the Tiny Titans passing companies had a median price-earnings ratio of 9.6, compared to 25.9 for the S&P 500 and 21.1 for all exchange-listed stocks (Table 1). However, note that many of the companies currently passing the Tiny Titans screen are not profitable and do not have meaningful price-earnings ratios. The Tiny Titans companies have a median price-to-sales ratio of 0.30, compared to the S&P 500’s median price-to-sales ratio of 3.35. These statistics reinforce the nature of the Tiny Titans portfolio, where stocks are included based on traits that imply “cheapness,” as outlined by James O’Shaughnessy.
Another key statistic is market cap. The median market cap for the Tiny Titans portfolio is $110.6 million, compared to the S&P 500’s jarring median market cap of $44.9 billion. Once again, this demonstrates the extremely small size of the micro-cap companies that the screen searches for, identifying those that may have untapped potential due to their limited analyst coverage or inclusion among institutional investors.
Conclusion
O’Shaughnessy believes that investing in micro-cap stocks can improve performance. However, he does not recommend holding a portfolio made up of only one market-cap category. He recommends that conservative investors limit small- and micro-cap holdings to 25% of their overall portfolio; more aggressive investors can hold up to 35% of their portfolio in small- and micro-cap holdings.
Remember that the AAII Stock Screens are not lists of recommended stocks. The screens simply find stocks with similar quantifiable characteristics. It is important to perform additional due diligence on any company that passes a stock screen.

Related
AAII Stock Ideas
How to Buy and Sell Stocks Using AAII Stock Screens
Related

AAII Stock Ideas
What It Takes in 2025: Key Characteristics of AAII’s Top Screens
Discussion
FREE REPORT

Get your free copy of our special
report analyzing the tech stocks
most likely to outperform the
market.
ROBERT A from NC posted about 1 month ago:
BARRY J from TX posted about 1 month ago:
BARRY J from TX posted about 1 month ago:
Britt W from KS posted about 1 month ago:
You need to log in as a registered AAII user before commenting.
Log InCreate an account