


Related
AAII + BetterInvesting
The AAII Growth Investing strategy looks for consistent growth backed by financial strength in a stock.
by Sam Levine | October 2026

Growth investing presents unique challenges. Unlike value stocks, which investors can evaluate using readily available ratios for earnings and assets, growth stocks require us to look ahead and project whether companies’ profits are likely to grow at a fast-enough rate to justify their current stock prices or, better, be underpriced for their prospects.
Given the complexities of looking into the future, we can save quite a bit of time by screening for stocks that have financial characteristics associated with sustainable growth. From there, we can conduct more detailed analyses on those companies that pass our initial screen.
The AAII Growth Investing strategy uses two measures to evaluate stocks’ sustainable growth: AAII’s A+ Investor Growth Grade and Partha Mohanram’s G-Score. If they wish, investors may choose to use either or both of those measures in conjunction with their own investing approach; they may also incorporate those measures or their components into custom screens.
The Growth Grade seeks to answer the question of whether a stock has been growing consistently. The G-Score uses accounting-based measures to evaluate a company’s ability to outperform its peers, its earnings and sales variability, as well as whether the company is deploying resources in a way that supports future growth.
The Growth Grade is part of the A+ Investor stock grading system, a suite of stock evaluation tools that grades companies on five backtested factors: value, growth, momentum, earnings estimate revisions and quality. Grading these factors on an A through F scale makes it easy for you to understand what is making a stock an attractive investment and what could be reason for concern. The grades also help you quickly assess how a stock compares to the broader universe of all U.S. exchange-listed stocks based on your investing style.
Rapidly growing stocks generate headlines and investor excitement, but the valuations of those stocks often rise faster than the firms’ prospects warrant, leading to disappointment. Though many stocks over the years have enjoyed outsized growth for extended periods of time, investors should regard those stocks as exceptions rather than the rule. Some of the barriers that can put the brakes on growth include finite demand from customers, the law of diminishing returns, government intervention and competition.
Consider the market for personal computers. In the first quarter of 1978, $9.8 billion worth of personal computers were sold. That figure went up 125% to $22.1 billion by the close of 1980. It then took close to seven years for sales to increase by the same percentage. Today, the personal computer is considered a mature product. Buyers have fewer reasons to upgrade their desktops than they did in 1985, so, naturally, sales growth has slowed.
The law of diminishing returns also acts to limit growth. If hyper-growing companies want to maintain their growth rates—and they frequently do since their stock prices are often predicated on rapidly growing profits—they need to introduce new products or services. Incremental price increases or modest extensions of product lines simply won’t move the earnings needle enough.
Tesla Inc.  (TSLA) and its CEO Elon Musk appear to have a growth imperative hardwired in their DNA. Since Tesla brought out its first electric cars (EVs) in 2008, it has branched into other high-potential businesses as demand for its EVs matured.
Unfortunately, that approach toward perpetual growth introduces execution risks. Companies that deviate from their core competencies often underestimate the difficulty of competing in markets that are substantially different from their established areas of expertise. Shareholders often pay the price for manager hubris, whether directly through business write-downs or indirectly from lost opportunities. Meta Platforms Inc. (META) and Apple Inc. (AAPL) are examples of companies that are finding it difficult to move beyond their core businesses.
Meta Platforms CEO and founder Mark Zuckerberg spent $80 billion pursuing the creation of a virtual universe, called the metaverse, where people could interact as avatars. He promoted the metaverse as a convenient way for people to work, socialize and watch ads. However, potential corporate clients and consumers greeted the metaverse with bemusement, if they considered it at all. Very few people want to go to a simulated office looking like a cartoon character (myself excluded).
Even Apple, a holding in the Growth Investing model portfolio (and in my personal account) as of this September writing, has had its share of flubs over the years. Two specific examples are the Vision Pro augmented reality headset and the rumored fully autonomous car. The latter was a $10 billion project that Apple allegedly worked on for a decade, finally ending it in 2024.
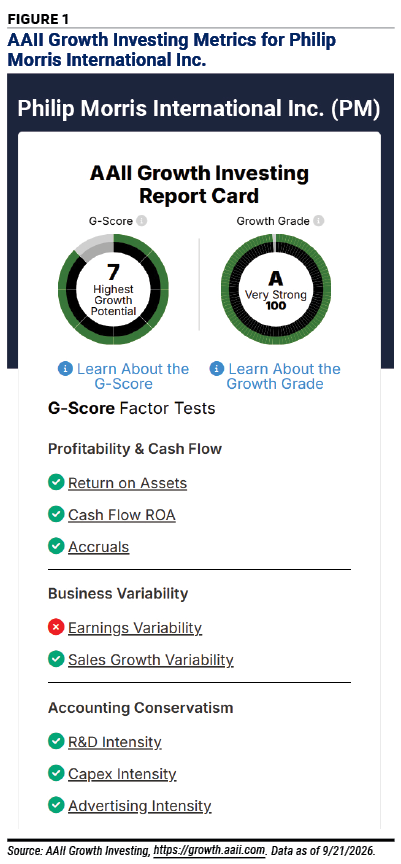
There are few better examples of sustainable growth than tobacco company Philip Morris International Inc. (PM). It sells products with very reliable demand that aren’t particularly sensitive to price increases. Putting aside the serious public health concerns, it pays to sell habit-forming products—even with the government intervention that tobacco product distributors have experienced over recent history. Figure 1 shows the Growth Investing report card for Philip Morris, found on the company’s Growth Analyzer page. (Growth Investing subscribers can access the Growth Analyzer by clicking on Tools from the main menu at the AAII Growth Investing website.) In addition to presenting Philip Morris’ Growth Grade and G-Score, the report card breaks down the metrics that go into both.
The Growth Grade puts the “slow and steady wins the race” mantra into a rigorous, quantitative framework. The underlying assumptions behind the Growth Grade are:
Like the fabled young lady evaluating purloined porridge, we want our growth to be neither too hot nor too cold.
The Growth Grade examines a company’s annualized sales growth, year-over-year sales growth and operating cash flow over the last five years. This three-component approach captures consistency, longer-term trends and actual cash generation.
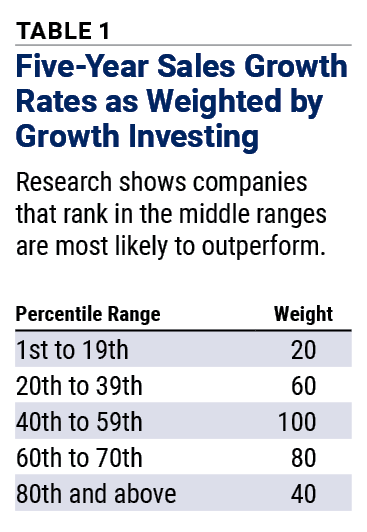
A weight is awarded to a company’s rank for five-year annualized sales growth according to how it compares to the rank of all U.S.-listed stocks. Weights are awarded according to the ranges outlined in Table 1, where the highest weightings are awarded for five-year sales growth ranking in the middle 60% of the stock universe. This identifies companies with a “just right” sustainable sales growth rate.
A score for year-over-year sales growth is given based on how many of the company’s past five individual years showed an increase in sales. Each year of positive sales growth is worth 20 points. A stock with five years of sales increases would receive a score of 100. A stock with four years of sales increases would receive a score of 80, and a stock that did not increase sales in any of the past five years would receive 0 points.
When it comes to measuring profit, cash is king in the Growth Grade rather than earnings. Analysts and many investors pay close attention to earnings reports, which measure the accounting profit of a firm. As important as accounting profit is, earnings are also subject to managerial assumptions such as future warranty claims and value changes of illiquid assets. Those assumptions can be adjusted by management to smooth earnings trends or even turn a negative quarter into a profitable one.
The Growth Grade uses cash flow from operations instead of earnings. Cash flow from operations is the cash generated from the company’s core business activities. It excludes cash raised from issuing stock or debt or other nonrecurring events. As with the sales growth component, 20 points are awarded for each year that cash flow from operations increased, up to a maximum of 100 points.
The three components of the Growth Grade are each assigned percentile ranks within the stock universe. The total of the three percentile ranks is also compared against the stock universe. Stocks with total scores ranking in the top 20% of the universe are awarded a Growth Grade of A, and those ranking among the bottom 20% receive a Growth Grade of F.
By emphasizing year-over-year sales increases and cash flow generation, the Growth Grade identifies companies that have demonstrated their ability to maintain growing revenues and profits—a far more reliable indicator than a single year of explosive growth rates.
A+ Investor and AAII Platinum subscribers can view a company’s Growth Grade on its Stock Evaluator page—accessible by typing a stock’s name or ticker symbol into the search box at the top of most AAII.com pages—and in the Custom Screener. For subscribers to Growth Investing, the site provides a detailed breakdown of the underlying components in the Growth Analyzer.
Mohanram developed the G-Score to separate stronger growth companies from weaker ones by using accounting-based signals drawn from profitability, earnings quality, stability and the degree to which companies invest in growth-supporting activities. Like the Growth Grade, the G-Score also uses factors other than accounting earnings to measure profit.
Mohanram found that glamour stocks with higher G-Scores outperformed growth stocks with lower G-Scores. Beyond finding winning growth stocks, Mohanram’s work revealed that investors should avoid growth stocks with low G-Scores, finding that low G-Scores coupled with high price-to-book ratios were good short candidates.
The G-Score operates like an eight-point growth stock checklist, with slightly different financial metrics and checks than used by the Growth Grade. It is also designed to help investors evaluate whether a company’s growth is sustainable, especially those companies with low book-to-market ratios.
The G-Score addresses a critical problem in growth analysis: Markets often project recent performance too far into the future. Mohanram’s model identifies companies with stable profitability and strong reinvestment in their businesses.
The G-Score evaluates eight financial metrics, each worth one point, for a maximum score of 8.
Profitability accounts for up to three points: one point for return on assets (ROA) above the company’s industry median, one point for a ratio of cash flow from operations to assets above the industry median and one point if cash flow from operations exceeds net income. This construction evaluates both earnings power and the quality of those earnings, distinguishing between accounting profits and actual cash generation.
Two measures discourage naively extrapolating past trends into the future. The first examines the volatility of earnings, which Mohanram defines as the variance of the return on assets over the past five years. Stocks with a lower variance of earnings than their industry’s median are awarded one point. The same calculation is then applied to sales growth. Companies with a lower variance of sales growth than their industry median receive one point.
Lastly, three measures evaluate whether the company is investing for the future. A company receives one point for capital expenditures (capex) as a percentage of assets that is higher than its industry median. It also receives one point for research and development (R&D) spending—again, as a percentage of assets—that is higher than its industry median and one point for advertising expenditures above its industry median.
Many companies do not break out advertising spending on their income statements, possibly to avoid providing that information to competitors. That’s understandable: PepsiCo Inc. (PEP) would certainly be interested to know the extent to which Coca-Cola Co. (KO) is ramping up its marketing.
Investors who choose to prioritize high G-Scores might start by searching for stocks with a G-Score of 7 or higher and, when it’s time to narrow down the screen results, check whether advertising intensity is the missing point. If it is, investors should check whether advertising appears in the company’s financial statement. Otherwise, the G-Score of 7 should be considered equivalent to a score of 8.
If a company does disclose how much it spends on advertising, then the missing point comes from spending less than its industry peers. In that case, the score of 7 should be accepted at face value.
While the Growth Grade and the G-Score both evaluate growth companies, they emphasize different characteristics of sustainable growth.
The Growth Grade focuses on the history and consistency of revenue expansion and cash flow generation. It directly addresses sustainability, asking whether the company can maintain its growth trajectory.
Mohanram’s G-Score takes a broader fundamental approach. Rather than examining growth directly, it assesses whether a company possesses the financial characteristics typical of growth stocks that outperform.
This distinction matters: Two companies might have identical revenue growth patterns but very different profitability, cash conversion and accounting quality. In AAII Growth Investing, the Growth Grade and G-Score complement each other.
The Growth Grade works well as both an initial filter and a check on currently held positions. It can help identify purchase candidates with demonstrated revenue consistency and positive operating cash flow. Once a stock is purchased, a declining Growth Grade can serve as a red flag that invites further analysis or action.
To be added to the Growth Investing model portfolio, a stock must have a Growth Grade of A. Once in the portfolio, a stock’s Growth Grade is allowed to fluctuate. Stocks are removed from the portfolio if their Growth Grade worsens to D or F.
The G-Score analyzes drivers of sales and cash flow growth. It examines whether the company’s profitability, cash flow characteristics and accounting conservatism suggest sustainable competitive advantages. To be added to the Growth Investing model portfolio, a stock must have a G-Score of 7 or 8. Stocks are removed from the portfolio if their G-Score falls below 5.
Used together, these two tools improve the odds of identifying growth stocks with the financial strength to justify their market valuations.
For investors seeking to move beyond headline-driven growth analysis toward evidence-based evaluation, the two measures offer a disciplined and efficient approach to assessing stocks’ potential for persistent growth. Investors should also research qualitative factors that drive market interest, such as product lines, management and competition.
AAII + BetterInvesting



No comments have been added yet. Add your thoughts to the discussion!
You need to log in as a registered AAII user before commenting.
Log InCreate an account