

Related

Behavioral Finance
10 small-cap investing lessons from 56 years of evidence.

Paul Merriman leads a class in AAII's new Essential Investing Video Course. Go to https://www.aaii.com/ves for more information and to subscribe.
 For more than 30 years, I have recommended that long-term investors consider including small-cap value stocks in their equity portfolios.
I have made that case before in the pages of the AAII Journal. I have shown the historical returns, discussed the academic research and acknowledged the risks. I have also personally invested according to many of the principles I have recommended. I have about 50% of my equities in small-cap stocks, with more than 50% of that in small-cap value.
But an investment idea that cannot withstand serious reconsideration isn’t worth very much. So, let’s ask the uncomfortable question: Is the small-cap value premium dead?
My answer is: I don’t know, and neither does anyone else.
Small-cap value stocks have gone through long periods of disappointing relative performance, including much of the recent past. But long periods of underperformance are hardly new.
The historical premium isn’t hypothetical. It happened. The future premium is entirely hypothetical. But so is the future return of the S&P 500 index.
Our job isn’t to know the unknowable. It is to examine the evidence, understand the risks and decide which uncertainties we are willing to accept.
In this article, I present 10 lessons drawn primarily from Table 1 (Table G1b on the Merriman Financial Education Foundation website), which compares the returns of the S&P 500 and U.S. small-cap value from 1970 through 2025. It also shows what happened when the two assets were combined in 10% increments.
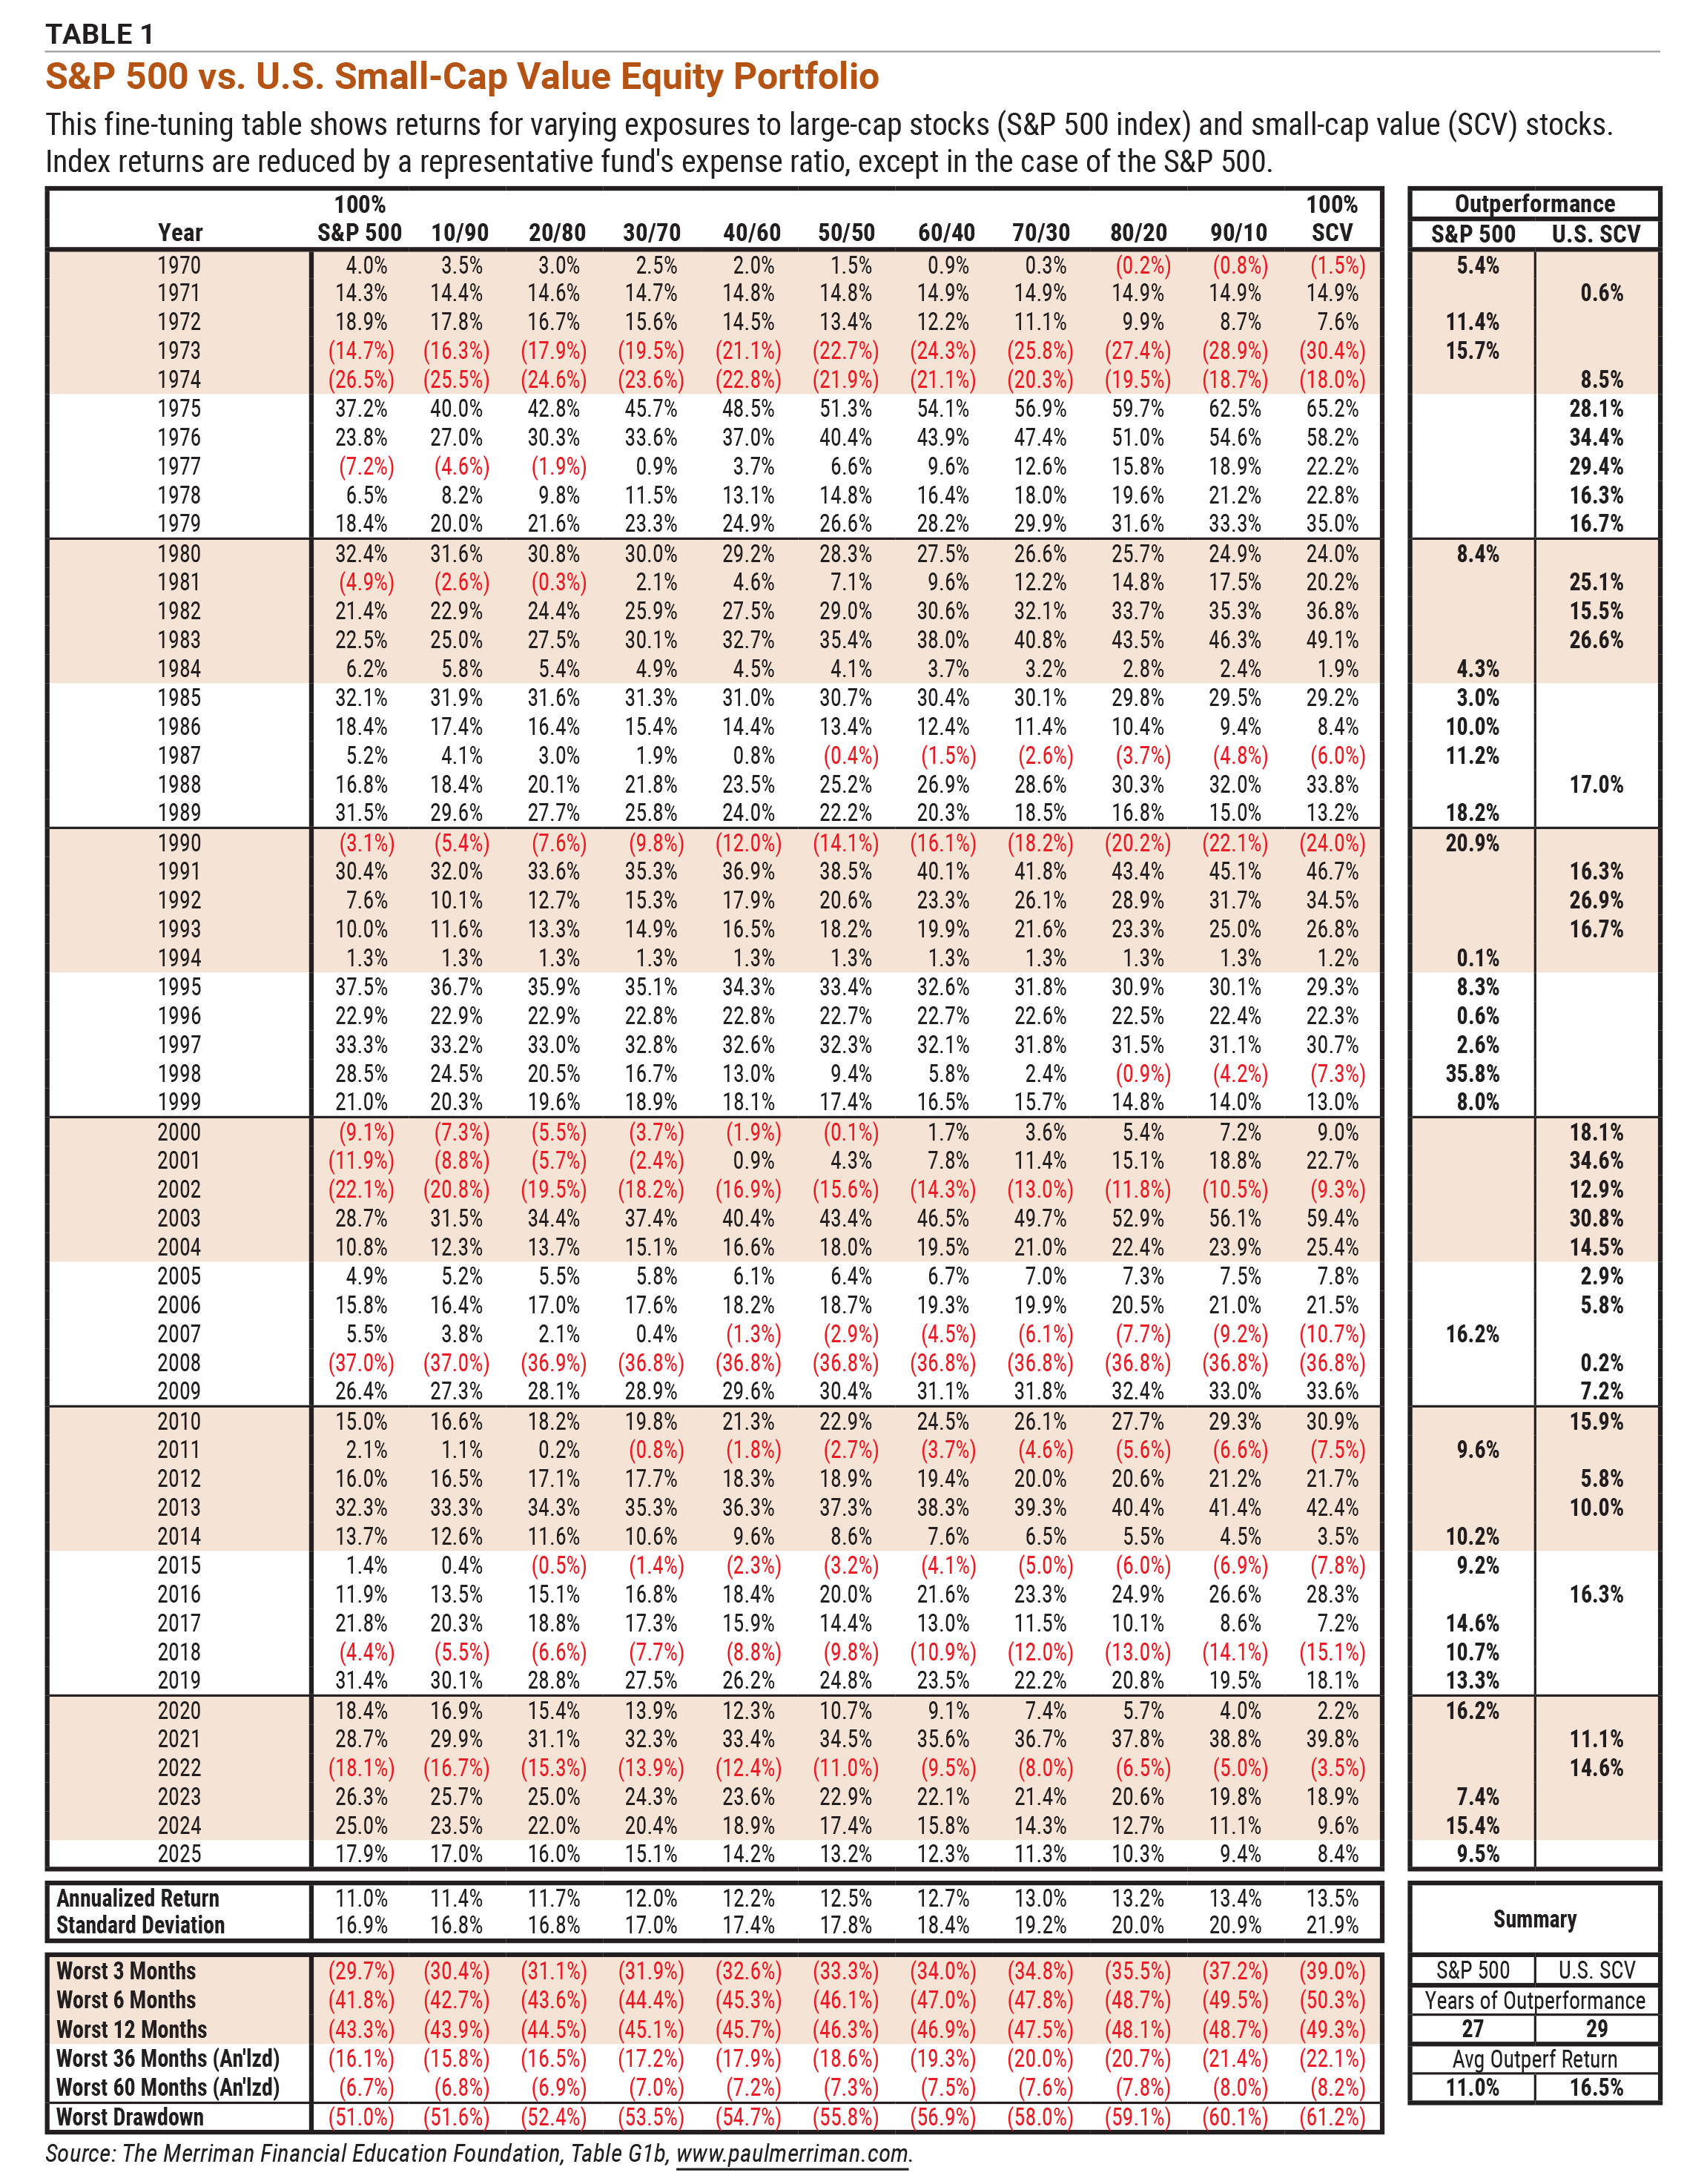
From 1928 through 2025, the S&P 500 compounded at approximately 10.2% annually, while U.S. small-cap value (SCV) compounded at approximately 13.1%. From 1970 through 2025, the period covered by Table 1, the returns were approximately 11.0% and 13.5%, respectively.
A difference of 2.5 or three percentage points doesn’t sound life-changing. But, compounded for decades, it certainly can be.
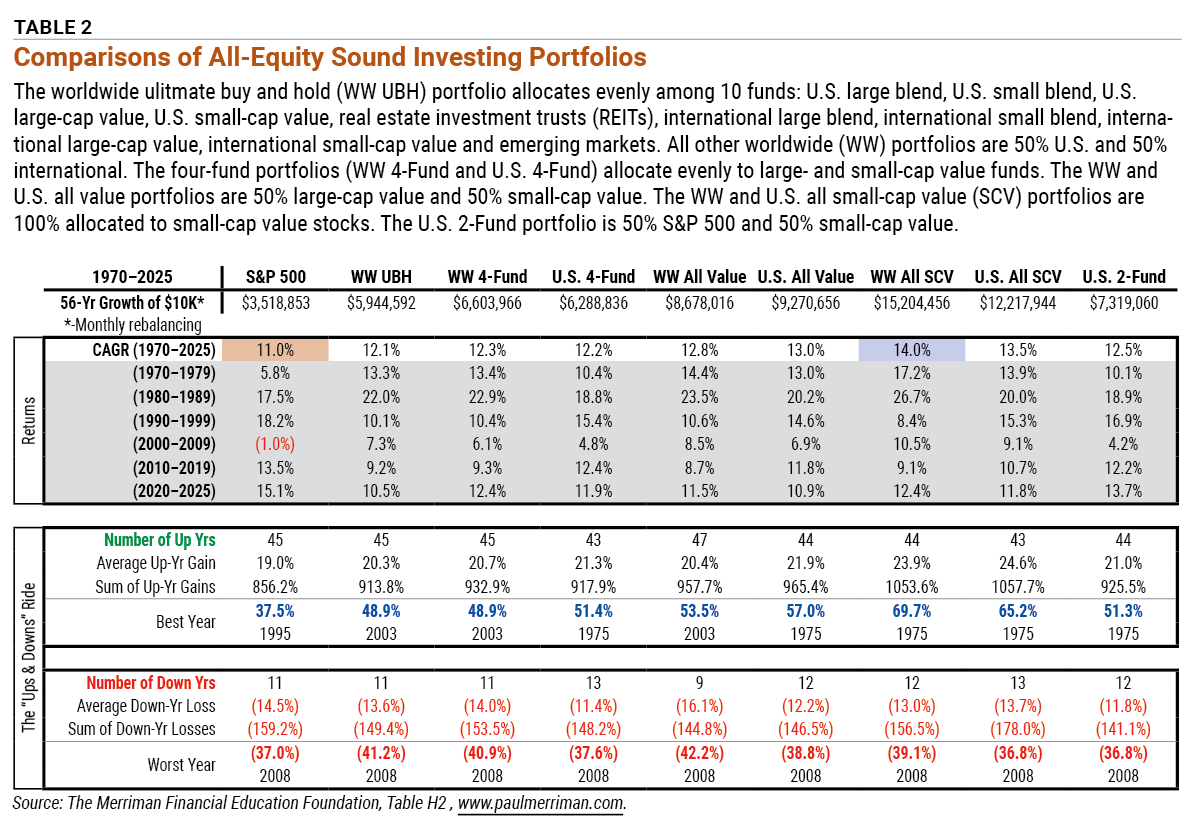
Table 2 (Table H2 on the Merriman Financial Education Foundation website) illustrates the point. A hypothetical $10,000 investment in the S&P 500 grew to approximately $3.5 million. That same investment in domestic small-cap value grew to approximately $12.2 million. A 50% S&P 500/50% small-cap value combination grew to approximately $7.3 million.
Nobody should interpret those numbers as a forecast. But we also shouldn’t dismiss what actually occurred as hypothetical.
The past return advantage happened. The uncertainty is whether anything resembling it will happen again.
Investment discussions have an unfortunate tendency to become arguments between extremes: Should I own the S&P 500 or small-cap value?
Table 1 asks a more useful question: What happens if I own both? It starts with a 100% investment in the S&P 500 and adds small-cap value investments in 10% increments: 90% S&P 500/10% small-cap value, 80% S&P 500/20% small-cap value, 70% S&P 500/30% small-cap value and so forth.
An investor doesn’t have to believe that small-cap value will beat the S&P 500 to consider a 10%, 20% or 30% allocation. Diversification is based on humility. We don’t know which investment will do better.
Each 10-percentage-point increase in small-cap value historically increased long-term returns by roughly one-quarter of one percentage point on average. At 30% invested in small-cap value and 70% in the S&P 500, the historical annualized return was about one percentage point higher than the return of the S&P 500 alone.
Suppose two investors each invest $10,000 for 50 years. At a 10% return, $10,000 grows to about $1.17 million. At an 11% return, $10,000 grows to about $1.85 million.
That’s almost $680,000 more from one additional percentage-point return, before considering additional contributions. Small numbers compounded for long periods stop being small numbers.
Higher expected return is meaningless if an investor cannot tolerate the risk required to earn it. That’s why Table 1 reports not only returns but the standard deviation; the worst 12-, 36- and 60-month returns; and the worst drawdown.
As the small-cap value investment was added, risk generally increased, but not as dramatically as the long-term wealth differences might suggest. The worst 12-month return progressed from –43.3% for 100% invested in the S&P 500 to –49.3% for 100% in small-cap value. The worst 60-month annualized return moved from –6.7% to –8.2%.
Those are serious losses. But the important lesson is what happens as we move across the table 10 percentage points at a time.
Instead of focusing on whether the annualized return was 11.0% or 13.5%, ask yourself how much additional small-cap value exposure you are willing to take for the potential benefits.
Look at the 1970s, then at 2000–2009, the decade containing the technology collapse and the Great Recession. Small-cap value provided important diversification during both periods.
Table 2 offers another perspective. Add together the performance during all losing calendar years, and the S&P 500 experienced a cumulative return of approximately –159.2%, versus a cumulative return –141.1% for the 50/50 combination of the S&P 500 and domestic small-cap value.
Meanwhile, over the entire 56-year period, $10,000 invested solely in the S&P 500 hypothetically grew to about $3.52 million. The same investment grew to $7.32 million in the 50/50 combination.
The future need not resemble the past, but this is an interesting historical combination of risk and reward.
One of the greatest risks in factor investing isn’t found in the standard deviation column. It’s us.
From 1970 through 1983, small-cap value beat the S&P 500 in 10 of the 14 years. Imagine an investor looking at those results in 1983 and deciding that small-cap value was obviously the place to be.
Then, from 1984 through 1999, the S&P 500 beat small-cap value in 12 of the 16 years. That investor might conclude: “I knew it. As soon as I bought it, it stopped working.”
I’ve talked with investors for more than 60 years. Some genuinely feel that whatever they buy is destined to go down—as though the market has been patiently waiting for their order to arrive.
Of course, it hasn’t. But behavioral finance isn’t about what is rational. It is about what human beings actually do.
After the S&P 500 dominated from 1984 through 1999, it would have been perfectly reasonable to wonder whether small-cap value had lost its advantage.
Then came 2000 through 2013. Small-cap value beat the S&P 500 in 12 of those 14 years.
From 2014 through 2025, the S&P 500 won in nine of the 12 years. Here we are again asking: Is small-cap value dead?
Research from Dimensional Fund Advisors provides useful context. Through 2024, small stocks beat large stocks in only 55% of one-year periods, while value beat growth in 59% of one-year periods. The frequency of outperformance increased as the measurement period lengthened.
A premium that appeared every year on schedule probably wouldn’t remain a premium for long.
Never buy small-cap value simply because small-cap value has been winning.
An investor who became convinced of small-cap value’s power after the 1970–1983 victories encountered 16 difficult years from 1984 to 1999. An investor who abandoned small-cap value in 1999 missed the reversal beginning in 2000. An investor who piled back in after 2000–2013 arrived just before another long period of S&P 500 leadership.
That’s performance chasing: Buy what has done well, become disappointed, sell it and buy the new winner.
My friend Rick Ferri, CFA, the investment adviser and author, argues that factor portfolios bring three costs: greater complexity, higher fund expenses and, most importantly, the danger that investors will abandon them during prolonged underperformance.
That last criticism deserves to be taken very seriously. If you cannot hold small-cap value while your neighbor’s S&P 500 portfolio beats your portfolio for five, 10 or perhaps 15 years, you probably shouldn’t own much small-cap value.
The expected premium is worthless to the investor who isn’t there to receive it.
Suppose an investor began by investing $10,000—$5,000 in the S&P 500 and $5,000 in small-cap value—and never rebalanced.
Using the ending values in Table 2, the S&P 500 investment would have grown to approximately $1.76 million and the small-cap value investment would have grown to approximately $6.11 million. That’s about $7.87 million total. The annually rebalanced 50/50 portfolio finished at approximately $7.32 million.
The investor who did less work ended with roughly $550,000 more. Why? Because small-cap value was the stronger performer, and rebalancing repeatedly sold some of the eventual winner.
But investors in 1970 couldn’t know which asset class would dominate. Neither do we today. Rebalancing is primarily risk management, not a guarantee of higher returns.
Implementation has improved.
The original academic definitions were extraordinarily useful, but managers today can go beyond simply buying every company that fits into a small-cap and/or value box.
Dimensional Fund Advisors’ U.S. small-cap value approach emphasizes companies with low relative prices while also considering characteristics including profitability and asset growth. Other systematic managers, including Avantis, have developed approaches incorporating size, value, profitability, trading costs and implementation.
None of this guarantees a premium. But investors should distinguish between two questions:
These aren’t the same question.
There are legitimate reasons to wonder.
A 2026 academic paper examining the traditional value factor identified by Nobel laureate Eugene Fama and Darthmouth College professor Kenneth French found that value’s performance after 2007 was dramatically worse than its long-term pre-2008 record.
Additionally, Dimensional Fund Advisors has noted that in 2024, the trailing 20-year relative return of U.S. small-cap value versus the S&P 500 turned negative for the first time in its historical dataset. The firm also identified earlier extended periods when the trailing small-cap premium became unusually weak before subsequently reversing.
Previous recoveries don’t prove that small-cap value will recover again. Otherwise, we create an investment belief that can never be proven wrong. That’s not analysis. That’s faith.
The small-cap premium could be smaller going forward. It could disappear. It could also return dramatically. We don’t know.
I don’t think everybody should put 50% of their equity portfolio in small-cap value, nor do I think we should dismiss nearly a century of evidence because the S&P 500 has dominated much of the recent past.
Instead, look at Table 1. Start with the 100% investment in the S&P 500 and move across the table. What happened historically when a 10% investment in small-cap value was added? Then 20%? Then 30%?
Look at the additional return. Then, look at the worst 12-, 36- and 60-month returns and the worst drawdown. Then, ask a better question than whether small-cap value is dead. Ask yourself how much small-cap value you could own—and continue owning—if it underperformed the S&P 500 for the next 10 or 15 years.
For some investors, the answer may be 0%. A low-cost S&P 500 or total-market index fund held for a lifetime is an extraordinary strategy. For others, the answer might be 10%, 20% or 30% in small-cap value. For an investor with a very long horizon, substantial risk tolerance and strong conviction in the evidence, the allocation could be even larger.
The best portfolio isn’t necessarily the one producing the highest return on a spreadsheet. It’s the one whose risks you understand well enough to continue holding when the evidence temporarily seems to prove you wrong.
So, my case for small-cap value isn’t that it is guaranteed to outperform. It isn’t. Rather, my case is that the historical evidence is substantial, the diversification benefit has been meaningful, relatively modest allocations to small-cap stocks historically improved long-term portfolio returns, and modern funds make implementation easier and less expensive.
Against those potential benefits of small-cap value are higher expenses, tracking error, additional complexity and an enormous behavioral challenge.
Make that trade-off before you know which asset class will win the next decade. Because if you wait until the winner becomes obvious, history suggests you may simply be arriving in time to be misappropriately allocated for the next surprise.
Behavioral Finance

Portfolio Strategies


ROBERT A from NC posted 23 days ago:
Paul M from FL posted 17 days ago:
Paul M from FL posted 17 days ago:
Paul M from FL posted 17 days ago:
KEVIN V from NC posted 10 days ago:
ED W from DE posted 10 days ago:
You need to log in as a registered AAII user before commenting.
Log InCreate an account