

Related

Financial Statements
The first in a new series designed to deepen your knowledge of the key stock valuation ratios.

Charles Rotblut leads a class in AAII's new Essential Investing Video Course. Go to https://www.aaii.com/ves for more information and to subscribe.
The key to successful investing is to buy a stock for less than what it will be worth to you over time—in terms of both the price another investor will pay in the future and the cash returned to you along the way. This concept holds true regardless of the type of investing strategy followed: value, growth, technical analysis, etc.
Determining whether a stock is attractively priced starts with looking at its valuation. Valuation compares a stock’s price to its fundamental metrics. It provides context to the price. This context is critical because a stock trading at $10 can be very expensive while a stock trading at $100 can be cheap. An understanding of valuation ratios (aka multiples) allows you to make this determination.
Valuation can be based on a company’s earnings, enterprise value, yield or other metrics. In this article, I discuss the valuation ratios we at AAII consider.
This article is the first in a new series designed to deepen your knowledge of the key valuation ratios. You will learn what each ratio considers, how to judge whether levels are high or low, and how to use them to find and evaluate stocks.
This series builds upon our financial statement analysis series, including the September 2025 AAII Journal article “How Financial Statements Drive Stock Valuation Ratios.” As I explained in that article, valuation ratios use information from the income statement, balance sheet and cash flow statement to determine a stock’s worth. Combining the ability to analyze financial statements with a thorough understanding of valuation ratios will make you a more informed investor.
Most of the valuation ratios shown in Table 1 consist of two elements: stock price and a number from the financial statements. Changes in either determine whether the valuation ratio rises, falls or becomes nonmeaningful. Nonmeaningful valuation ratios may be designated with NA (not applicable), nmf (no meaningful figure) or a dash on AAII.com.
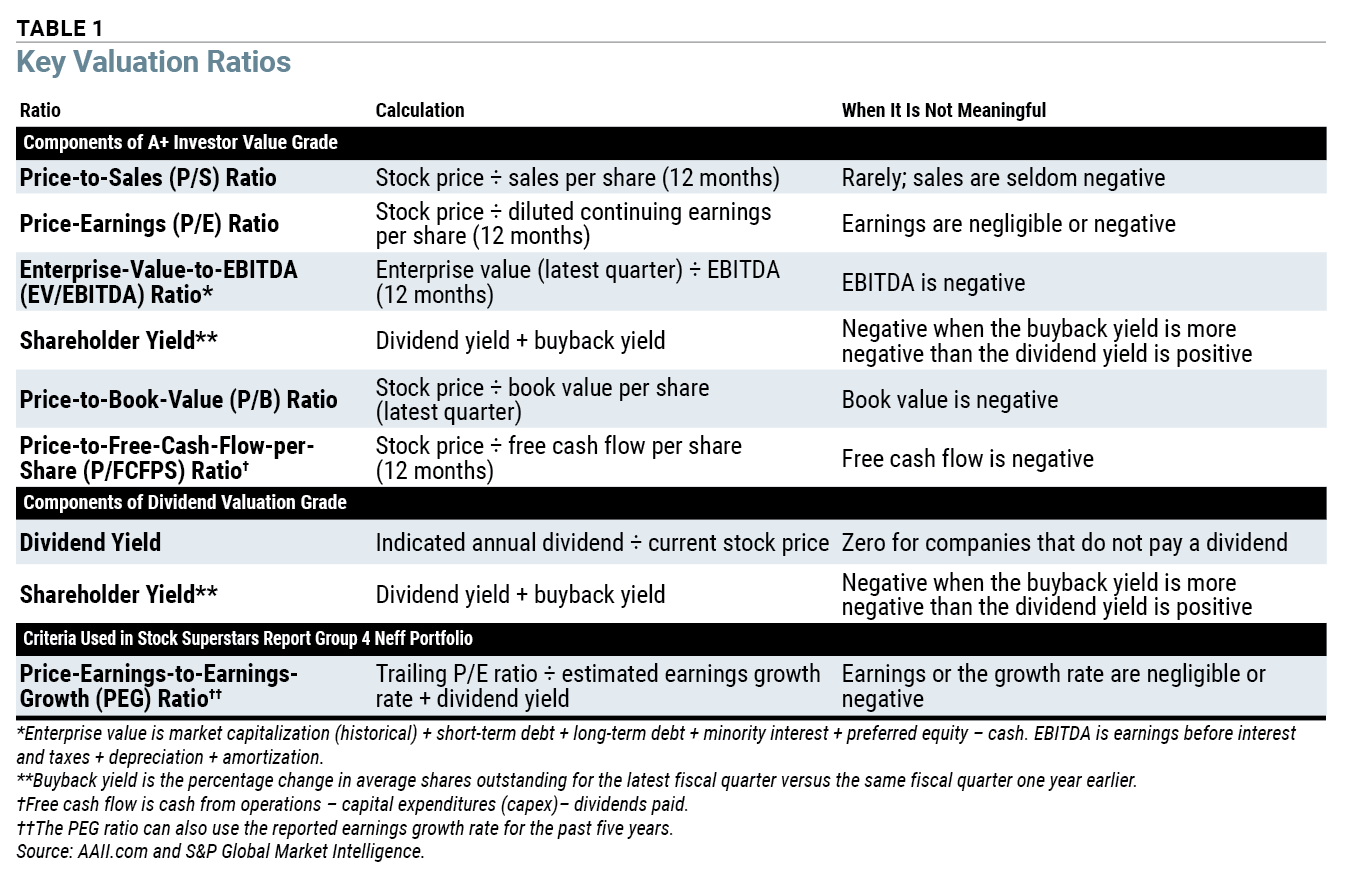
A company’s share price will always be the most volatile and most frequently updated part of its valuation. The fundamental indicators that the ratio is based on are updated once per quarter. They can evolve gradually or change significantly depending on how the business has performed and what decisions the company’s management makes.
Though similar math is used to calculate each ratio, what the ratios measure differs.
We will explain each of these ratios in greater detail throughout this series. Right now, it is important to understand that they are all tied to price (either fully or partially) and all measure valuation in a different manner.
Valuation ratios can be viewed through either an absolute or a relative lens. There are advantages and disadvantages to both approaches.
Consider a price-earnings ratio of 13.0, for example. As of mid-September, this was the highest price-earnings ratio of all the stocks that passed the AAII Graham Enterprising Investor Revised screen on August 31. Most investors would consider stocks trading with such a price-earnings ratio to be cheap on an absolute basis.
Investors who use absolute valuations set a limit on the valuation ratio they will use. Such investors may insist on a price-earnings ratio no higher than 12.0, 15.0 or 20.0. A price-to-sales ratio no higher than 1.00 or a price-to-book ratio no higher than 3.00 might be desired in combination with or instead of a target price-earnings ratio.
Absolute valuations are simple to use and understand. A stock is either attractively valued or it isn’t. A big downside of absolute valuations is that they do not adjust to changing market conditions. When market valuations rise, fewer stocks will pass stock screens or filters that use absolute valuations. Additionally, absolute valuations can eliminate stocks in industry groups or sectors with high average valuations from consideration. Both downsides reduce the number of potential candidates and leave your portfolio less diversified.
Relative valuations, on the other hand, use a benchmark to determine what is cheap and what is expensive. The AAII Model Shadow Stock Portfolio requires candidates to have price-to-book ratios that rank in the approximate lowest 10% of stocks listed on the New York Stock Exchange (NYSE). This percentage is based on research from Nobel laureate Eugene Fama and Dartmouth College professor Kenneth French. Their research showed a return advantage to owning stocks in the cheapest valuation rank that also have market caps ranking in the smallest 10% of all companies.
Other investors may seek stocks whose valuation ratios are below those of their industry or sector peers.
These types of relative valuations adjust for market conditions. By using them, you will always be able to find investment candidates. The downside is that the relative valuations for ratios like the price-to-book ratio will be higher when the market has experienced a lengthy upward rally. This can cause you to pay a premium because the market itself has become expensive.
Relative valuations can also be tied to a company or sector’s benchmark. The AAII Dividend Investing (DI) model portfolio seeks out stocks whose current yields are above their five-year average yields. Since yield and valuation are inversely related, high yields signal a cheaper valuation. These comparisons can also be made using other valuation ratios, such as a price-earnings ratio.
Most quantitative models—including those underlying well-followed indexes such as the S&P 500 Value index—use relative valuations in some fashion. Most AAII Stock Screens with value criteria also incorporate relative valuations. As a middle ground, you can look at relative valuations to periodically adjust the absolute valuations that you use to manage your portfolio.
While both absolute and relative approaches can identify stocks trading at cheap or expensive valuations, neither measure by itself can tell you whether a stock is a bargain. A stock is a bargain if it is trading at a valuation below what its underlying fundamentals and business prospects would suggest.
For instance, the Graham Enterprising Investor Revised screen mentioned previously requires companies to be profitable, intend to pay a dividend over the next 12 months and not have excessive debt. AAII’s model portfolios, including the Model Shadow Stock Portfolio, also require companies to be profitable. This helps to eliminate companies with risky business models.
Companies that struggle to remain profitable, have high levels of debt or have recently suspended their dividends will also often trade with low valuation ratios. The low valuations assigned to them reflect the market’s perception of increased risk. (These companies can have a combination of low, high and nonmeaningful valuation ratios if their earnings, book value or cash flow are very small or negative.)
You can determine whether a stock with a low valuation is a bargain or merely cheap by reviewing its financial statement data and its financial ratios—such as ratios that measure activity, liquidity, profitability and solvency. Among the traits to look at are cash flow from operations (should be positive), the current ratio (should be above 1.0), interest coverage (should be well above 1.0) and operating profit margins (should be positive and not significantly declining).
High valuation ratios are frequently assigned to companies with strong growth prospects or strong business characteristics. Investors are often willing to pay a premium relative to current earnings if they expect future earnings to be much higher. Network effects and recurring income streams are also associated with higher valuations.
It is equally important to look at the financial statement data and financial ratios for stocks with high valuation ratios to ensure they are fiscally sound.
Using a single valuation ratio simplifies decision-making. It allows you to set just a few buy and sell rules.
There should be a defensible reason for why you chose to use just one valuation ratio, and for why you chose that specific ratio. The Model Shadow Stock Portfolio solely uses the price-to-book ratio because the approach is based on the Fama-French research, as explained above. In developing their three-factor model to explain stock returns, Fama and French used the book-to-market ratio—which is essentially the inverse of the price-to-book ratio—for the value component. The other two factors were size and excess market return.
Incorporating additional valuation ratios can provide useful context. The Dividend Valuation Grade used by the DI strategy equally weights the relative dividend yield and the shareholder yield. The relative dividend yield compares a stock’s current dividend yield to its five-year average yield. (A current yield above the five-year average yield is undervalued, while a current yield below the five-year average yield is overvalued.) The shareholder yield shows the percentage of total cash the company is paying directly to shareholders via dividends and indirectly by repurchasing shares.
The A+ Investor Value Grade goes further by considering six valuation ratios: price-to-sales, price-earnings, enterprise-value-to-EBITDA, shareholder yield, price-to-book and price-to-free-cash-flow. This allows the grade to apply to a broader universe of stocks. It facilitates comparisons between sectors and industries. It also reduces the impact of factors that might alter a single valuation ratio, such as a quarter with depressed earnings that inflates the price-earnings ratio.
There is another advantage to using several valuation ratios instead of just one: nonmeaningful values. Negligible sales, or negative or negligible earnings, EBITDA or book value, will result in values that are not meaningful for the ratios that use them.
An unprofitable company can still be valued by other ratios. A company with a negative book value can still be measured on sales, earnings, free cash flow and shareholder yield.
We will start taking a closer look at the individual valuation ratios next month. The November 2026 AAII Journal will focus on the most widely used valuation ratio: the price-earnings ratio. Other valuation ratios will be the subject of upcoming articles starting next year.
Financial Statements

Financial Statements


No comments have been added yet. Add your thoughts to the discussion!
You need to log in as a registered AAII user before commenting.
Log InCreate an account