


Related

First Cut Stocks
In addition to evaluating whether a stock is rising or falling, momentum also measures the movement’s strength.
by Sam Levine | October 2026

In investing, momentum is the rate of change in an asset’s price over a defined time. In addition to evaluating whether an asset, such as a stock, is rising or falling, momentum also measures the movement’s relative strength. A stock that has moved up 10% in two weeks is described as having stronger momentum than one that has climbed the same amount over three months. Likewise, a stock that is declining at a faster rate can have strong downward (bearish) momentum.
The underlying assumption of momentum analysis is that stock prices follow trends. Stocks displaying strong momentum are presumed more likely to continue trending in that direction than stocks with weak momentum. That might appear to be a questionable extension of Newton’s first law of motion, which states that a moving object will continue moving until an external force counters it. However, momentum in terms of investing is backed by academic studies.
Academics consider the predictive value of momentum to be an anomaly to efficient markets. If markets are informationally efficient, investors should not be able to profit from readily available historical price data, which is the basis for calculating momentum. Other efficient market anomalies include size (small-cap stocks outperform large-cap stocks), value and earnings surprises.
Momentum may persist for several reasons. The market may underprice news initially. Investors may feel the fear of missing out. Institutional investors may need time to acquire appropriately large positions without disrupting the market.
There are many ways to measure stock price momentum. While some may simply look at a stock’s price change on an absolute basis—for example, observing that Nvidia Corp.  (NVDA) is up 19.5% year to date—momentum is commonly based on a comparison. A stock’s price action can be compared to its prior trading history to identify a strengthening or weakening trend, or it can be compared to the trading history of another security or an index.
The A+ Investor Momentum Grade and Score compare a stock’s quarterly rate of change to that of all U.S.-listed stocks for each of the last four quarters (91-day rolling periods). The rate of change is simply the price change over a given period. All stocks in the universe are assigned relative strength scores for each quarter, and those scores are updated overnight following each trading day. The most recent quarter’s momentum accounts for 40% of the Momentum Score, and the prior three quarters contribute 20% each.
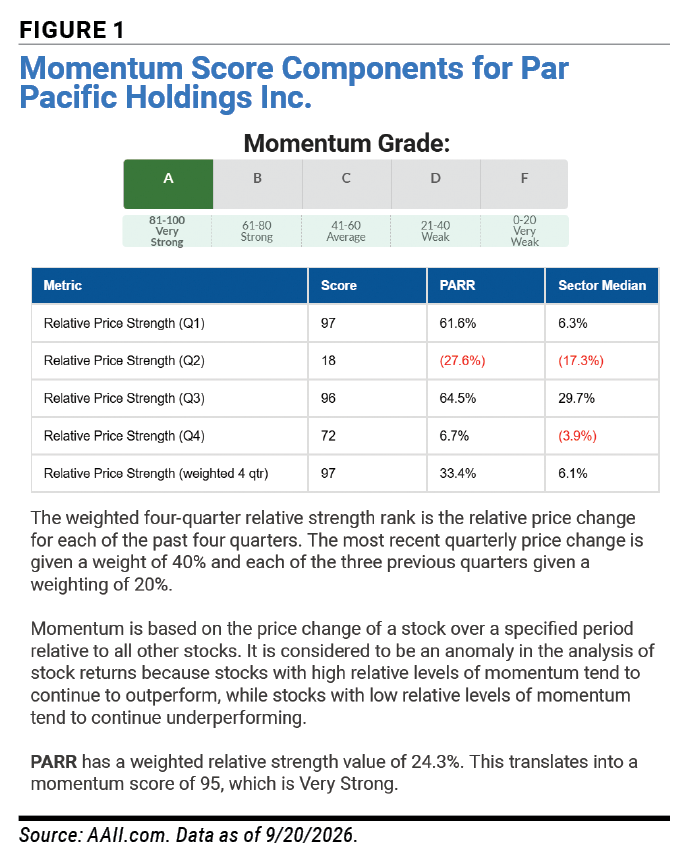
The weighted relative strength for all four quarters—again, with the most recent quarter’s performance carrying twice the weight of the other quarters—is ranked against that of all other U.S.-listed stocks. The stock’s Momentum Score is its percentile rank. Those percentile ranks are divided into five quintiles, with the strongest (best-performing) 20% of stocks receiving a Momentum Grade of A and the bottom (weakest-performing) 20% receiving a Momentum Grade of F. Figure 1 shows a September 20, 2026, screenshot of the Momentum Score components for Par Pacific Holdings Inc. (PARR) from its AAII Stock Evaluator page. Par Pacific is held in AAII’s VMQ Stocks model portfolio and has been a beneficiary of the recent rise in energy prices.
Measuring momentum on a weighted four-quarter basis is associated with higher portfolio returns than simply looking at relative returns over the past 52 weeks. It also works better than using the most recent 13- or 26-week periods to measure returns.
In unusual market environments, stocks exhibiting strong momentum could have small gains or even losses, depending on the period measured. A key characteristic of momentum is that it measures relative performance: It considers how one stock (or other asset) performed against the benchmark. If most stocks have losses, then the stocks with the smallest losses are the ones with the strongest momentum.
This aligns with AAII’s recommendation to stay fully invested and avoid timing the market. There are always stocks with attractive traits in any market environment. Stocks exhibiting strong momentum are expected to perform better than those with weak momentum.
Technical analysts routinely use momentum indicators, often looking to rising trading volume to confirm strong momentum or weakening volume to identify potential turning points. Fundamentals-oriented investors can use momentum as a check on their investment theses.
Growth investors might use weakening momentum as an indication that the market is becoming less enamored with a stock’s prospects or as a red flag that invites further research. Strengthening momentum, of course, confirms that the market is excited about a stock’s potential.
Value investors can use momentum as a check to avoid buying “value traps.” Value traps are stocks that appear undervalued but turn out to be that way for very good reasons. Value seekers may also use momentum to identify stocks that are already recognized as attractive by the rest of the market, a key component of the VMQ strategy. Conversely, investors might avoid value stocks with low momentum, reasoning that no catalyst has yet emerged to get the market’s attention enough to make the stock a buy candidate.
Trading volume can be used to confirm momentum signals. Strong momentum accompanied by expanding volume suggests increasing conviction among buyers. Price increases on declining volume can prove less sustainable.
Use the chart function in AAII’s Stock Evaluator to check whether a stock’s high momentum is confirmed by accompanying rising volume. You can also add momentum measures to any chart by clicking on the Indicators button and selecting metrics from the Lower Indicators list.
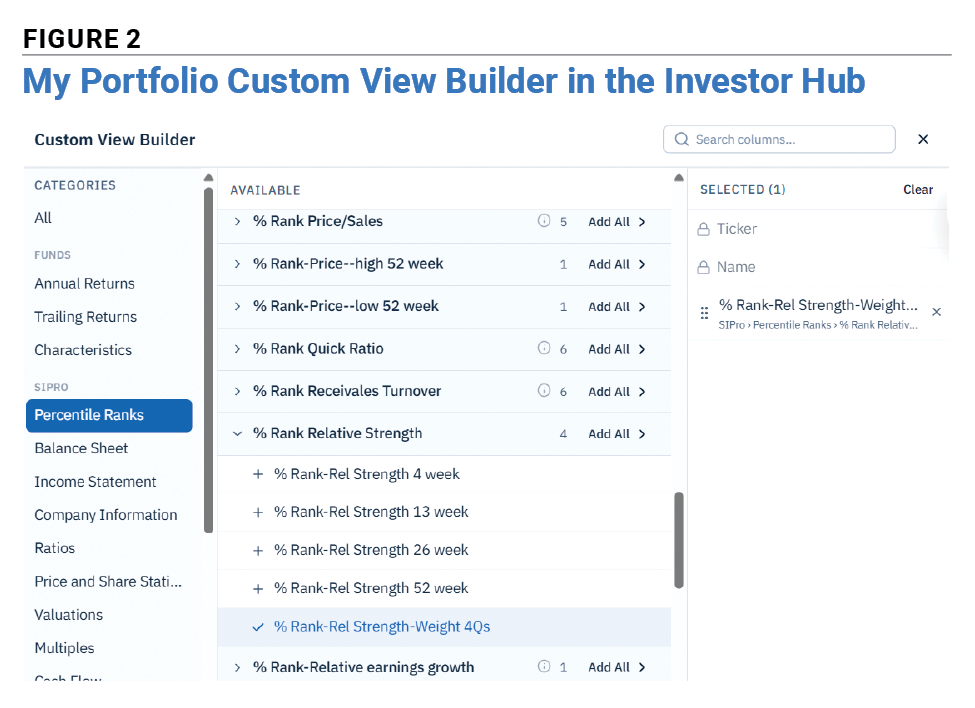
All AAII members can track the four-quarter relative strength rank for the stocks they own or are tracking. To do so, create a portfolio in My Portfolio. Then, in the View drop-down menu located right above your holdings, select Create Custom View. This will open a new menu with criteria you can choose from to build a customized view. Click on Percentile Ranks from the SIPro list on the left-hand side of the pop-up window. Then, scroll down to % Rank Relative Strength and select % Rank-Rel Strength-Weight 4Qs from the drop-down menu (Figure 2).
A+ Investor and AAII Platinum subscribers can access the Momentum Grade—along with AAII’s four other stock grades—throughout AAII.com, including on any stock’s Stock Evaluator page, in the Custom Screener and on the Grades tab of My Portfolio in the Investor Hub. VMQ subscribers can access the Momentum Grade in the VMQ Analyzer and the VMQ Stocks portfolio view in My Portfolio.
Nothing is guaranteed in the markets, and that holds true of the momentum anomaly. What we seek is an edge, and one that is simple to implement. Like the other four A+ Grades, the Momentum Grade is based on solid academic research and thorough backtesting. Consider incorporating momentum into your initial stock screens and portfolio views next time you check your holdings.
First Cut Stocks

AAII How-To

Value Investing

ROBERT A from NC posted 22 days ago:
You need to log in as a registered AAII user before commenting.
Log InCreate an account