


Related

AAII How-To
Four variables go into judging whether a price-earnings ratio is cheap or expensive.

Charles Rotblut leads a class in AAII's new Essential Investing Video Course. Go to https://www.aaii.com/ves for more information and to subscribe.
The price-earnings (P/E) ratio is arguably the most used measure of valuation. It is simple to calculate, but also susceptible to being managed by companies and influenced by investor sentiment. In this article, I show you how to assess whether a given stock’s price-earnings ratio is reasonable.
The price-earnings ratio is calculated as: P/E = Price ÷ Diluted earnings per share from continuing operations (trailing 12 months).
Diluted share counts reflect a company’s total weighted average shares outstanding, including the conversion of stock options, convertible preferred stock and debt. Using earnings from continuing operations omits the contribution of business units or lines intended to be divested or shut down.
This ratio is referred to as the trailing price-earnings ratio because it uses the earnings from the last four reported quarters. The price-earnings ratio shows what investors are willing to pay for each dollar of earnings. Higher price-earnings ratios are generally assigned when investors expect earnings to grow strongly. Lower price-earnings ratios are generally assigned when investors expect earnings to experience slower growth or are uncertain about future profitability. (Situations where these explanations do not hold true are explained below.)
Both price and earnings drive the price-earnings ratio. Earnings are updated quarterly. When a company reports its latest results, the latest quarterly earnings are added to the ratio and the oldest quarterly earnings drop off. A large change in earnings per share can increase or decrease the price-earnings ratio.
The more frequent and powerful driver, however, is the share price. The price reflects investors’ perception of the firm and expectations for future earnings. General market sentiment, sector or industry news, or new information about the company itself can move a stock’s price. Preannouncements made by the company—such as revised sales and earnings guidance—will move the stock price before actual earnings are released.
The trailing price-earnings ratio is the one you are most likely to see. It is based on actual, reported earnings from continuing operations. Reported earnings may be GAAP or adjusted. GAAP earnings follow generally accepted accounting principles. All exchange-listed companies are required to report GAAP earnings.
Many companies also report, and emphasize, adjusted or operating earnings. These earnings are adjusted to reflect performance in a way executives believe is more representative of the underlying business. Excluded expenses can include restructuring charges, impairments, litigation settlements and stock-based compensation, among others. Analysts and data providers like S&P Global Market Intelligence and LSEG may also make their own adjustments.
Because future earnings can differ significantly from current earnings, some investors take the forward price-earnings ratio into consideration. This ratio uses estimated earnings for the current fiscal year or for each of the next two fiscal years. This results in a lower price-earnings ratio if earnings are expected to grow, and a higher ratio if earnings are expected to fall.
An argument for using the forward price-earnings ratio is that it reflects the consensus of investors’ expectations for future earnings. The argument against using the forward price-earnings ratio is that reported earnings often differ from analysts’ expectations. The difference between actual and estimated earnings widens the further into the future earnings are forecast.
The likelihood that analysts’ expectations are wrong is a significant consideration when using a forward-looking price-earnings-to-earnings-growth (PEG) ratio. This ratio is calculated by dividing the forward price-earnings ratio by the estimated three-to-five-year earnings growth rate. A PEG ratio of 1.00 indicates that a stock is trading in line with its projected growth, while ratios above or below 1.00 imply a premium or a discounted valuation, respectively.
Analyst coverage is the bigger problem. Twenty-seven percent of the companies comprising the S&P 500 index, the S&P MidCap 400 index and the S&P SmallCap 600 index have no long-term earnings estimate at all. Another 63% of those companies have only one to three analysts providing an estimate; as such, a single overly optimistic or pessimistic analyst can skew the consensus number.
The estimated annualized growth rate also doesn’t reveal the sequence in which earnings growth will occur. A higher PEG ratio is more defensible for a company expected to grow consistently than it is for one whose growth may come in spurts.
Some investors prefer the historical PEG ratio, which uses the five-year earnings per share growth rate and is read the same way. It cannot be calculated when the historical growth rate is negative. Furthermore, past growth may not be representative of what comes next. Combining both the historical and forward PEG ratios provides an assessment of the valuation based on actual and projected growth. If projected earnings growth is strong, a premium historical PEG ratio can be justified.
Reported earnings per share is an accounting number, as explained above. It is profits earned or losses recognized over a fiscal period. Accounting rules and decisions made by a company’s executives in any given quarter can have a significant impact on the price-earnings ratio. Because the ratio uses four quarters of earnings, a charge or a gain recognized in a single quarter affects it for a full year.
Target Corp.  (TGT) provides an example of how a price-earnings ratio can be deflated. The company reported earnings of $4.11 per share for its second fiscal quarter of 2026 ended August 1, double the $2.05 per share earned during the prior-year quarter. A pretax refund of $994 million—tied to tariffs collected under the International Emergency Economic Powers Act (IEEPA)—added $1.65 per share. Target reported the same $4.11 per share on both a GAAP basis and an adjusted basis, meaning it did not treat the refund as an item to be excluded. The stock’s trailing price-earnings ratio is 16.3 as of October 1, 2026. This is based on a price of $156.70 per share and trailing 12-month (TTM) earnings of $9.64 per share. If we were to omit the tariff refund, Target’s trailing 12-month earnings would fall to $7.99 per share. This would, in turn, push the trailing price-earnings ratio up to 19.6. The refund will drop out of trailing earnings after four quarters, raising the ratio without any change in the stock’s price. With no special event boosting future earnings, Target’s forward price-earnings ratio rises from 15.3 for 2026 to 16.4 for 2027.
Conversely, Trimble Inc.’s (TRMB) trailing price-earnings ratio has become meaningless due to a write-down. The company recognized a $562.0 million charge during its second quarter for the impairment of goodwill—the premium paid in a past acquisition—in its transportation and logistics segment. Trimble attributed it to “heightened macroeconomic uncertainty and reduced market multiples for software businesses.” The charge produced a reported loss of $2.024 per share for the quarter. It was large enough to offset the profits of the three prior quarters, resulting in a trailing 12-month loss of $0.444 per share. Price-earnings ratios cannot be calculated when earnings are negative.
Much of the discussion so far has been on the denominator in the price-earnings ratio formula: earnings. The numerator—price—also plays a big role in determining the ratio.
Price is driven by investor sentiment toward a stock. Increased optimism about a stock or the overall market pushes the share price up and the price-earnings ratio higher. More pessimism about a stock or the overall market drives the share price down and the price-earnings ratio lower.
Enterprise software provider Salesforce Inc. (CRM) trades at a price-earnings ratio of 21.9, down from 37.8 one year ago. This multiple compression—the term used when a valuation contracts—occurred even though Salesforce’s earnings grew 56.7% over this period. Shares of Salesforce were flat over the 52-week period ended October 1, 2026, even though the S&P 500 rose by a double-digit percentage over the same period. Investors have been fearful about the potential disruptive impact of artificial intelligence (AI) on Salesforce and other software providers. Software stocks have been underperforming as a group, which matters when judging the ratio: Salesforce looks different against the market than it does against its own industry.
Investors looking at Salesforce or another stock with a reduced price-earnings ratio must ask whether sentiment has become too bearish—or too bullish. Examine the company’s financial statements, projected earnings and business model to determine whether the sentiment reflected in the price-earnings ratio is justified, too pessimistic (signaling a buying opportunity) or too optimistic (signaling a reason to sell).
Many investors use benchmarks to determine whether a stock’s price-earnings ratio is reasonable. Benchmarks can be tied to the market’s valuation, the sector’s valuation or a stock’s own valuation range.
The stock market’s price-earnings ratio provides insight into the current environment. The market’s median price-earnings ratio helps you assess whether a stock is cheap or expensive relative to the typical stock.
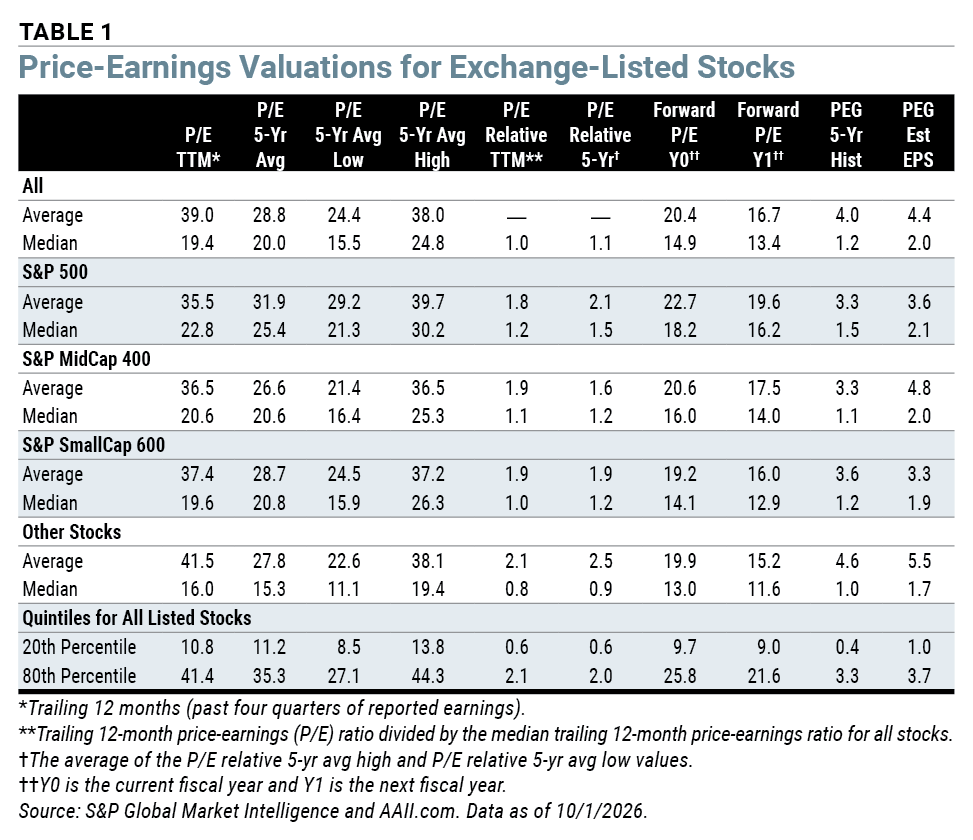
The median price-earnings ratio for all exchange-listed stocks is 19.4, while the average is 39.0. The stocks with the highest valuations skew the average upward. The median price-earnings ratio is less affected by such companies, making it the more useful benchmark. Table 1 shows both the median and average price-earnings ratios for all exchange-listed stocks and segmented by S&P index membership. As you can see, the skewing effect on average valuations is more pronounced among smaller stocks, so be particularly wary of average price-earnings ratios cited for those stocks.
Sector and industry valuations can work better for assessing individual stocks. Sectors and industries filled with growth companies command higher price-earnings ratios; slower-growing sectors and industries have lower price-earnings ratios. For instance, the information tech sector has a median price-earnings ratio of 38.0 (Table 2).
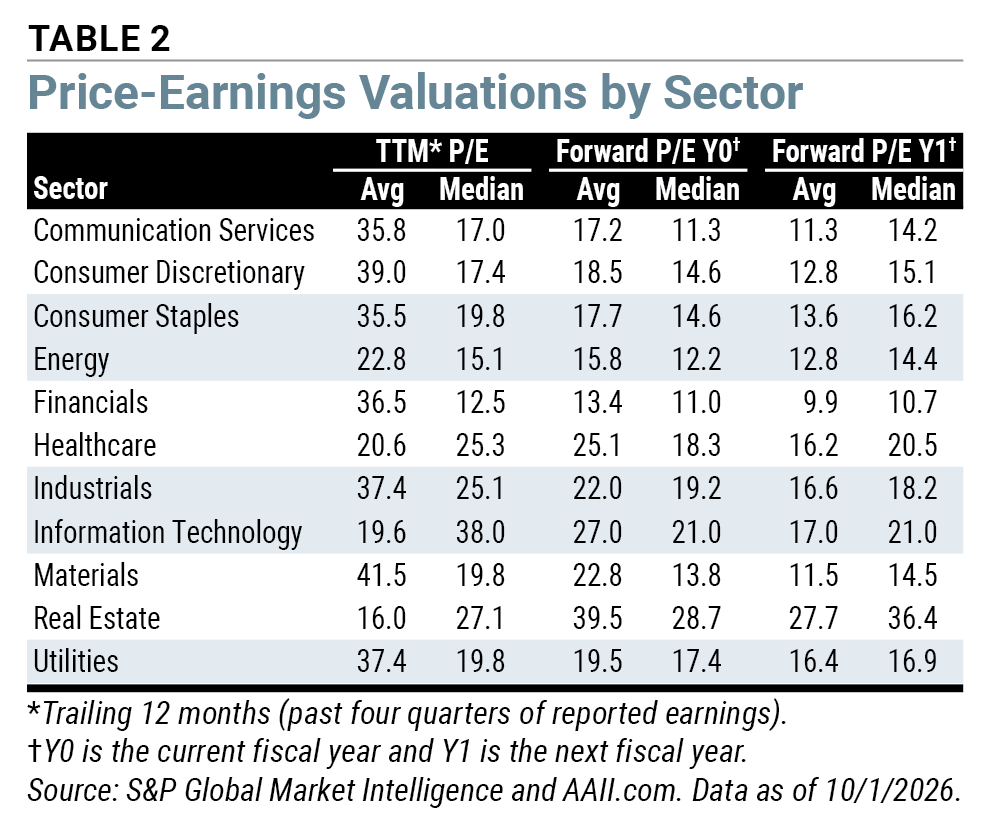
Cyclical sectors and industries can experience downward pressure on their price-earnings ratios when business is good if an economic slowdown is anticipated. This is because investors do not want to pay higher valuations for higher profits perceived as unsustainable. The energy sector is the current example: Oil prices elevated by the Iran war have boosted earnings, but the sector’s median price-earnings ratio is 15.1.
Median valuations provide a broad picture, but individual stocks often trade within their own valuation ranges too. This is where a stock’s five-year average price-earnings ratio can be helpful. This ratio is the average of the annual high and low price-earnings ratios over the last five years. It tells you how the current price-earnings ratio compares with the price-earnings ratios investors have accepted previously. A stock trading below its five-year average high price-earnings ratio may be a bargain if its fundamentals are strong. A stock trading above its five-year average low price-earnings ratio may be expensive if its profitability or growth prospects have not improved.
The price-earnings relative combines these comparisons into one number. It divides a stock’s price-earnings ratio by the market’s median price-earnings ratio; a value above 1.0 means the stock trades at a premium to the market, and a value below 1.0 means it trades at a discount. Comparing a stock’s current price-earnings relative to its five-year average shows whether the stock is more or less expensive than usual compared to the market. (For more on the price-earnings relative, see this issue’s First Cut Stocks.)
Several AAII Stock Screens use the price-earnings ratio to identify potentially attractive stocks. Among them is the Graham Enterprising Investor Revised screen, which ranks among the screens most followed by AAII members.
The screen filters for stocks whose price-earnings ratios rank in the lowest 30% of all stocks. As of October 1, 2026, these are stocks that trade at price-earnings ratios of 12.6 or lower. Additional criteria—including five consecutive years of positive earnings, reasonable debt and growth in earnings over the past five years—are used to eliminate stocks that are cheap for a reason.
A+ Investor and AAII Platinum subscribers can use the Custom Stock Screener to create their own screens. A simple approach would be to screen for a below-median price-earnings ratio (% rank below 50) and an A+ Quality Grade of A or B.
The price-earnings ratio and its variations—the forward price-earnings ratio, the PEG ratio and the price-earnings relative—can tell you when a holding has become expensive. Then, determine whether the high price-earnings ratio reflects temporary or cyclical factors before selling the stock.
For instance, temporarily depressed current earnings can result in an unusually high trailing price-earnings ratio. Slower future growth warrants a lower PEG ratio. Cyclical companies often invert the usual reading. A commodity producer can carry a low price-earnings ratio near the peak of its business cycle, when earnings are at their highest and investors doubt it will persist. A company can carry an unusually high ratio near the bottom of its business cycle, when depressed earnings make the stock look expensive at a time it may be closest to turning.
The following ratios provide benchmarks you can use to determine if a stock’s place in your portfolio warrants reexamination. All benchmarks are as of October 1, 2026.
The Snapshot tab on the Stock Evaluator at AAII.com shows a stock’s trailing price-earnings ratio and five-year historical PEG ratio, along with the percentile ranks and industry median. For more in-depth data, the Valuation tab on the Stock Evaluator shows price-earnings ratios over various time periods for the stock and its sector and industry, plus several versions of the PEG ratio. To access the Stock Evaluator, type a stock’s name or ticker symbol in into the search box at the top-left corner of AAII.com.
While these are good cutoffs, you should still consider the company’s prospects.
A price-earnings ratio is not necessarily cheap or expensive on its own. What makes it one or the other are what sits in the denominator, investor sentiment, how the stock has historically traded and what comparable stocks trade for. Judge the number against all four variables and you will know whether it reflects the business or the expectations attached to it.
The next article in our new Stock Valuation series will examine the price-to-sales (P/S) ratio.
AAII How-To

Stock Valuation

AAII Stock Ideas

No comments have been added yet. Add your thoughts to the discussion!
You need to log in as a registered AAII user before commenting.
Log InCreate an account