


Related

Stock Valuation
Valuation ratios, historical comparisons, earnings estimates and profitability measures can help identify overvalued stocks.
by Sam Levine | November 2026

Owning an overvalued stock is like playing a game of chicken with the rest of the market. Though stocks can remain at elevated valuations for quite some time or even rise higher, rational investors presume that a stock’s market price will eventually approach its “true” value. The challenge is that a stock’s true value can only be an estimate.
There are three approaches that we can take to evaluate whether a stock might be overvalued:
Intrinsic value estimates a stock’s true worth independent of the market’s assessment. That might seem to be more precise than simply buying if a stock is lower than an industry average or selling when it is above that average, but small changes in the inputs can lead to substantial changes in the estimated value. It’s very difficult to accurately project interest and growth rates for the next 20 years.
Relative valuation assumes that an overvalued or undervalued stock will eventually revert toward an average. That’s reasonable, given that all companies face competition, regulation, shifting buyer behavior, and the laws of large numbers and diminishing returns.
You can compare a stock’s current price-earnings (P/E) ratio, price-to-book-value (P/B) ratio, price-to-sales (P/S) ratio and other valuation ratios to their industry and sector medians as well as to the company’s past ratios at the Valuation tab of AAII’s Stock Evaluator, accessible by all members. A quick look at the comparisons for Nvidia Corp.  (NVDA) in Figure 1 provides helpful insights.
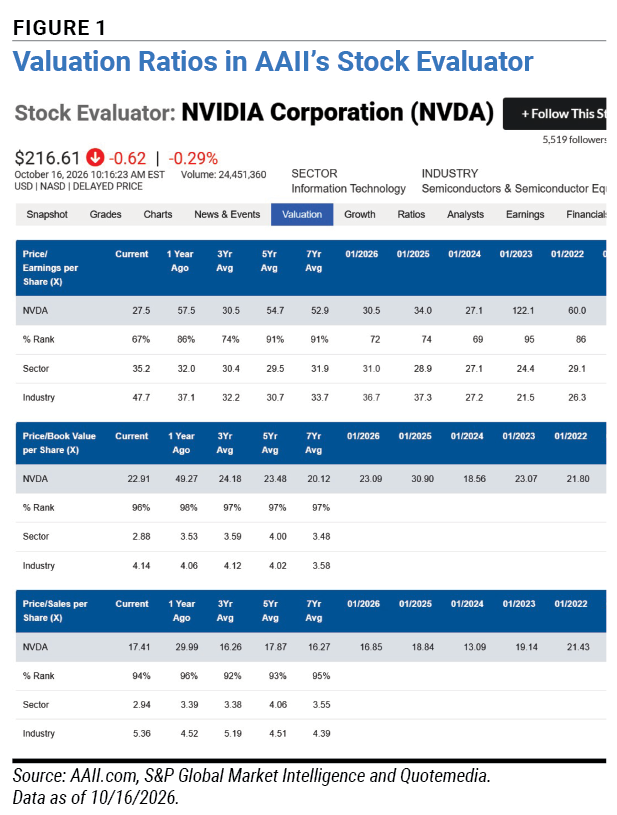
That same analysis can be performed on a stock’s cash flow and dividend yield at the Valuation tab, as well as the ratio of enterprise value to earnings before interest, taxes, depreciation and amortization (EBITDA), buyback yield and shareholder yield. (See this issue’s Stock Valuation article for more on using the price-earnings ratio for valuing a stock.)
While some investing strategies rely solely on valuation ratios, others prompt you to take the additional step of understanding why those ratios might be lower or higher than those of the stock’s peers or than its own historical ratios. A high current price-earnings ratio might be warranted if the company’s profits are growing at a high rate.
You can test that by examining the stock’s PEG ratio, which divides the price-earnings ratio by the stock’s estimated earnings growth rate. A PEG ratio of less than 1.00 suggests that a company is underpriced relative to its expected earnings. The PEG ratio is also reported on the Valuation tab of AAII’s Stock Evaluator.
A stock’s book value is the company’s assets minus its liabilities, divided by the number of shares outstanding. Note that assets and liabilities are typically recorded at their historical costs less any depreciation or amortization. This can cause the book value to understate assets. Investors could accept a higher price-to-book ratio if the company is efficient at generating high return for each dollar of net assets.
Examining a stock’s profitability ratios can provide insight as to whether this is the case. The Ratios tab of the Stock Evaluator, also available to all members, provides key data to help you make this determination. Look specifically at return on equity (ROE), located in the Profitability Ratios section of this tab. Nvidia’s return on equity is very strong at 117.2%, compared to its industry median (5.1%). Nvidia’s profit margins are also strong. This implies that investors are accepting a higher valuation given the company’s earnings power.
Once you have a sense of what’s driving a stock’s valuation measures, the next question you might ask is whether the expectations behind those numbers are justified. Nvidia, like all companies, faces competition and shifting demand. The threat of a competitor coming out with more energy-efficient and speedier graphics processing units (GPUs) is always a risk for the company.
The Snapshot tab of the Evaluator, available to all members, shows the consensus estimates for the current and next fiscal years. If you believe that Nvidia is unlikely to achieve those earnings—perhaps because you believe the company will lose pricing power due to competition—you might conclude that the stock is overvalued. Conversely, if you decide that Nvidia’s estimated growth rates do not adequately reflect its pricing power and future sales growth, you might consider the valuations to be reasonable.
A+ Investor and AAII Platinum subscribers can take advantage of the A+ Grades to aid in valuing a stock. These are accessible via the Grades tab of the Stock Evaluator, as well as via the My Portfolio tool in the AAII Investor Hub.
The A+ Value Grade assesses a stock’s valuation based on six valuation ratios. This helps in comparing stocks and deciding whether to take a closer look at a particular stock. The A+ Growth Grade analyzes stocks based on their sustainable growth characteristics. Lower scores are assigned to parabolic growth stocks that have a higher risk of disappointing the market. Stocks that have failed to sustain growth or positive cash flow from operations are also penalized with a lower score.
For those wanting the most granular approach, all members can create a custom view in My Portfolio from a comprehensive list of valuation ratios. Additional fundamental criteria, including growth metrics and financial ratios, can also be added to a custom view (Figure 2). All AAII members can add up to 10 criteria to a custom view; A+ Investor and AAII Platinum subscribers can add even more criteria.
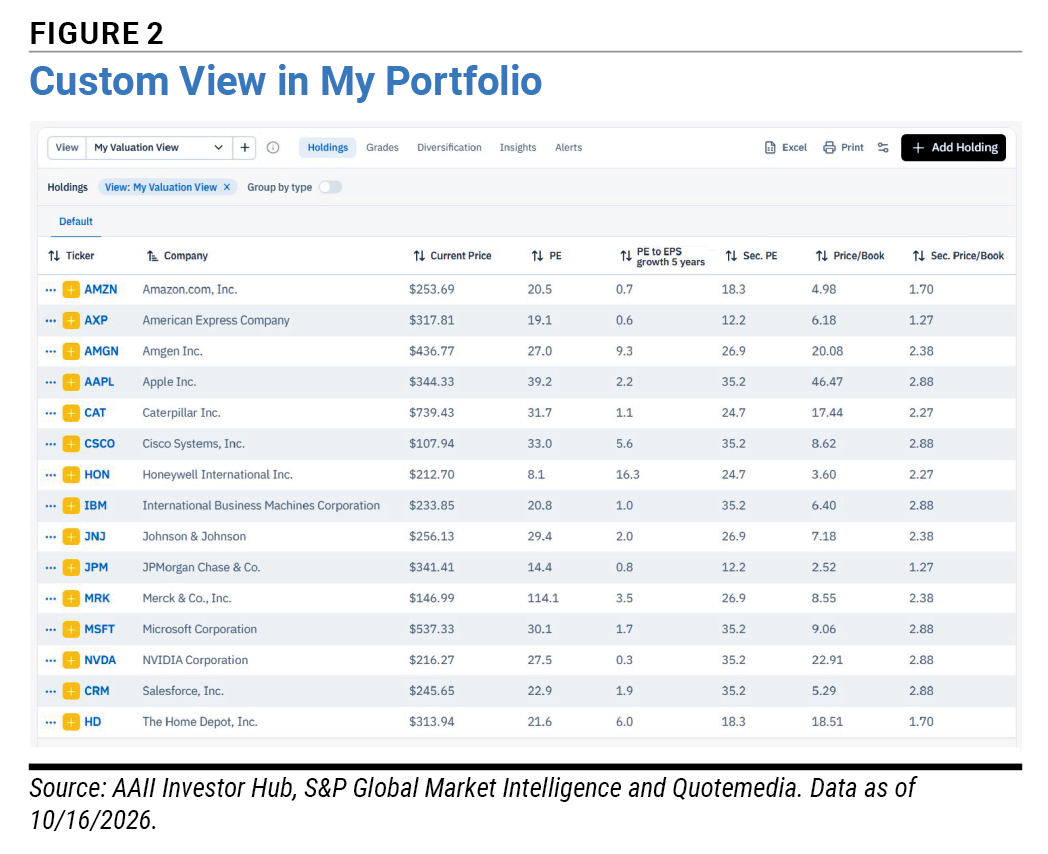
Determining whether a stock is overvalued begins with numbers and ratios; but, as is the case with most investing decisions, it ultimately boils down to judgment. As cut-and-dried as valuation ratios might appear, they are only a start.
When you see an elevated ratio, look for reasons why it might be warranted. Perhaps the company has a dominant product or highly effective management. If that’s true, those high valuations can persist for years [just ask Amazon.com Inc. (AMZN)]. If not, it might be time to look for the next, less richly valued opportunity.
Stock Valuation

Stock Valuation


JOHN L from NJ posted 7 days ago:
SAM L from USA posted 7 days ago:
You need to log in as a registered AAII user before commenting.
Log InCreate an account