


Wall Street legend William J. O’Neil died in late May 2023 at the age of 90. He was a pioneer in growth-based investing and his research of the characteristics of winning stocks is vast and insightful. He founded Investor’s Business Daily (IBD) in 1984 and authored “How to Make Money in Stocks,” which outlines his research and application of what became a popular investment strategy.
AAII has been covering O’Neil’s CAN SLIM approach for over 20 years. CAN SLIM also serves as the basis for one of the strategies used in AAII’s Stock Superstars Report. All of us at AAII were saddened to hear of his passing and extend our condolences to his family and friends. This article revisits the lessons and intricacies of O’Neil’s investment strategy as a tribute to his life’s work.
In the second edition of “How to Make Money in Stocks,” O’Neil studied 500 of the biggest stock market winners from 1953 to 1993. The CAN SLIM approach in the book was based upon the characteristics that these winning stocks possessed prior to their big price run-ups and was the basis for AAII’s original O’Neil CAN SLIM screen.
O’Neil extended his analysis of past market winners to 600 companies that performed strongly from 1953 to 2001 and revised several CAN SLIM criteria in the third edition of his book, published in 2002. In the fourth edition of “How to Make Money in Stocks” (2011), O’Neil once again expanded his analysis of past market winners. This time the analysis was extended to 1,000 of the top-performing stocks from 1880 through 2009. O’Neil also provided a full update of the CAN SLIM approach. This fourth edition now serves as the primary source for information on the CAN SLIM strategy.
O’Neil was a strong believer in the sustained long-term growth of the American economy due to the freedoms and opportunities available, which he said made the U.S. a “prime success model” worldwide and a leader in high-growth, innovative entrepreneurial companies. His goal of investing in stocks was to participate in that long-term growth. He recommended that investors arm themselves with the knowledge and information to make their own investment decisions with confidence. They should learn to invest using sound principles and proven rules and methods. Those who fall short of implementing a well-developed investment approach are doomed to mediocre results.
O’Neil honed his strategy by not only paying attention to what worked but also identifying mistakes others made. One example was the reluctance by some investors to buy stocks when their prices were moving upward and approaching their highs for the year. He found that such stocks can keep moving upward. O’Neil sold stocks quickly when they declined by 8% to avoid major losses. O’Neil stopped being concerned with company valuations because growth metrics were proven to identify successful companies. He analyzed the overall market by monitoring daily price and volume charts to help identify periods when the market was moving upward and therefore offering better conditions for stocks to move upward. Possibly the most important thing O’Neil learned is that investors must use time-tested sell rules to decide when it’s time to take gains. This helps to avoid any emotional biases investors face when managing a portfolio and reinforce the research put into building a portfolio.
For years, O’Neil’s research proved that specific growth characteristics of stocks can be tracked to discover companies that have strong prospects for future growth. His first step was to examine the winners and leaders of the past to determine the characteristics that they shared before they ascended into greatness.
The key factors O’Neil identified are:
- Quarterly earnings
- Annual earnings history
- Amount of trading volume
- Degree of relative strength
- Number of outstanding common shares
- Significant new products or services
- Ties to strong industry group moves caused by industry changes
Known by the acronym CAN SLIM, the approach seeks companies with a proven record of quarterly and annual earnings and sales growth showing strong relative price strength and support from leading institutions. O’Neil did not mind paying rich premiums for stocks with good prospects. He felt that most strategies seeking stocks with low price-earnings (P/E) ratios were flawed because they ignore the price trend determining the price-earnings ratio as well as the quality of the underlying earnings within the ratio. O’Neil believed that stocks generally sell for what they are worth and most stocks with low price-earnings ratios are probably priced correctly by the market. O’Neil also found that it was important to follow the market closely and try to lighten up your stock exposure when going into a bear market.
Definitions
Float: The number of shares in the hands of the public, determined by subtracting the number of shares held by management from the number of shares outstanding.
Institutional Ownership: The number of mutual funds, pensions, insurance companies, banks, hedge funds or charitable endowments holding a specific stock. O’Neil favored stocks with some level of institutional ownership.
Percentile Rank: The ranking of a specific metric for a stock relative to all other companies. Stocks ranking in the highest percentile have the highest values for a selected metric.
Relative Price Strength: A stock’s price performance relative to a benchmark, such as a major market index.
Technical Analysis: A method of using charts containing price and volume movements to determine the attractiveness of a stock. O’Neil extended his technical analysis to determine the overall market’s direction.
AAII’s CAN SLIM Screens
We track three CAN SLIM screens: the original screen based on the second edition of O’Neil’s book, a revised version based on the book’s third edition and a version that removes the criterion for “float” to be no more than 20 million shares. (Float is the number of shares in the hands of the public, determined by subtracting the number of shares held by management from the number of shares outstanding.)
Figure 1 provides a summary of the screens’ performance compared to the S&P 500 index, using data from AAII’s Stock Investor Pro fundamental stock screening and research database. As of May 31, 2023, the CAN SLIM screen is up 16.7% so far this year, outperforming the S&P 500’s gain of 9.8%. O’Neil CAN SLIM No Float and O’Neil CAN SLIM 3rd Edition screens are down 3.6% and 0.8%, respectively, year to date.
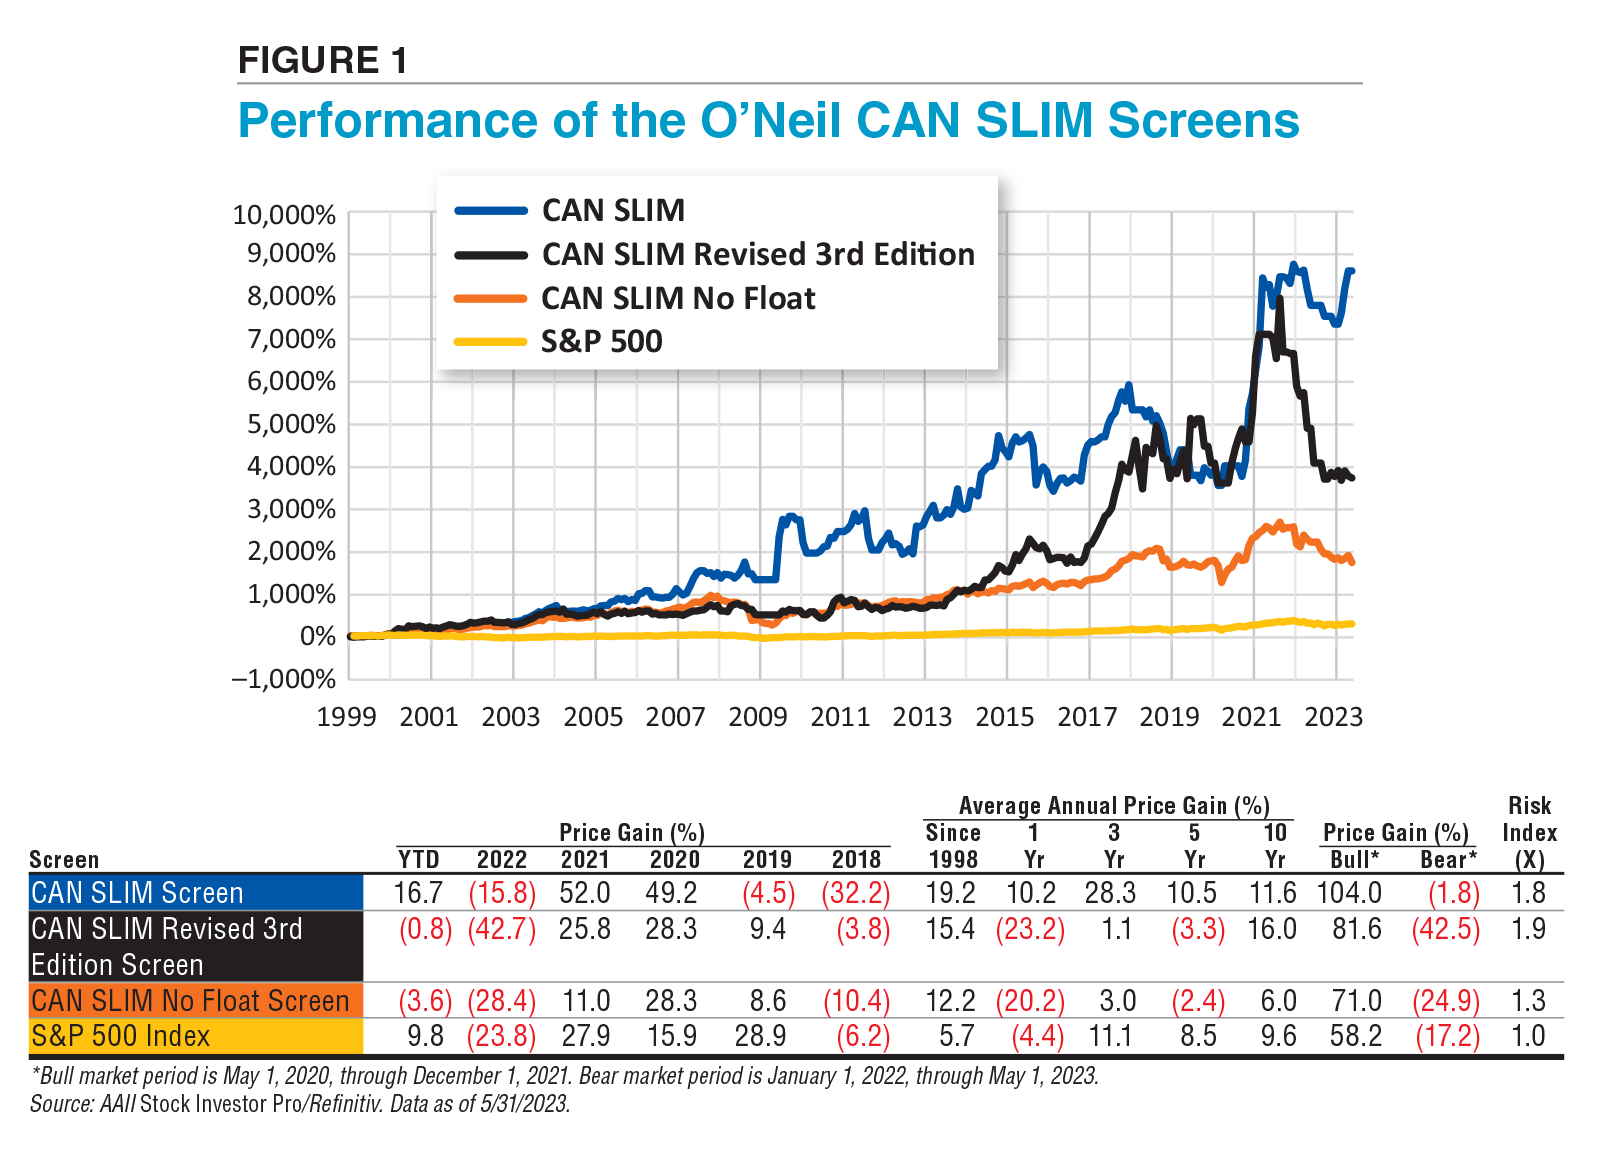
It is important to look at long-term in addition to short-term performance for all stock strategies. The annualized price gain for the O’Neil CAN SLIM screen since its inception in 1998 is 19.2%, representing a cumulative 8,605.3%. This outperformed the S&P 500’s annualized gain of 5.7% over the same period. The No Float and 3rd Edition screens have annualized gains of 12.2% and 15.4%, respectively, since 1998.
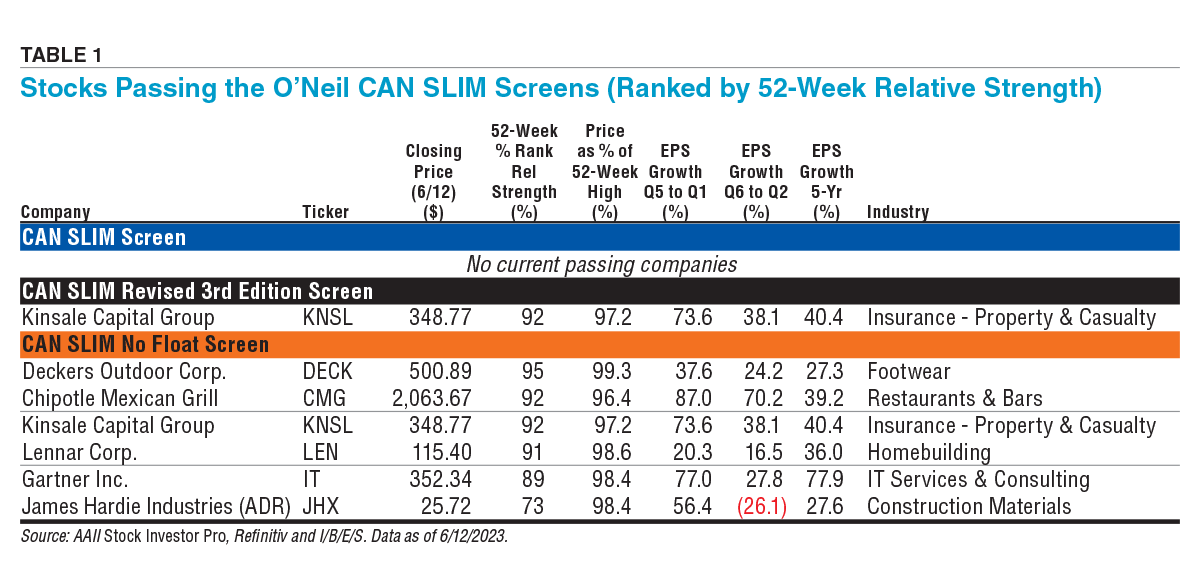
Table 1 shows the list of passing companies for the three CAN SLIM screens as of June 12, 2023. You may notice that there is currently a low number of passing companies. In fact, no companies are currently passing the O’Neil CAN SLIM screen and just six companies are passing the CAN SLIM No Float screen. The single company passing the 3rd Edition Revised screen is also passing the No Float screen. Overall, the CAN SLIM screens usually have a small number of passing companies because the criteria are quite restrictive. Specifically, the criteria for five-year earnings growth of at least 25% and a current price of at least 90% of the 52-week high eliminate a very large number of stocks from consideration. Still, the restrictiveness of these screens makes it possible to find strong prospects, as evidenced by the long-term outperformance of all three screens. Current lists of passing companies can be found at AAII.com.
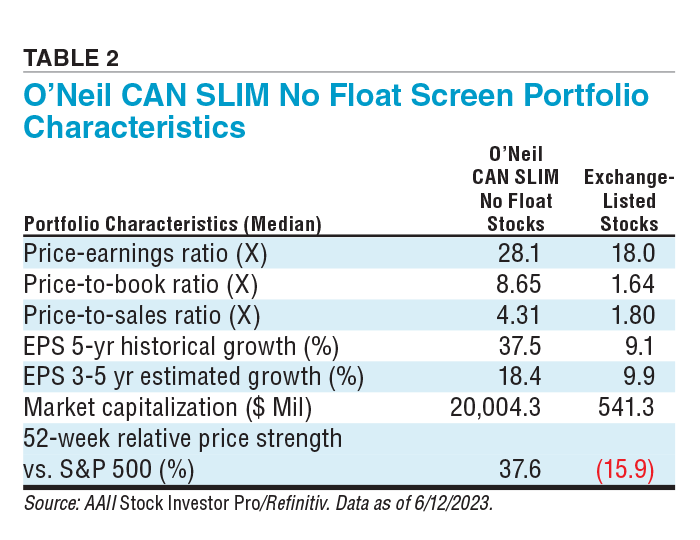
In Table 2, you can see that as of June 12, 2023, the median five-year historical earnings growth rate for all exchange-listed stocks is 9.1%. The median price as a percentage of the 52-week high is 74.0% (not shown). Since large-cap stocks were in a bear market until May and small-cap stocks were still in a bear market as I wrote this, it is logical that most stock prices are lower relative to their respective 52-week highs. Additionally, earnings per share have been lower over the past few years because of the coronavirus pandemic and subsequent economic headwinds. This effectively lowered long-term average growth rates for many companies.
An Overview of CAN SLIM
C: Current Quarterly Earnings
O’Neil’s study of winning stocks revealed that these securities generally had strong quarterly earnings per share performance prior to their significant price run-ups. He recommended looking for stocks with a minimum increase in quarterly earnings of 18% to 20% over the same quarterly period one year ago. Booming profit growth helps lead to booming stock prices. When examining quarterly earnings increases, it is important to compare a quarter to the equivalent quarter in the prior year; for example, this year’s first quarter compared to last year’s first quarter. Many firms have seasonal patterns to their earnings, and comparing similar quarters helps to take this into account.
O’Neil notes that you should check analyst consensus estimates to make sure that the company has a positive projected path forward. Look for increases in estimates of earnings going forward. It is also a good sign if the company has had positive earnings surprises (reported earnings higher than the consensus estimate), as these surprises are often repeated in subsequent quarters. Additionally, companies should have an increasing rate of year-over-year growth in quarterly earnings. Not only are earnings important, but quarterly growth and accelerating growth in sales are good factors to look for.
A: Annual Earnings Increases
Winning stocks in O’Neil’s study had a steady and significant record of annual earnings in addition to a strong record of current earnings. The Revised 3rd Edition screen requires that earnings per share show an increase in each of the last three years, loosened from the original CAN SLIM screen’s requirement for five years of consecutive increases in earnings. Three consecutive years of year-over-year earnings growth will weed out most of the poor prospects. Annual earnings increases ensure that the quality of the short-term growth is lasting and significant. O’Neil recommended companies with an annual growth rate of at least 25%.
N: New Companies, New Products, New Highs
O’Neil discovered that stocks need a catalyst to start a strong price advance. In his study, he found that 95% of the winning stocks had some sort of fundamental spark to push the company ahead of the pack. This catalyst can be a new product or service, a new management team employed after a period of lackluster performance, or even a structural change in a company’s industry, such as a new technology that is revolutionary and causes disruption. It takes something new to produce a startling advance. A new product or service can boost sales and profit, especially for a smaller firm. A change in management can bring new vigor and ideas as well as sweep clean the old and unprofitable segments. Changing industry conditions can vary from new technology that alters the marketplace, to changes in the level of competition that modifies the ability to raise prices.
Reaching new highs in stock prices after a period of consolidation is also very important. O’Neil said stocks that seem too high-priced and risky often go even higher, while stocks that seem cheap often go even lower. Stocks that are making the new high list while accompanied by a big increase in volume might be prospects worth checking out.
Criteria for AAII’s CAN SLIM Screens
- Current quarterly earnings per share are 20% above earnings per share for the same quarter one year prior
- Quarterly earnings per share growth is accelerating
- Positive quarterly earnings per share over the past two quarters
- Five consecutive years of growth in earnings per share from continuing operations (three years for 3rd Edition version)
- Five-year average annual growth in earnings per share is greater than or equal to 25% (three-year growth for 3rd Edition version)
- Current price is at least 90% of the 52-week high price
- 52-week relative strength ranking in the top 30% of all companies (top 20% for 3rd Edition version)
- Float is less than or equal to 20 million shares (eliminated for No Float and 3rd Edition versions)
- At least five institutional shareholders
- Year-over-year sales growth for most recent quarter is above 25% (3rd Edition version only)
- The current fiscal-year consensus earnings estimate is greater than fully diluted earnings per share from continuing operations for the last reported fiscal year (3rd Edition version only)
- Institutional share purchases are greater than institutional shares sold (3rd Edition version only)
S: Supply and Demand
Any size stock can be purchased using the CAN SLIM approach, but supply and demand ultimately determine stock prices. High new demand is needed to push up the stock significantly. The larger the number of shares outstanding, the greater the demand needs to be. O’Neil favored the stocks of smaller firms not only for their growth prospects, but also because of the smaller number of shares outstanding. For these firms, a “reasonable” amount of buying can quickly push up the stock price. On the other hand, he warned that the very same characteristics make these stocks less liquid and more volatile, which are extra risks that investors must consider.
O’Neil suggested that investors consider looking at the actual float of the stock. In the original CAN SLIM screen, we limited the float to 20 million shares. As companies have become larger, this float has become increasingly restrictive. In addition, O’Neil did not explicitly lay out this requirement in his original book. The CAN SLIM No Float and Revised 3rd Edition screens eliminate the float requirement used in the original CAN SLIM screen.
L: Leader or Laggard
O’Neil was not a patient value investor looking for out-of-favor companies and willing to wait for the market to come around to his viewpoint. Rather, he preferred to identify rapidly growing companies that are market leaders in expanding industries. O’Neil advocated buying from among the best two or three stocks in a group. He felt that you will be compensated for any premium you pay for these leaders with significantly higher rates of return.
He suggested using relative strength to identify market leaders. Relative strength compares the performance of a stock to the overall market. Companies are ranked by their price performance for a given period, and their percentage ranking among all stocks is calculated to show the relative position against other stocks. IBD presents the percentage ranking of stocks; O’Neil recommended avoiding any stock with a relative strength rank below 70% and only seeking out stocks with a percentage rank of 80% or better. These firms should also have sound base patterns (areas of price correction and consolidation). From 1950 to 2008 the average relative strength rank of the best-performing stocks was 87% before their big move up in price.
I: Institutional Sponsorship
It takes big demand to push up stock prices, and the biggest source of demand comes from institutional investors such as mutual funds, pensions, insurance companies, banks, hedge funds and even charitable endowments. O’Neil felt that a stock needs a few institutional sponsors for it to show above-market performance. Twenty institutional owners are suggested as a reasonable minimum number, but that number was too restrictive in our interpretation of the strategy, so it was lowered to five. This number refers to actual institutional owners of the common stock, not institutional analysts tracking and providing earnings estimates on stocks. Without institutional ownership, a stock is more likely to be a “run-of-the-mill” performer, given all the potential investors that passed on the company.
M: Market Direction
The final aspect of the CAN SLIM system looks at the overall market direction. While it may not have an impact on the selection of specific stocks, the trend of the overall market will have a tremendous impact on the performance of your portfolio. O’Neil focused on technical measures when determining the overall direction of the marketplace. Investors should carefully study the daily price and volume charts of three or four major market indexes to understand the stage of the market and its general direction. O’Neil found it difficult to fight the trend, so it is important to determine if you are in a bull or bear market. Additionally, O’Neil recommended selling at least some positions and raising some cash when the overall environment weakens and your stock selections are not working out.

Related

AAII How-To
How to Analyze Earnings Surprises
Related

Growth Investing
Growth Stock Selection: Covering All the Analysis Bases
Discussion
FREE REPORT

Get your free copy of our special
report analyzing the tech stocks
most likely to outperform the
market.
BARRY J from TX posted over 3 years ago:
FRANCISCO G from MI posted over 3 years ago:
You need to log in as a registered AAII user before commenting.
Log InCreate an account