


Related

Industry Focus
Despite the recent negative headwinds for the auto and truck manufacturing industry, there are reasons for optimism going forward.
by Jack Gilleland | July 2023

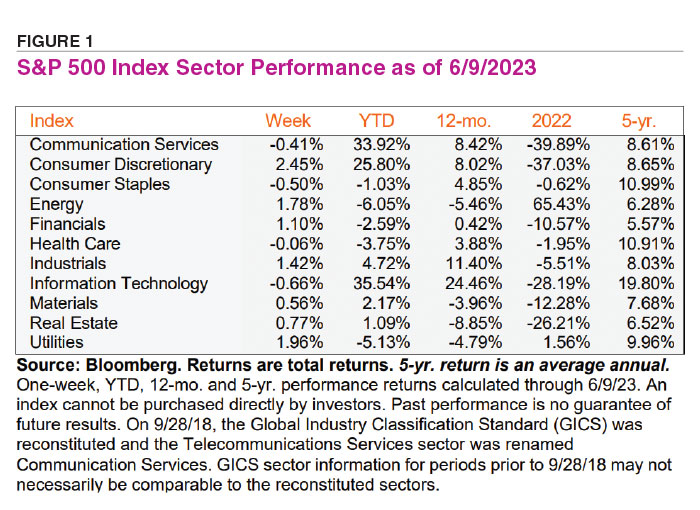
The consumer discretionary sector is the third-best-performing S&P 500 index sector year to date, up 25.8% through June 9, 2023, trailing only information technology and communication services (Figure 1). This performance is notable after an abysmal 2022, when the sector saw the second-worst performance, down 37.0%.
Consumer discretionary is a category of stocks including companies whose businesses are considered non-essential. These companies provide goods and services that are not necessities but are desired by consumers when they have disposable income.
The consumer discretionary sector is often affected by consumer sentiment and economic conditions. During periods of economic growth and rising disposable income, consumers tend to spend more on discretionary items. Conversely, during economic downturns or recessions, consumers may cut back on nonessential purchases.
Within the consumer discretionary sector, there are several industries with their own dynamics and factors affecting performance. These subindustries include retail (both brick-and-mortar and e-commerce), leisure and hospitality, media and entertainment, automobiles, consumer durables and more.
To narrow down an industry to focus on within the consumer discretionary sector, we looked at the top 20 common stock holdings in the three largest—by assets under management (AUM)—consumer discretionary sector exchange-traded funds (ETFs): Consumer Discretionary Select Sector SPDR ETF  (XLY), Vanguard Consumer Discretionary Index ETF (VCR) and Fidelity MSCI Consumer Discretionary Index ETF (FDIS). A common theme found among the top 20 holdings was the automotive and truck manufacturing industry.
Manufacturing growth has been outpaced by services in the U.S., with service sector job growth outweighing manufacturing in terms of gross employment. However, manufacturing’s contribution to real gross domestic product (GDP) has remained somewhat stable since the 1940s at around 12% to 13% annually. Auto and truck production remains a large part of the manufacturing done in the U.S., with North America contributing over 14 million new vehicle sales in 2022.
The auto and truck manufacturing industry has experienced stagnated growth over the past five years, with industry median sales growth of only 0.9%. A shortage of new vehicles due to pandemic-related interruptions has been one factor. Decreased purchasing power among consumers and increased cost of raw materials and labor due to inflation have negatively impacted both ends of the market. Additionally, more consumers are opting to maintain and fix their vehicles rather than buy new ones, with the average age of cars and light trucks on the road in the U.S. currently at 12.5 years, an all-time high. Increased borrowing rates have put pressure on the auto industry as it is harder to secure a favorable loan on significant purchases. The average annual percentage rate (APR) on loans for new vehicles in the first quarter of 2023 reached 7%, which is the highest level on record since the first quarter of 2008. This compares to 4.4% APR for new car loans in the first quarter of 2022.
Despite all the negative headwinds for the auto and truck manufacturing industry, there are some reasons for optimism going forward. Increased efficiency could lead to new purchases. Many new vehicles either use less gas per miles driven or do not need gasoline at all. Moreover, inventories have recovered as supply chain constraints have waned.
The emergence of electric vehicles (EVs) is a major factor in auto and truck manufacturing, as battery technology continues to improve. With the Inflation Reduction Act of 2022 offering new tax benefits on certain EV purchases, more consumers are expected to purchase them. While Tesla Inc. (TSLA) has a large head start in capturing EV market share, companies such as Ford Motor Co. (F), General Motors Co. (GM) and Volkswagen AG have made significant strides and publicly committed to the future of EVs.
Of the three biggest consumer discretionary ETFs’ top 20 holdings, three auto and truck manufacturers were a commonality: Ford, General Motors and Tesla. We examine these stocks by their individual A+ Investor Scores and Grades for earnings estimate revisions, growth, quality, momentum and value (Table 1).
A+ Investor Stock Grades for Three Auto & Truck Manufacturers" src="https://www.aaii.com/images/journal/68039-table-1.png" style="width: 700px; height: 356px;" />
Ford manufactures a full line of electrified passenger and commercial vehicles, such as Ford trucks, utility vehicles, vans, cars and Lincoln luxury vehicles. In addition, the company provides financing options for new and used vehicles as well as leases for new vehicles to retail and commercial customers.
The components of the Growth Score consider a company’s success in growing sales on a year-over-year and long(er)-term annualized basis as well as its ability to consistently generate positive cash from its core operations. Ford has a Growth Score of 63, which translates to a Growth Grade of B. Its five-year annualized sales growth rate is a mere 0.2%. But despite relatively flat sales growth, the company has managed to generate positive cash from operations for each of the past five years.
Ford has been beating analyst earnings estimates as of late, posting a 52.9% positive earnings surprise for the first quarter of 2023. All 19 of the covering analysts increased their earnings estimates for fiscal-year 2023, up to $1.77 from $1.75 per share one month ago. This factored into an Earnings Estimate Revisions Score of 71, which is equivalent to a grade of B.
The Value Score is the percentile rank of the average of the percentile ranks of six different financial ratios, with a stock needing to have a valid (non-null) ratio for at least two of the six. Ford has non-null values for five of the value metrics. The company has an attractive shareholder yield of 4.7%, a metric that is used to measure the share repurchases and dividend payments of a company. In comparison, the consumer cyclicals sector median is 0.0% for shareholder yield. The valuation implied by Ford’s shareholder yield ranks in the cheapest 20% of all U.S. stocks, Ford has a Value Score of 75 (with Value Scores inversely related to valuations), for a Value Grade of B.
Momentum is based on the price change of a stock over a specified period relative to all other stocks. It is considered to be an anomaly in the analysis of stock returns because stocks with high relative levels of momentum tend to continue to outperform, while stocks with low relative levels of momentum tend to continue underperforming. Ford has a relative price strength for the first quarter of 9.2%, which compares to the consumer cyclicals sector median of –9.1% over the same period. The company’s Momentum Score of 74 is considered strong (grade of B).
General Motors designs, builds and sells trucks, crossovers, cars and automobile parts and provides software-enabled services and subscriptions worldwide. The company’s vehicle brands are Buick, Cadillac, Chevrolet and GMC.
General Motors currently has an A+ Investor Value Score of 95, which is considered deep value (grade of A). Its extremely attractive valuation multiples include a price-to-sales (P/S) ratio and a price-earnings (P/E) ratio significantly below the sector medians. The price-to-sales ratio of 0.33 puts it in the 13th percentile of all stocks in the stock universe. The price-earnings ratio of 5.8 ranks in the 12th percentile of all stocks and is below the stock’s five-year average price-earnings ratio of 7.6.
Currently, General Motors has a Growth Grade of B based on a score of 63, which equates to strong growth. The company’s revenues have grown at a 1.5% annualized pace over the past five years, compared to the sector median of 6.0%. General Motors has realized positive annual cash from operations during each of the past five years and year-over-year sales increases in three of the last five years. For the past year, the sales growth rate is 23.4%, compared to the sector median of 11.4%.
General Motors currently has an Earnings Estimate Revisions Grade of B (positive), as analysts have revised their earnings forecasts upward. The company reported a positive earnings surprise of 27.6% for the first quarter of 2023, and in the prior quarter it reported a positive earnings surprise of 25.7%. Over the last three months (as of mid-June), the consensus earnings estimate for the second quarter of 2023 has increased from $1.62 to $1.67 per share. The change reflects 12 upward revisions and three downward revisions from analysts. The consensus earnings estimate for full-year 2023 has remained the same over the past three months at $6.84 per share, compared to $6.13 per share realized in 2022.
The Quality Grade is the percentile rank of the average of the percentile ranks of eight different measures of financial strength. The Quality Score is used to assess the underlying fundamental strength of a stock. A higher-quality stock possesses traits associated with upside potential and reduced downside risk. Stocks receive better grades (higher scores) for having higher ranks for the quality subcomponents and worse grades (lower scores) for lower ranks for the subcomponents. Currently, General Motors has a Quality Grade of B, which is defined as strong quality. Its Quality Grade is led by its strong F-Score of 7 and its buyback yield of 4.3%, ranking the stock in the 85th and 88th percentiles, respectively. The F-Score is calculated using nine criteria based on fundamental metrics. A stock receives a point for each criterion it meets. If it doesn’t meet a specific criterion, then no point is awarded. The highest F-Score a stock can be awarded is 9; the lowest F-Score is 0.
Tesla designs and manufactures fully electric vehicles and energy generation and storage systems as well as related services. Currently, Tesla is the sixth-largest company in the U.S. by market capitalization and is valued at over $800 billion.
It is no surprise that Tesla has a Growth Score of 82, translating to a very strong Growth Grade of A. The company has an annualized five-year sales growth rate of 47.3%, ranking it in the 92nd percentile of all U.S.-listed stocks. Tesla has seen its sales skyrocket over the past five years but has only been able to translate those impressive sales into positive earnings since 2020.
Tesla currently has a Quality Score of 72, which is equivalent to a Quality Grade of B, considered strong. The company has an F-Score of 7, which is above the sector median of 4. Tesla’s return on assets of 15.1% ranks in the 93rd percentile of all stocks. Return on assets is a profitability ratio, measuring the profits generated from a company’s assets. It can reveal how efficient management is in managing its assets, thus making it a good measure of financial quality.
Tesla has had impressive relative price strength over the past four quarters, with only one quarter having a lower relative strength than the sector median. In the most recent quarter, Tesla’s price momentum ranks in the top 92% of all U.S. stocks. Its weighted four-quarter relative price strength is also impressive, ranking in the 89th percentile.
ETFs are an option for investors who want exposure to auto and truck manufacturers but are looking to diversify their holdings instead of investing in one or two individual stocks. ETFs don’t have back-end loads or other restrictions on selling like some sector- and industry-based mutual funds can have.
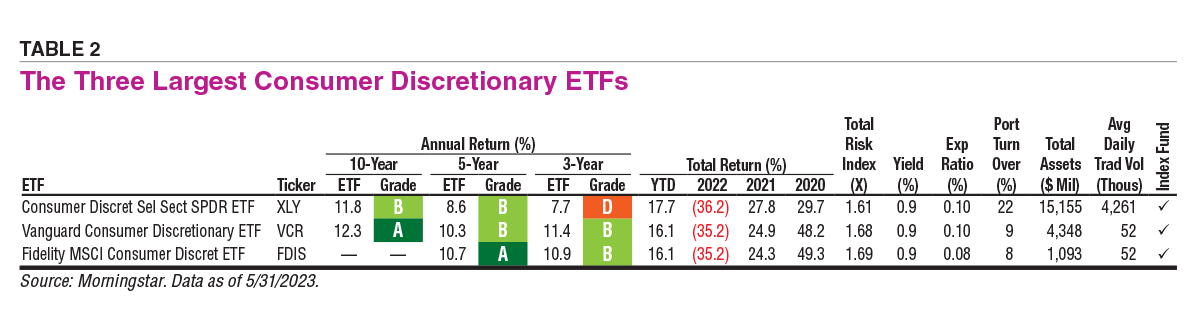
When looking at ETFs, there are a number of metrics to pay attention to. Size as measured by AUM is one useful metric because if an ETF fails to attract enough interest, it may be shuttered. Expense ratios for sector ETFs are often higher than they are for broad-market funds, but they should never be excessively high. While the historical performance of ETFs is important since most are not actively managed and follow specific sector or industry indexes, you will often see similar returns for ETFs that are following the same index. The three ETFs highlighted here were selected based on their AUM, expense ratios and respective three- and five-year annualized returns (Table 2).
Consumer Discretionary Select Sector SPDR was launched in 1998 and is one of the oldest ETFs focusing on this sector. It tracks the S&P 500 Consumer Discretionary Select Sector index. The ETF has 54 holdings, of which the top 10 holdings represent 74.3% of the portfolio.
Consumer Discretionary Select Sector SPDR is the largest ETF that we examined for this sector, at $15.2 billion in AUM. The expense ratio of 0.10% is below the category average, giving the ETF an A+ Investor Grade of A. The ETF’s three-year annualized return is 7.7% and its five-year annualized return is 8.6%. These returns equate to grades of D and B, respectively. As of the end of May, the ETF was up 17.7% for the year, giving the ETF a year-to-date Grade of A.
Vanguard Consumer Discretionary was launched in 2004. The ETF tracks the investment performance of the MSCI U.S. Investable Market Consumer Discretionary 25/50 index, a benchmark of large-, mid- and small-cap U.S. stocks in the consumer discretionary sector. It has 310 holdings, of which the top 10 holdings represent 59.3% of the portfolio.
Vanguard Consumer Discretionary is the second-largest ETF that we examined for this sector, at $4.4 billion in AUM. The ETF has an expense ratio of 0.10%, which is below the category average, giving the ETF a grade of A. The ETF’s three-year annualized return is 11.4% and its five-year annualized return is 10.3%. These returns equate to grades of B for both returns. As of the end of May, the ETF was up 16.1% for the year, giving the ETF a year-to-date Grade of A.
Fidelity MSCI Consumer Discretionary was created in 2013, following the MSCI USA Investable Market Consumer Discretionary index. The ETF has 302 holdings, with 61.8% of the portfolio making up the top 10 holdings.
The ETF has had steady annualized performance, returning 10.9% per year on a three-year basis and 10.7% on a five-year basis for ETF grades of B and A, respectively. This is the smallest of the ETFs analyzed, at $1.1 billion in AUM. The expense ratio is the lowest of the three ETFs, at 0.08%, giving the stock a grade of A.
The consumer discretionary sector has shown remarkable performance so far in 2023, rebounding after a poor 2022 when it fell by over 35%. This sector is greatly affected by macroeconomic cycles, meaning as the economy strengthens or deteriorates, so does this sector.
Investors have many choices within this sector and industry to invest in individual stocks or to use ETFs to gain exposure. As always, it is important to consider your risk tolerance, goals and time horizon when making financial decisions.
Industry Focus

Portfolio Strategies


JOHN L from NJ posted over 3 years ago:
You need to log in as a registered AAII user before commenting.
Log InCreate an account