



Featured Tickers:
The information technology sector has been the third-best-performing sector year to date in the S&P 500 index through August 11, 2023. The sector has rebounded strongly following an abysmal 2022, when S&P 500 stocks in this sector lost over 28%.
Information technology encompasses a wide range of businesses involved in technology development, manufacturing, IT services, data management and more. The information technology sector is an integral part the modern economy.
Digging deeper into the information technology sector, a few industries are significantly contributing to the sector’s returns this year. The semiconductors & semiconductor equipment industry in particular has performed strongly in 2023. This industry group encompasses companies involved in various aspects of the semiconductor industry, including the design, manufacture and distribution of semiconductors and semiconductor equipment. The industry is vital to modern technology, as semiconductors are fundamental components of electronic devices like computers, smartphones, consumer electronics, industrial equipment and more.
The strong push in 2023 has been somewhat attributable to the hype of artificial intelligence (AI). Semiconductor chipsets are the main component needed to fuel the increased concentration of AI technology and products. Additionally, a return of demand for automotive chips has aided in limiting revenue declines for semiconductor companies.
The semiconductor industry has experienced continued disruption and other issues like many other industries. As interest rates increased, reductions in consumer spending and supply chain shortages caused significant problems in the macroeconomy. However, with price stability returning as inflation begins to curtail, coupled with reduced supply chain disruptions, there is optimism that positive trends in the macroeconomic environment have positioned the industry for a strong second half of 2023, with continued growth in 2024 and beyond.
The ETF Route to Semiconductors
Exchange-traded funds (ETFs) are an option for investors who want exposure to the semiconductor universe of stocks but are looking to diversify their holdings instead of investing in one or two stocks. ETFs don’t have back-end loads, redemption fees or other restrictions on selling like some sector- and industry-based mutual funds have.
When looking at ETFs, there are a number of metrics to pay attention to. Size—measured by assets under management (AUM)—is a useful metric because if an ETF fails to attract enough interest, it may be shuttered. Expense ratios for industry-specific ETFs are often higher than they are for broad-market funds, but they should never be excessively high.
While there are many semiconductor ETFs that could be examined, we chose to set the AUM minimum threshold at $200 million. ETFs under this threshold can be viable investment options, but volume can be significantly lower, which might make buying or selling positions more challenging. Additionally, funds that use leverage to provide double or triple the return of their underlying index or follow inverse strategies (they rise in price when the underlying index falls) were excluded from consideration. These funds are designed to be held for short periods of time, often just one day.
The ETFs highlighted in this commentary—VanEck Semiconductor ETF  (SMH), iShares Semiconductor ETF (SOXX), SPDR S&P Semiconductor ETF (XSD), First Trust Nasdaq Semiconductor ETF (FTXL) and Invesco Dynamic Semiconductors ETF (PSI)—were selected based on their AUM, along with the general strategy of the fund.
Always keep in mind that ETF analysis involves more than just looking at total return. Performance relative to peers, the ETF’s volatility, the composition of the fund, the strategy used, expenses and size are all important factors. Proper diversification is also very important; you need to seek out the fund or security that best fulfills your diversification needs. Furthermore, look at the fund’s portfolio, the index it is designed to follow and the weighting strategy used. An ETF’s risk cannot be judged by its name alone.
The Top Semiconductor ETFs
Table 1 shows return data and grades for the funds; additional data and grades can be found in the ETF Evaluator at AAII.com by typing a ticker or name into the search box.

Semiconductor ETFs are among the best-performing technology sector ETFs, and all ETFs, this year. The top five semiconductor-focused ETFs, ranked by total assets under management (AUM), have each gained at least 37% year to date as of July 31, 2023, with two of the five returning over 50%.
VanEck Semiconductor has the best year-to-date performance of the five ETFs, soaring 58.1%. The “worst-performing” semiconductor ETF of the group is SPDR S&P Semiconductor, up an impressive 37.1%. In comparison, the large-cap SPDR S&P 500 ETF Trust (SPY) has returned 20.6% over the same period.
Although all five ETFs are index funds, each follows a different index as its respective benchmark. Index funds are designed to mimic the performance of an index, such as the S&P 500, with the amounts invested in each security proportional to its representation in the index that the fund tracks.
By investing in an ETF that follows an index, investors are exposed to more companies than if they were to only purchase a handful of stocks. Additionally, investors are exposed to different universes of stocks. Understanding the underlying index and strategy used for the ETF’s construction is important to determine which ETF meets your investment goals and risk tolerance.
For example, VanEck Semiconductor follows the MVIS US Listed Semiconductor 25 index. This index tracks the performance of the 25 largest and most liquid U.S. exchange-listed companies in the semiconductor industry in a modified market-capitalizaton-weighted strategy. The largest companies have the most impact when utilizing a market-cap-weighted approach. For example, Nvidia Corp. (NVDA) accounts for 20.3% of the ETF’s portfolio, while Taiwan Semiconductor Manufacturing Co. Ltd. (TSM) is a distant second with a 10.7% weighting.
This compares to SPDR S&P Semiconductor, which tracks the S&P Semiconductors Select Industry index. The index uses an equal-weighted strategy and is composed of the 38 S&P 500 companies classified in the semiconductor subindustry according to the Global Industry Classification Standard (GICS). An equal-weight approach means that all stocks in the index or ETF have the same weight, meaning the smaller companies (by market cap) have the same impact on the overall performance as the larger companies do. Macom Technology Solutions Holdings Inc. (MTSI) is the largest holding by percentage weight, accounting for 3.5% of the portfolio. Semtech Corp. (SMTC) is second at 3.4%.
iShares Semiconductor follows an adjusted market-cap-weighting approach. First Trust Nasdaq Semiconductor follows an index that weights based on cash flow after profitability and price momentum factors are taken into account. Invesco Dynamic Semiconductors uses a modified equal-weighting approach that considers each stock’s underlying fundamentals.
All five ETFs have annualized return grades of A for the three- and five-year periods and four have A grades for the 10-year period. The A–F grades are assigned based on the percentile rank of the return compared to that of all funds in the same category. An A is awarded for returns that are in the top 20% for all funds in the investment category, and F is assigned to stocks ranking in the lowest 20%.
The 10-year performance of these ETFs is what stands out the most: All four of the selected ETFs with 10 years of performance data have annualized returns in excess of 23% over that period. This is more than 10 percentage points above the SPDR S&P 500’s return of 12.6% over the same period. First Trust Nasdaq Semiconductor was launched in September 2016, and thus is lacking a 10-year history.
However, impressive returns do not come without volatility—the total risk index for these featured ETFs is significantly higher than most funds. Four of the five ETFs featured in Table 1 have total risk indexes over 2.00, compared to SPDR S&P 500 at only 1.20. The total risk index is measured by the standard deviation of a fund’s return divided by the standard deviation of return for the average fund. Standard deviation is a measure of return volatility computed using monthly returns for the last three years. A value of 1.00 is average risk, values above 1.00 are riskier than average and values below 1.00 are less risky than average.
The increased risk can be seen best by looking at the individual total returns for the past three years, with the 2023 year-to-date performance for all five of the ETFs more than two times the S&P 500’s return through July 2023. Looking at the 2022 returns, you can see this risk at play in a down market, as these semiconductor ETFs significantly underperformed the S&P 500.
A high risk index does not necessarily mean that there is a higher likelihood of incurring a loss. Measures of volatility can be both negative and positive, with periods of significant underperformance as well as periods of outperformance. Certain industries are more stable, generating consistent periods of returns regardless of the macroeconomic environment. As with most of the technology industry, the semiconductors & semiconductor equipment industry is much more cyclical in nature. This leads to increased volatility, with those aforementioned periods of boom and bust by the companies (and therefore the ETFs that hold the respective companies).
Top Graded Semiconductor Stocks
We compiled a list of the top 10 holdings by portfolio weight for each of the five ETFs, then sorted the list to find the top 10 highest-ranking stocks based on their individual Scores and Grades for earnings estimates revisions, growth, quality, value and momentum. (Higher scores are better and are given higher grades.)
Twelve stocks were in the top 10 holdings for several of the semiconductor ETFs, with five stocks held in four of the five ETFs examined.
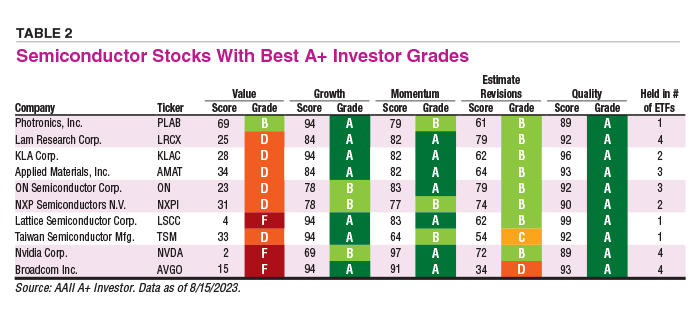
Table 2 shows the 10 stocks with the best scores, ranked by their total combined score across the five factors. Of these, six appeared in at least two ETFs’ top 10 holdings. As we previously discussed, the ETFs all follow different indexes and have different components and weightings.
Photronics Inc.
Photronics Inc. (PLAB) had the best A+ Investor Scores of the group. However, the company only appears in the top 10 holdings of Invesco Dynamic Semiconductors ETF.
Photronics is a manufacturer of integrated circuit (IC) and flat panel display (FPD) photomasks. The company sells its manufactured components to semiconductor designers and manufacturers and manufacturers of FPDs. Photronics operates approximately 11 manufacturing facilities: Three are located in the U.S., three in Taiwan, two in China, two in Europe and one in Korea.
What particularly separates Photronics from the other stocks in Table 2 is its higher Value Grade and Score. The stock’s score of 69 is in the value range, which is a grade of B. Contributing to the score is Photronics’ extremely low ratio of enterprise value to earnings before interest, taxes, depreciation and amortization (EV/EBITDA) of 2.5. This ranks in the cheapest 8% of all stocks. Additionally, the stock has a low price-to-free-cash-flow (P/CF) ratio of 9.3 versus the information technology sector median of 24.8. Photronics’ price-to-free-cash-flow ratio also ranks in the cheapest 30% of all stocks.
Lam Research Corp.
Lam Research Corp. (LRCX) is the second-highest-ranked stock based on its composite score. It appears in the top 10 holdings of four of the five top semiconductor ETFs. Lam Research is one of the largest semiconductor companies in the world, with a market cap of over $88 billion.
Lam Research is a supplier of wafer fabrication equipment and services to the semiconductor industry. The company designs, manufactures, markets, refurbishes and services semiconductor processing equipment used in the fabrication of ICs. Its products and services are designed to help its customers build devices used in a variety of electronic products.
As of August 15, 2023, Lam Research has a Growth Score of 84, for a Growth Grade of A (very strong). The stock has seen consistent revenue growth, increasing by a 9.5% annualized rate over the past five years. This compares to the information technology sector median of 9.3%. The company has increased sales in four of the past five consecutive years and has generated positive annual cash from operations over the same period.
KLA Corp.
KLA Corp. (KLAC) was the third-highest-ranked stock. It can be found in the top 10 holdings of two of the top five semiconductor ETFs.
KLA Corp. supplies process control and yield management solutions and services to the semiconductor and related electronics industries. The company offers a portfolio of inspection and metrology products along with related services, software and other offerings. During fabrication, semiconductors must be inspected for defects and proper dimensions. As chips become smaller and more complex, a higher level of inspection is necessary to meet expectations. This gives KLA Corp. a competitive advantage, as the growing market for semiconductors should provide plenty of revenue sources for the company.
KLA Corp. currently has a Quality Score of 96, giving the stock a Quality Grade of A (very strong). The Quality Grade is the percentile rank of the average of the percentile ranks of return on assets (ROA), return on invested capital (ROIC), gross profit relative to assets, buyback yield, change in total liabilities to assets, ratio of accruals to assets, Z double prime bankruptcy risk (Z) score and F-Score.
The score is variable, meaning it can consider all eight measures or, should any of the eight measures not be valid, the remaining measures that are valid. To be assigned a Quality Score, stocks must have a valid (non-null) measure and corresponding ranking for at least four of the eight quality measures.
The stock’s two highest attributes under the Quality Score are its return on assets of 24.8%, ranking in the 97th percentile, and its buyback yield of 7.7%, ranking in the 94th percentile. These are higher than the information technology sector medians of –3.5% for return on assets and –1.4% for buyback yield.
Conclusion
The information technology sector has recovered dramatically from its horrendous performance relative to the rest of the S&P 500 sectors in 2022. The sector is recovering from an increased cost of capital due to rising rates, supply chain disruptions and the high inflation environment.
Semiconductors & semiconductor equipment has been a top-performing industry within the information technology sector, stemming from demand for AI technology, automotive chips and improved macroeconomic conditions. The strong industry performance can be seen in the top-performing semiconductor ETFs. These ETFs exhibit diverse strategies, offering exposure to various segments of the semiconductor market, with returns largely driven by the sector’s cyclical nature and heightened volatility.
Investors have many choices within this sector and industry to invest in individual stocks or to use ETFs to gain exposure. As always, it is important to consider your risk tolerance, goals and time horizon when making financial decisions.

Related
Quarterly Mutual Fund Update
Tech and Global Action Drive Second-Quarter Returns
Related

Industry Focus
Auto & Truck Stocks Shift Into High Gear
Discussion
FREE REPORT

Get your free copy of our special
report analyzing the tech stocks
most likely to outperform the
market.
ROBERT A from NC posted over 3 years ago:
JEAN H from IL posted over 3 years ago:
ROBERT A from NC posted over 3 years ago:
You need to log in as a registered AAII user before commenting.
Log InCreate an account