



Related

ETFs and Mutual Funds
Investors breathed a sigh of relief as equity mutual funds and exchange-traded funds (ETFs) landed in positive territory for the third consecutive quarter.

Investors breathed a sigh of relief as equity mutual funds and exchange-traded funds (ETFs) landed in positive territory for the third consecutive quarter. According to LSEG Lipper Research, the average equity fund returned 4.4% for the quarter ended June 30, 2023. The widely followed S&P 500 index rebounded by 16.9% during the first half of the year, and the Invesco QQQ Trust ETF (QQQ), which tracks the technology-heavy Nasdaq-100 index, is up 39.2% over the same period. Macro factors—such as slowing inflation, debt ceiling resolution and the Federal Reserve holding rates steady in June—helped bolster investors’ confidence. Not too shabby!
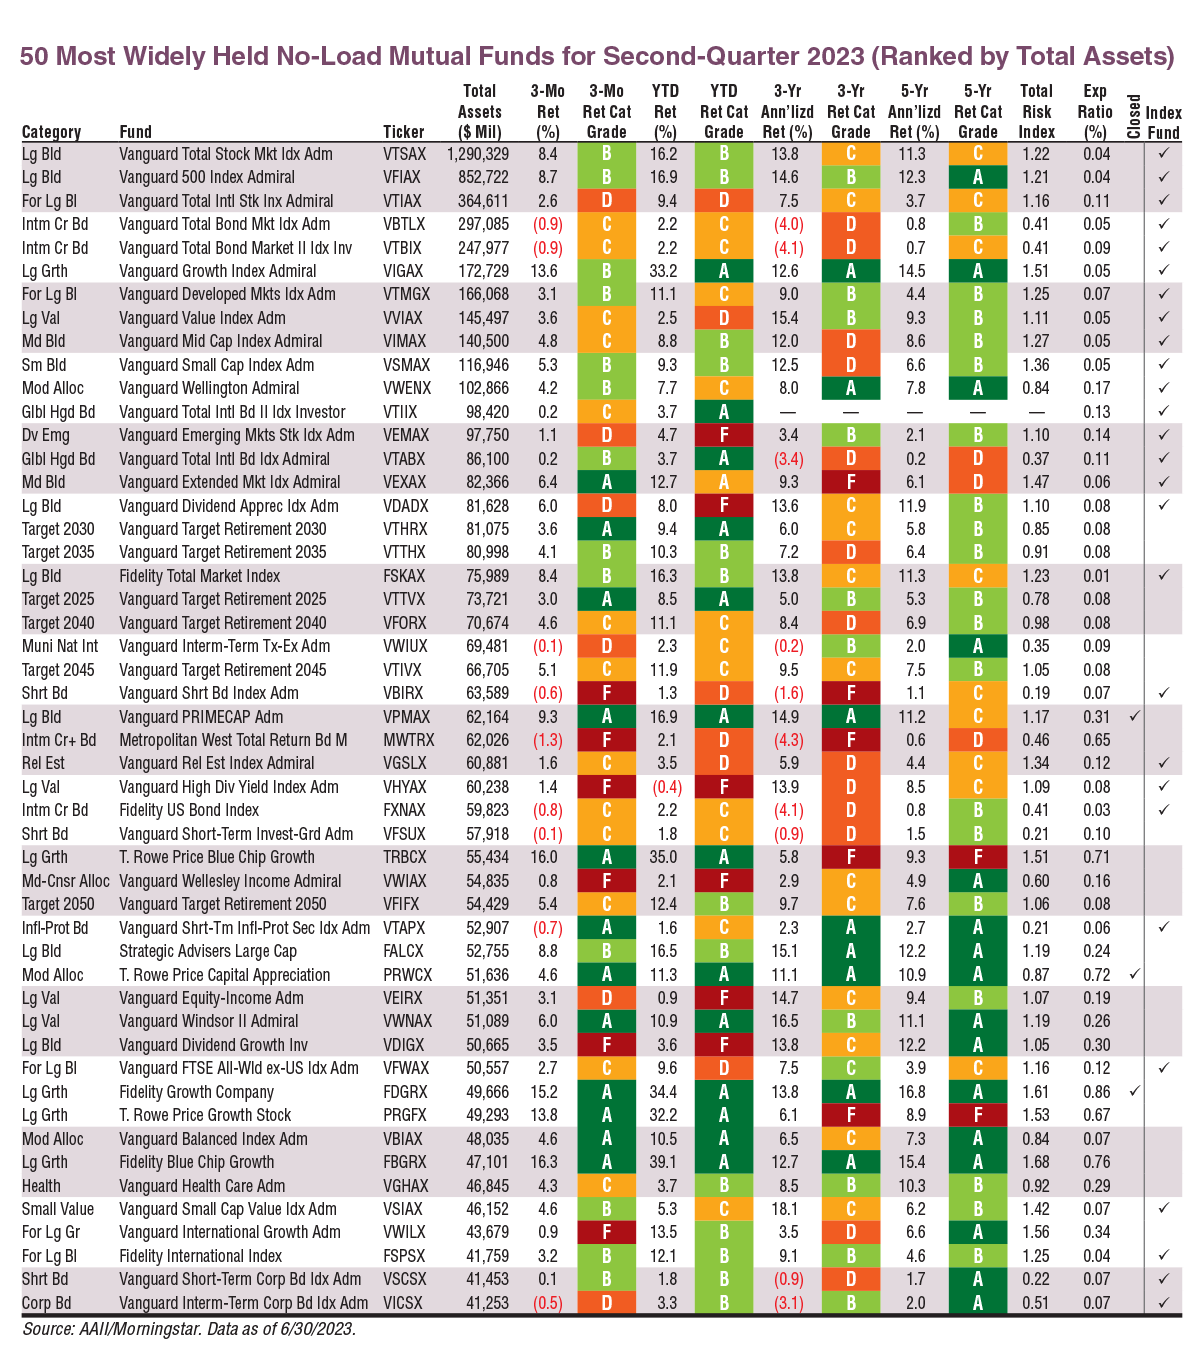
The returns observed among the 50 most widely held no-load mutual funds are representative of where investors see opportunity in the market. Growth is still roaring. The highest performer on this table is the Fidelity Blue Chip Growth fund  (FBGRX), up 16.3% during the second quarter. Notably, it was the highest performer of the widely held mutual funds for the first quarter as well. Major holdings include six of what has been coined the “Magnificent Seven” technology companies: Apple Inc. (AAPL), Microsoft Corp. (MSFT), Nvidia Corp. (NVDA), Amazon.com Inc. (AMZN), Alphabet Inc. (GOOGL) and Meta Platforms Inc. (META). Tesla Inc. (TSLA) is also a Magnificent Seven stock and is held by this fund, but at a significantly lower percentage than these six.
The Magnificent Seven now account for approximately 30% of the S&P 500. Not only have investors in large-cap growth funds benefited from this concentration, but so have those holding large-blend funds such as the Vanguard Total Stock Market Index Admiral fund (VTSAX). With $1.29 trillion in total assets, Vanguard Total Stock Market remains the most widely held fund. The ever-popular large-blend Vanguard 500 Index Admiral fund (VFIAX) held its place as the second most widely held fund.
The 50 most widely held mutual funds are the funds most likely to be owned by individual investors, allowing you to note the performance of funds held by fellow individual investors. All but nine posted positive returns during the second quarter. The laggards were spread across multiple fixed-income categories.
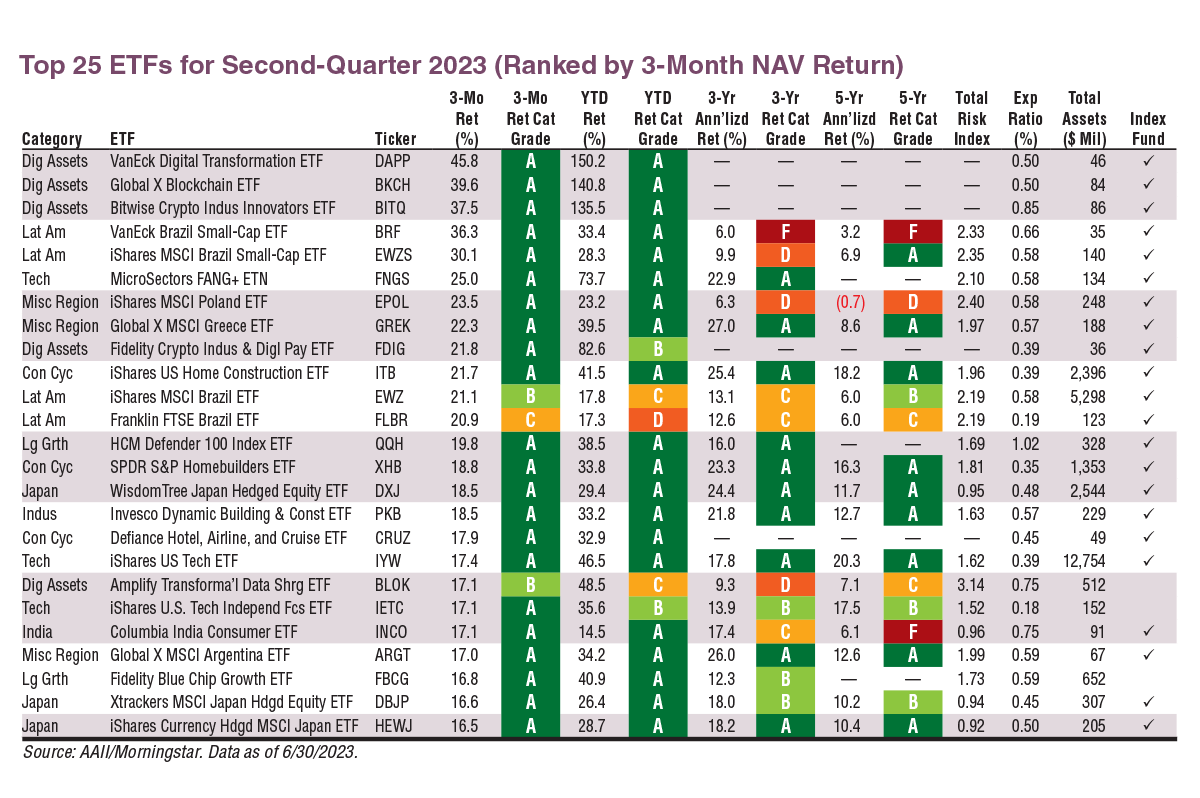
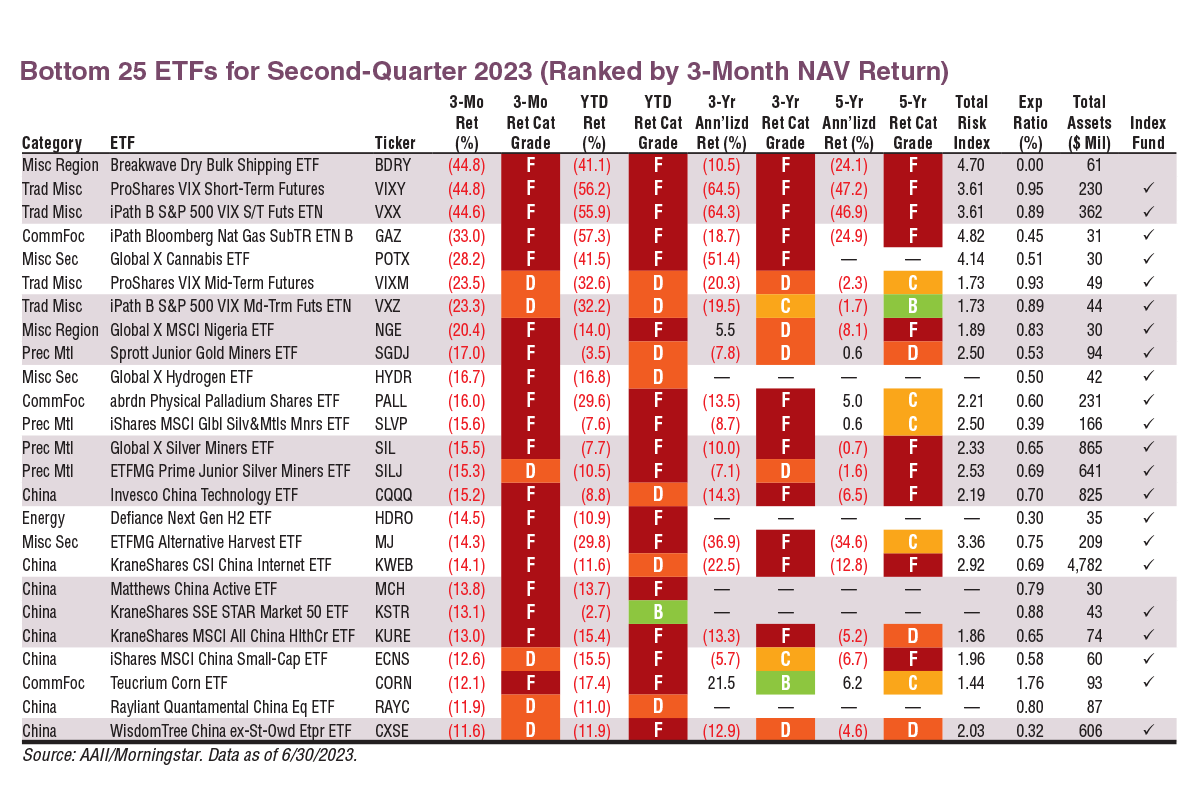
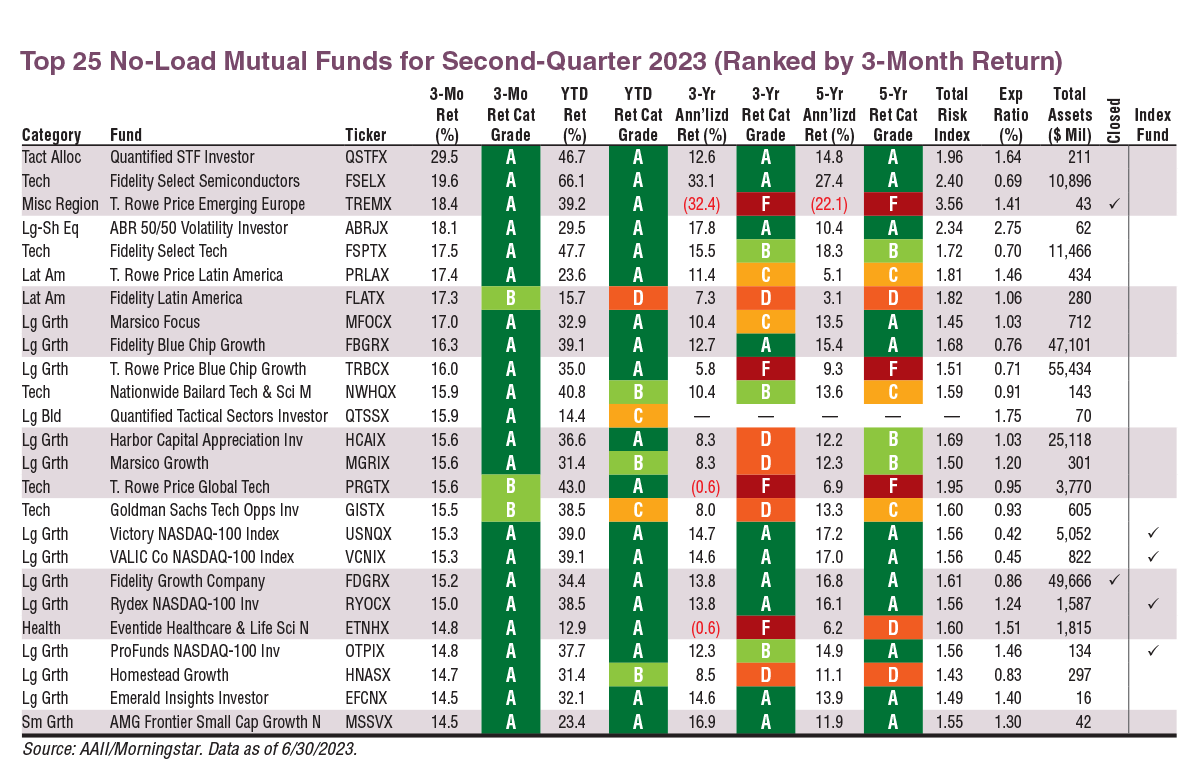
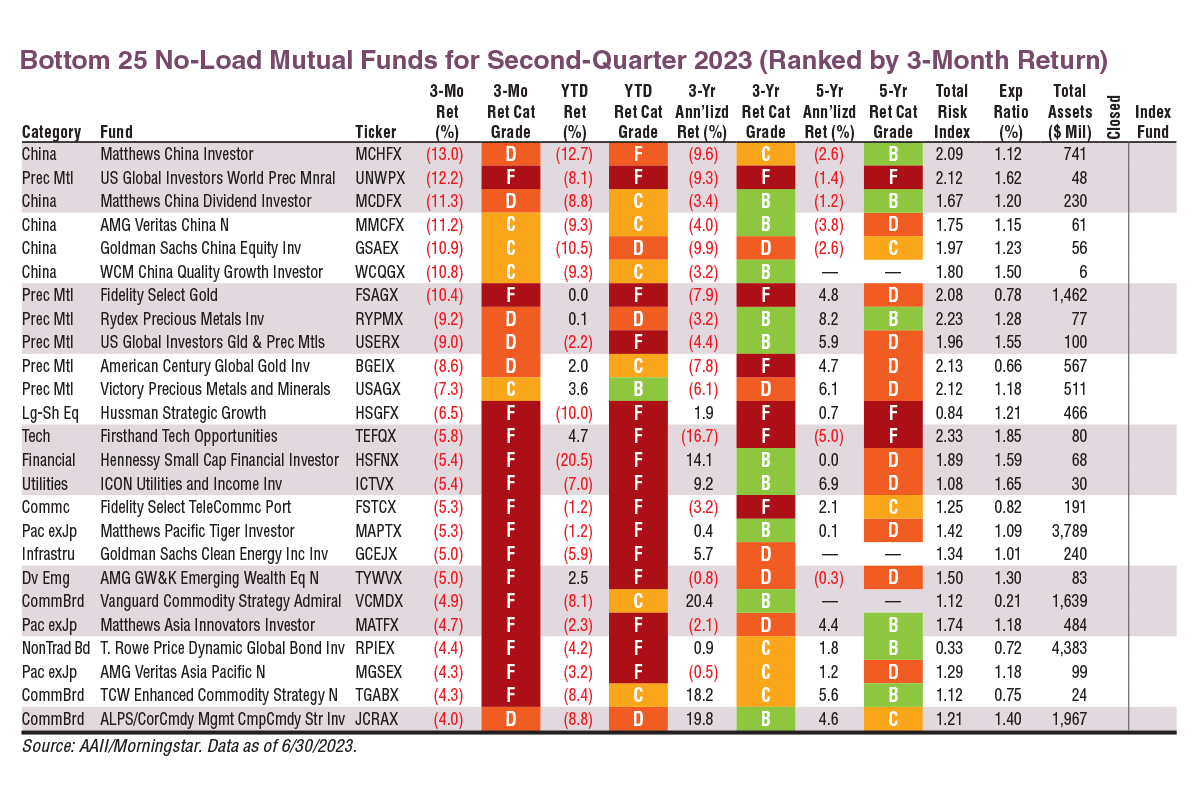
The top and bottom 25 ETFs and mutual funds ranked by three-month performance shown below represent the best- and worst-performing funds from each respective universe. For inclusion, mutual funds are required to have at least $5 million of assets under management (AUM), have a minimum initial purchase amount of no more than $50,000 and not charge any front- or back-end loads. ETFs are required to have AUM of at least $25 million and an average daily trading volume of at least 5,000 shares. Leveraged and inverse (profits from a decline in an underlying benchmark) funds are excluded.
Download the Excel spreadsheet for the Top 25 ETFs.
Download the Excel spreadsheet for the Bottom 25 ETFs.
Download the Excel spreadsheet of the Top 25 Mutual Funds.
Download the Excel spreadsheet for the Bottom 25 Mutual Funds.
Download the Excel spreadsheet for the Widely Held Funds.
Leading the top mutual fund group is the Quantified STF Investor fund (QSTFX). This is an actively managed fund that seeks to outperform the tech-heavy Nasdaq-100. It returned 29.5% for the second quarter and 46.7% for the first half of 2023.
The Fidelity Select Semiconductors fund (FSELX) ranks second in terms of performance with a 19.6% return in the second quarter. (It is up 66.1% for the first half of 2023.) Semiconductors have shone brightly as artificial intelligence (AI) has gained attention with the race for adoption underway. Big bets on the likes of Nvidia and Marvell Technology Inc. (MRVL) fueled the fund’s returns, as can be evidenced in its total risk index of 2.40.
The total risk index compares the standard deviation of returns for a given fund with that of all funds in the universe—bond, stock, domestic, international, allocation, commodities and alternative. The average risk index is 1.00. A value below 1.00 indicates lower risk relative to the overall universe. Three years of monthly returns are required to calculate this number.
The title of this article hints that international-themed mutual funds and ETFs were key contributors to top and bottom performance in the second quarter. As you read on, you will see that this largely plays out for emerging markets. The T. Rowe Price Emerging Europe fund (TREMX) took the third-place spot with an 18.4% three-month return. Its total risk index is 3.56, making it more than 3.5 times as risky as the average mutual fund. Closed to new investors, it focuses on opportunities in emerging Europe, including Eastern Europe. The top countries it is allocated to are Greece, Poland, Hungary and Kazakhstan.
Fidelity Select Technology fund (FSPTX) landed in the top five for a second time this year with a three-month return of 17.5%. Performance was likely driven by the top four holdings of Apple, Microsoft, Nvidia and Marvell Technology.
Two best-performing mutual funds within the top 10 focus on Latin America. The T. Rowe Price Latin America fund (PRLAX) and the Fidelity Latin America fund (FLATX) offered heat with three-month returns of 17.4% and 17.3%, respectively. Their year-to-date returns are 23.6% and 15.7%, respectively. These are the only two Latin-America-focused mutual funds that made the top 25 list. So, why is Latin America popular right now? Political and trade tensions with China have caused infrastructure investment and production to pivot to Latin America—especially Brazil and Mexico. Mexico has ramped up exports and the region is expected to continue to benefit as a supplier of commodities as the global transition to renewable energy continues. All funds mentioned thus far are actively managed.
On the ETF side, digital asset funds skyrocketed this past quarter and year to date. The two-year-old VanEck Digital Transformation ETF (DAPP) took the top spot among ETFs. It boasts returns of 45.8% for the second quarter and 150.2% year to date. It is followed by the Global X Blockchain ETF (BKCH) and the Bitwise Crypto Industry Innovators ETF (BITQ).
The fiesta continued with two Brazil ETFs rounding out the five best-performing ETFs for the second quarter of 2023, and two additional making the top 25 list. For the quarter, the VanEck Brazil Small-Cap ETF (BRF) is up 36.3% and the iShares MSCI Brazil Small-Cap ETF (EWZS) took the fifth spot with a strong 30.1% gain.
At number six is the MicroSectors FANG+ ETN (FNGS), which returned 25.0% for the second quarter following a 39.0% jump in the first quarter. Exchange-traded notes (ETNs) are unsecured debt obligations that track an index and strive to pay the return on the index less management fees. MicroSectors FANG+ offers investors a return based on changes in the level of the New York Stock Exchange (NYSE) FANG+ index. This index includes 10 growth stocks from the tech and consumer discretionary sectors. Note that the FANG acronym originally stood for Facebook (now Meta Platforms), Amazon, Netflix and Google (now Alphabet).
With high returns comes volatility and risk. The total risk index values for the three best-performing ETFs are not available since they have been in existence for less than three years. The total risk values for VanEck Brazil Small-Cap and iShares MSCI Brazil Small-Cap are 2.33 and 2.35, respectively.
Country-specific ETFs did well in the second quarter. The list of top 25 ETFs includes the iShares MSCI Poland ETF (EPOL) and the Global X MSCI Greece ETF (GREK). They returned 23.5% and 22.3%, respectively. Investors also showed interest in Japan and India. Three ETFs focused on Japan and one focused on India made the top-performers list. Macro factors are influencing this interest. Japanese companies have been making shareholder-friendly improvements and are putting excess cash to use, while India is making changes in its manufacturing industries with an eye to becoming an attractive alternative to Asian supply chains. Returns for the recent quarter are attractive and the risk is reasonable. The WisdomTree Japan Hedged Equity ETF (DXJ) posted an 18.5% return for the quarter, earning it an A+ Investor Grade of A compared to other funds in its category. Its total risk index is 0.95, which is slightly below average. This ETF also received grades of A for its one-year, three-year and five-year returns. The Columbia India Consumer ETF (INCO) has a grade of A for its three-month return of 17.1%. For this ETF, the total risk index is 0.96.
Turning to the bottom performers, if Latin American funds are the ying of strong performers then China funds are the yang. Country-specific funds focused on China underperformed across both mutual funds and ETFs in the second quarter. Precious mining and metal funds took it on the chin too. Of the 10 worst mutual funds for the quarter, five are China-focused and five are precious metal funds.
The worst ETF performers include those focused on volatility index (VIX) futures, metals, mining and cannabis. China-focused and China-themed ETFs were also included in the bottom 25 performers.
The Breakwave Dry Bulk Shipping ETF (BDRY) is the worst-performing ETF, with a three-month return of –44.8%. Having the dubious distinction of tying it is the ProShares VIX Short-Term Futures (VIXY). Breakwave Dry Bulk Shipping’s strategy utilizes futures contracts. It seeks to provide investors with exposure to the daily change in the price of dry-bulk freight futures. The ETF does this by tracking the performance of a portfolio consisting of a three-month strip of the nearest calendar quarter of futures contracts on specified indexes that measure rates for dry-bulk shipping freight. Significant declines in shipping rates may be responsible for its poor performance in the recent period and over the last year. Breakwave Dry Bulk Shipping has one of the highest risk index values, at 4.70, among all ETFs in the tables.
Individual investors have long referenced the AAII Asset Allocation Models to help construct portfolios, The models incorporate stocks, bonds and cash as the three building blocks for a successful asset allocation strategy. Note that short-term bonds are listed as a proxy for cash but can be swapped with traditional cash equivalents like certificates of deposit (CDs) and money market funds. The three models are designed for typical investors with differing risk tolerance: aggressive, moderate and conservative.
The performance for each allocation model is based on hypothetical portfolios of mutual funds that represent each asset class. Vanguard index funds are used to limit the impact of decisions made by active managers on returns. These funds were also selected due to their low expense ratios.
Vanguard has a unique structure where many of its ETFs are offered as separate share classes of its mutual funds. You can find these funds depicted on Vanguard’s website with the language “also available as an ETF” for the admiral share class versions of its mutual funds.
The table below shows the mutual funds used to track the Asset Allocation Models’ returns. Along with quarterly returns, the table reports the year-to-date, three-year and five-year returns and their category grades. We include two additional perspectives for each asset class group. The first is the category average return of similar mutual funds (e.g., the black rows with large-cap blend, mid-cap blend, etc.). The second is the performance of similar Vanguard ETFs.
Download the Excel spreadsheet for the AAII Asset Allocation Models Funds and ETFs.
This quarterly update is backward-looking but it is useful to review the trends for mutual funds and ETFs each quarter. Trends change. Growth, tech and country-specific funds also did well during the first quarter. Underperformers changed between the first and second quarter: Banking, energy and biotechnology have been replaced by China and precious metals as laggards. Clearly, country fund performance represents geopolitical shifts underway.
Investors can research funds further at AAII.com. Data for more than 23,000 mutual funds and 3,200 ETFs is updated monthly and available to all AAII members. To access our mutual fund and ETF guides, screens of top performers, comparison tools and more, visit www.aaii.com/funds and www.aaii.com/etfs.
ETFs and Mutual Funds

ETFs and Mutual Funds

PRISM Wealth-Building Process

WILLIAM S from ID posted over 3 years ago:
CHARLES R from IL posted over 3 years ago:
You need to log in as a registered AAII user before commenting.
Log InCreate an account