



Featured Tickers:
The month of September and the third quarter are in the rearview mirror but were not kind to equity investors. Historically the worst month for the stock market, September 2023 was true to form, with the S&P 500 index, the Nasdaq composite and the Dow Jones industrial average all taking a tumble for the month. Some of the usual suspects were responsible for the September pullback: the Federal Reserve’s affirmation of “higher for longer” interest rates, woes over a potential government shutdown and increasing oil prices. The 10-year U.S. Treasury bond, a key bond market benchmark, rose from 3.86% to 4.58% during the third quarter.
Year to date, the communications services, information technology and consumer discretionary S&P 500 sectors lead the board with gains of 40.3%, 34.7% and 26.7%, respectively. The group of seven technology stocks known as the Magnificent Seven have contributed significantly to these sector gains thus far in 2023. Those companies are Alphabet Inc.  (GOOGL), Amazon.com Inc. (AMZN), Apple Inc. (AAPL), Meta Platforms Inc. (META), Microsoft Corp. (MSFT), Nvidia Corp. (NVDA) and Tesla Inc. (TSLA)
Investor Opportunity and Fund Returns
The 50 most widely held mutual funds are the funds most likely to be owned by individual investors. The returns observed among the 50 most widely held no-load mutual funds are representative of where investors see opportunity in the market. We track them specifically because of the large amount of interest in them.
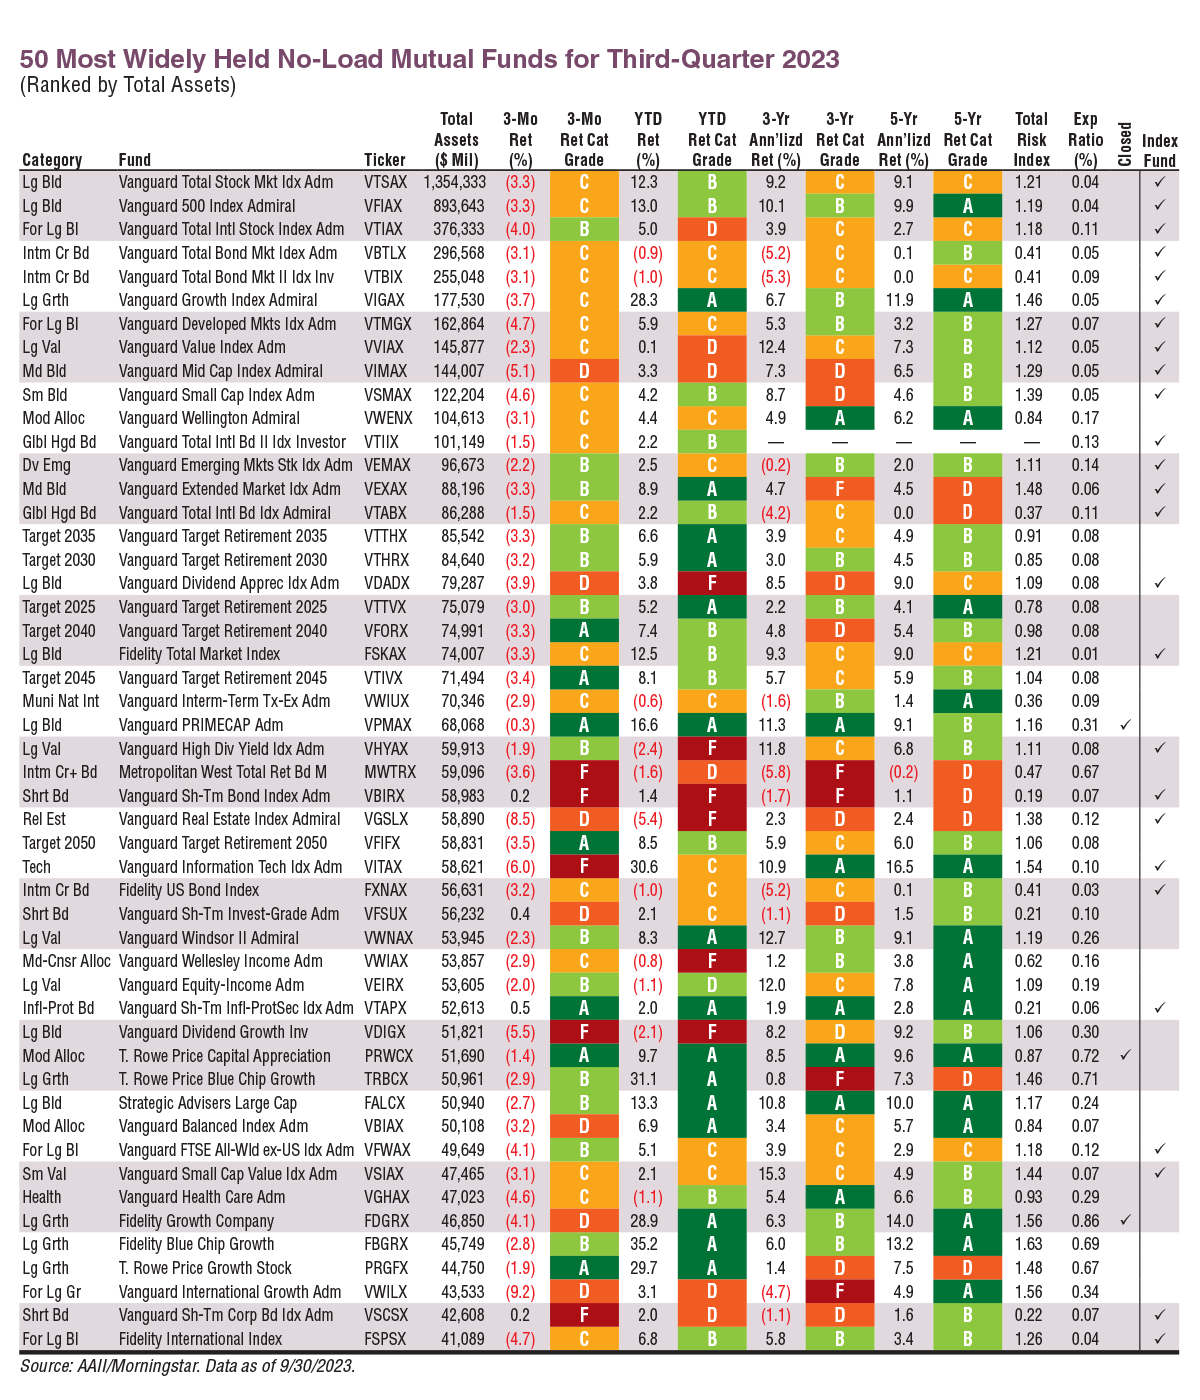
Download the Excel spreadsheet for 50 Most Widely Held No-Load Mutual Funds for Third-Quarter 2023.
Growth has cooled from its iron hot returns in the first and second quarters. The highest performer in this table is the Vanguard Short-Term Inflation-Protected Securities Index fund (VTAPX), up 0.5% during the third quarter. In the previous two quarters of this year, the Fidelity Blue Chip Growth fund (FBGRX), was the leader among the widely held mutual funds. For the third quarter, it lost 2.8%. However, it still boasts a 35.2% year-to-date return, which equates to an A+ Investor Grade of A, implying outperformance relative to other funds in its category.
The only other funds in this group with gains for the third quarter are three short-term bond mutual funds, and they are barely in positive territory. Short-term bond funds invest in bonds with shorter durations. Duration is a measure of interest rate sensitivity and thus these funds are less sensitive to changes in interest rates.
The largest laggard among the 50 most widely held funds is the Vanguard Real Estate Index Admiral fund (VGSLX). It declined by 8.5% during the third quarter. This fund invests in a variety of real estate investment trusts (REITs). Investors like REITs for their dividend payments. Typically, 90% of the income generated is paid to shareholders in the form of dividends. REITs rely on debt to fund development and acquisitions. However, rising rates may increase debt loads, thus reducing the effect of external growth. Additionally, investors may choose safer options that offer income.
Many of us hold the Vanguard Total Stock Market Index Admiral fund (VTSAX) and the Vanguard 500 Index Admiral fund (VFIAX) in our portfolios. These continue to be the most widely held mutual funds, but they both posted returns of negative 3.3% during the third quarter. This is a stark downturn from the second quarter, when their returns were up 8.4% and 8.7%, respectively.
The top and bottom 25 exchange-traded funds (ETFs) and mutual funds ranked by three-month performance shown in the following tables represent the best- and worst-performing funds from each respective universe. For inclusion, mutual funds are required to have at least $5 million of assets under management (AUM), have a minimum initial purchase amount of no more than $50,000 and not charge any front- or back-end loads. ETFs are required to have AUM of at least $25 million and an average daily trading volume of at least 5,000 shares. Leveraged and inverse (profits from a decline in an underlying benchmark) funds are excluded.
Energy Powers Third-Quarter Results
What a difference a couple of quarters make! Fifteen of the top 25 ETFs for the third quarter are focused on energy. The S&P 500 energy sector clocked a double-digit gain of 12.2% for the quarter, propelled by rising oil prices.
Oil prices have been influenced by Saudi Arabia and its cohorts holding down production to boost prices. Tight oil storage capacity in Cushing, Oklahoma, has also been cited as contributing to the elevated prices.
The energy sector is good at being a comeback kid. After being the best-performing sector in 2022, energy funds faltered during the first quarter of 2023. At that time, weakening oil and gas prices contributed to the energy sector’s chill as U.S. recession concerns came to the forefront. Notably, utilities suffered the worst returns among the S&P sectors, with a 9.3% loss.
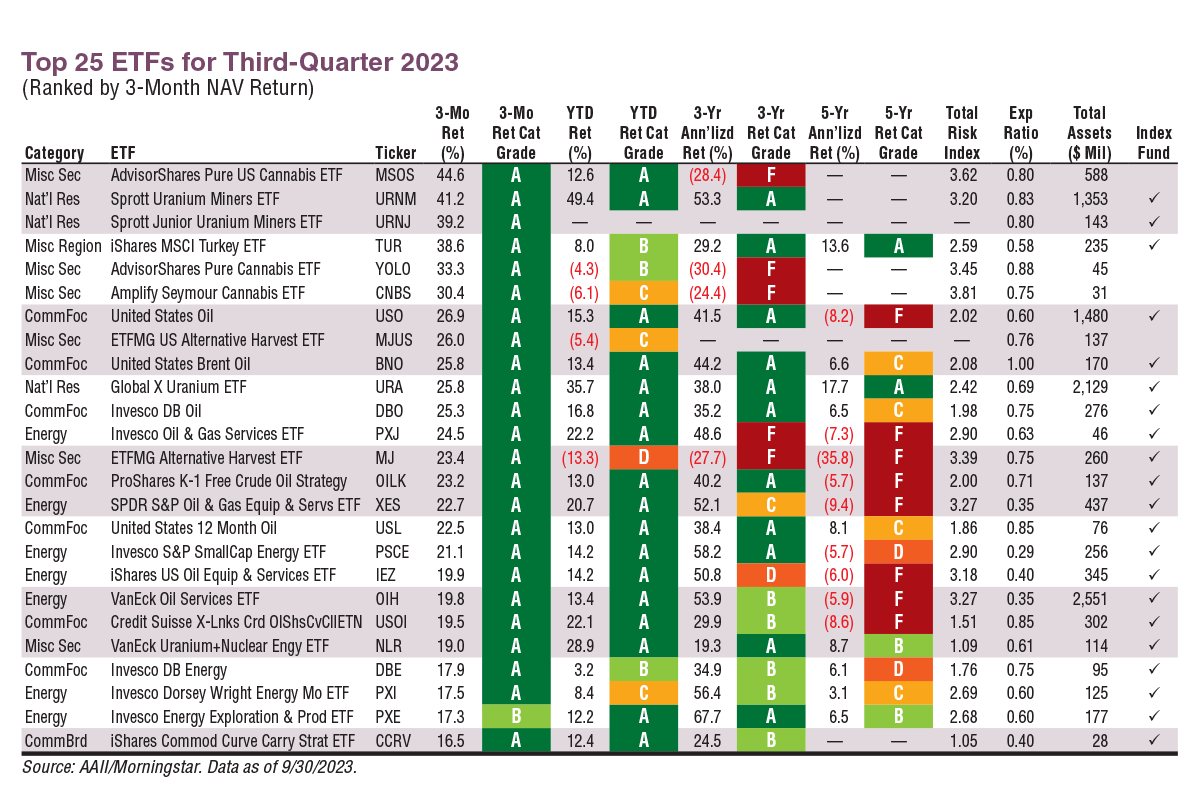
Download the Excel spreadsheet for Top 25 ETFs for Third-Quarter 2023.
ETFs High on Possible Cannabis Law Change
Energy may have been the headline, but the top 25 ETFs uncovered some interesting results. A national news headline that spiked controversy is the Biden administration’s proposal to move cannabis to a less severe category of illegal drugs at the federal level. A bill is also on the table that would ease banking restrictions for state-licensed cannabis operators. Politics aside, investors were stoked about this possibility. AdvisorShares Pure US Cannabis ETF (MSOS) nabbed the top ETF spot with a 44.6% return for the third quarter. The ETF holds cannabis operators that are generating cash flow. The AdvisorShares Pure Cannabis ETF (YOLO) and the Amplify Seymour Cannabis ETF (CNBS) also rode this trend and were in the top 10.
Uranium prices are on the rise and three ETFs that hold uranium miners, explorers and developers are also among the best-performing ETFs for the quarter. The Sprott Junior Uranium Miners ETF (URNJ) took the second-place spot with a three-month return of 41.2%, the Global X Uranium ETF (URA) returned 25.8% and the VanEck Uranium + Nuclear Energy ETF (NLR) returned 19.0%. All earned A+ Investor Grades of A for the three-month period.
The United States Oil ETF (USO) was the top-performing energy ETF with a 26.9% return. Energy ETF returns ranged from this to 17.3% for the Invesco Energy Exploration & Production ETF (PXE), which was the only energy-themed ETF to earn an A+ Investor Grade of B for its three-month return compared to its category average. United States Oil has a slightly different strategy than other ETFs with oil in their name. It invests in futures contracts that are long dated rather than those that expire next month. It does this with an eye for hedging fluctuations in near-term oil prices.
Clean and Green Withers
Turning to the laggards, the Invesco Solar ETF (TAN) was the biggest laggard with a third-quarter tumble of 27.0%. This drop equated to an A+ Investor Grade of F. What is interesting about this particular ETF is that for the first 10 months of 2019, it was the year’s biggest gainer among all ETFs. Solar demand has dampened share performance across the industry, particularly in the U.S. where subdued rooftop demand is expected to continue into 2024. Clean energy companies may depend upon debt to finance capital-intensive projects more so than their more established traditional energy peers. Higher interest rates mean less profit for investors.
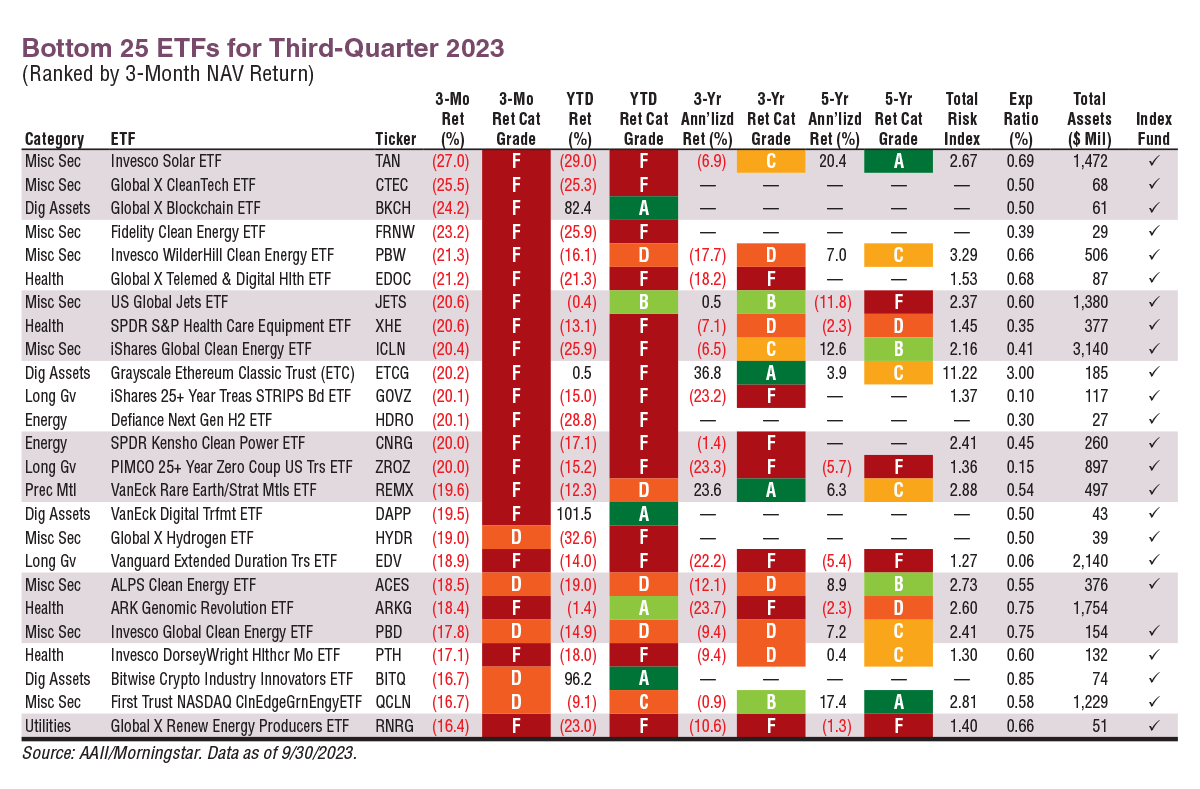
Download the Excel spreadsheet for Bottom 25 ETFs for Third-Quarter 2023.
Energy-Themed Mutual Funds Gush
Energy dominated mutual funds as well. Out of the top performers, 10 were energy themed. Leading the top mutual fund group is the Rydex Energy Services Investor fund (RYVIX). This is an actively managed fund that holds hefty weightings of well-known energy behemoths such as Schlumberger Ltd. (SLB), Baker Hughes Co. (BKR) and Halliburton Co. (HAL). It returned 20.5% for the third quarter, with an A+ Investor Grade of A compared to other funds in its category.
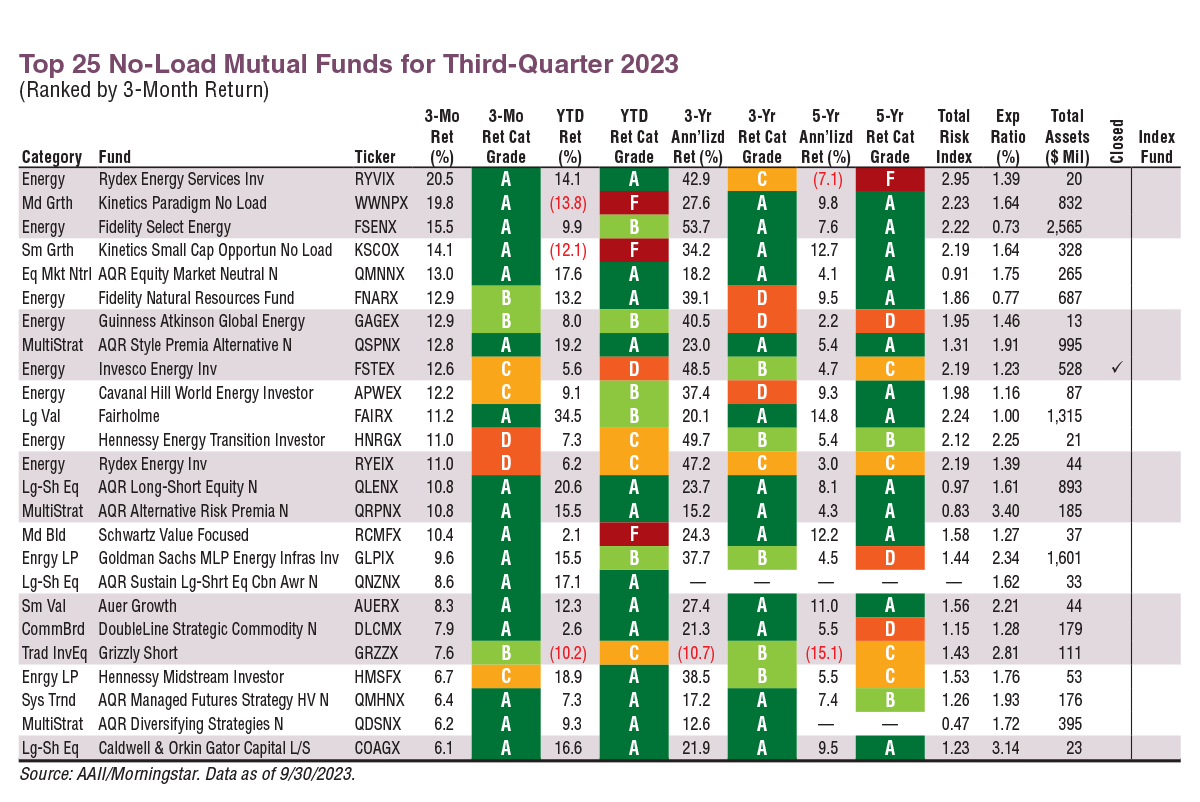
Download the Excel spreadsheet for Top 25 No-Load Mutual Funds for Third-Quarter 2023.
Actively managed strategies shone last quarter, taking a number of top spots. The Kinetics Paradigm No Load fund (WWNPX) took the second spot with a return of 19.8%, which translates to a grade of A. This fund is a U.S.-focused global all-cap fund comprising investments in misunderstood or underappreciated companies whose businesses exhibit long product life cycles and have substantial barriers to entry. The AQR Equity Market Neutral fund (QMNNX) returned 13.0% for the quarter, earning an A+ Investor Grade of A. Per AQR Capital Management’s website, the fund seeks to deliver positive absolute returns by taking long and short positions in equity and equity-related instruments that, based on proprietary quantitative models, are deemed to be either undervalued (and likely to increase in price) or overvalued (and likely to decrease in price).
Clean Energy and Long-Term Treasurys Lag
Themes that played out for bottom-performing ETFs were also prevalent for mutual funds in the bottom ranks. The Goldman Sachs Clean Energy Income Investor fund (GCEJX) was the worst performer with an A+ Investor Grade of F and a return of –19.7%. A trend depicted in the bottom-performing mutual funds this quarter is that of poor long-term government bond performance. Since March 2022, investors wanting to lock in yields have stampeded into long-term Treasury bonds by investing in both mutual funds and ETFs. This is despite the bad performance. Long-term bonds (10 years or greater) are more sensitive to interest rate changes than either short- or intermediate-term bonds. Investors piling into these funds may think that a recession is possible, quelling inflation expectations and resulting in falling long-term yields.
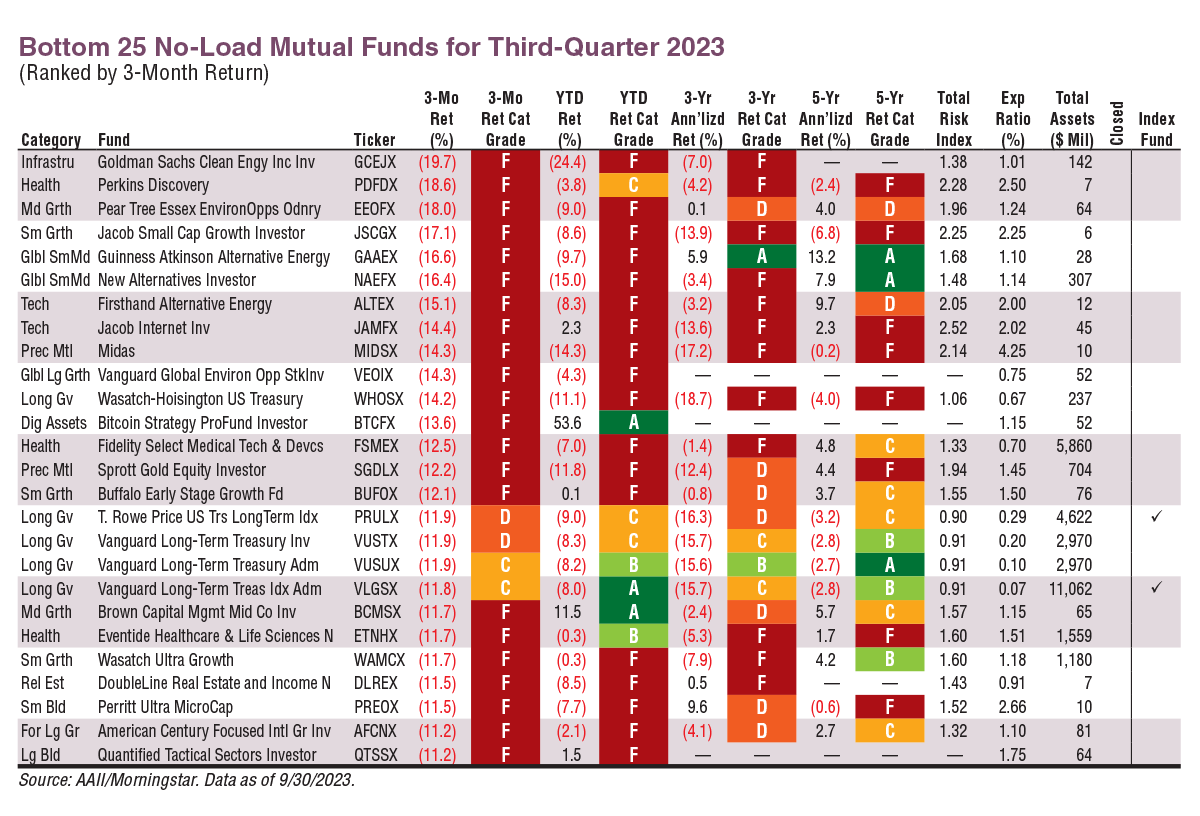
Download the Excel spreadsheet for Bottom 25 No-Load Mutual Funds for Third-Quarter 2023.
The Wasatch-Hoisington U.S. Treasury fund (WHOSX) was in negative territory with a 14.2% loss and an A+ Investor Grade of F for the quarter. The T. Rowe Price U.S. Treasury Long Term Index fund (PRULX) and the Vanguard Long-Term Treasury Investor fund (VUSTX) both lost 11.9%, with A+ Investor Grades of D.
AAII Asset Allocation Models
Individual investors have long referenced AAII’s Asset Allocation Models to help construct portfolios. The models incorporate stocks, bonds and cash as the three building blocks for a successful asset allocation strategy. Note that short-term bonds are listed as a proxy for cash but can be swapped with traditional cash equivalents like certificates of deposit (CDs) and money market funds. The three models are designed for typical investors with differing risk tolerance: aggressive, moderate and conservative.
The performance for each allocation model is based on hypothetical portfolios of mutual funds that represent each asset class. Except for the Vanguard Short-Term Treasury fund (VFISX), Vanguard index funds are used to limit the impact of decisions made by active managers on returns. Vanguard Short-Term Treasury is not an index fund and is part of Vanguard’s investor class of mutual funds. These funds were also selected due to their low expense ratios.
Many of Vanguard’s ETFs are offered as separate share classes of its mutual funds. You can find these funds depicted on Vanguard’s website with the language “also available as an ETF” for the admiral share class versions of its mutual funds. The table below shows the mutual funds used to track the AAII Asset Allocation Models’ returns. We include two additional perspectives for each asset class group. The first is the category average return of similar mutual funds (e.g., the black rows with large-cap blend, mid-cap blend, etc.). The second is the performance of similar Vanguard ETFs.
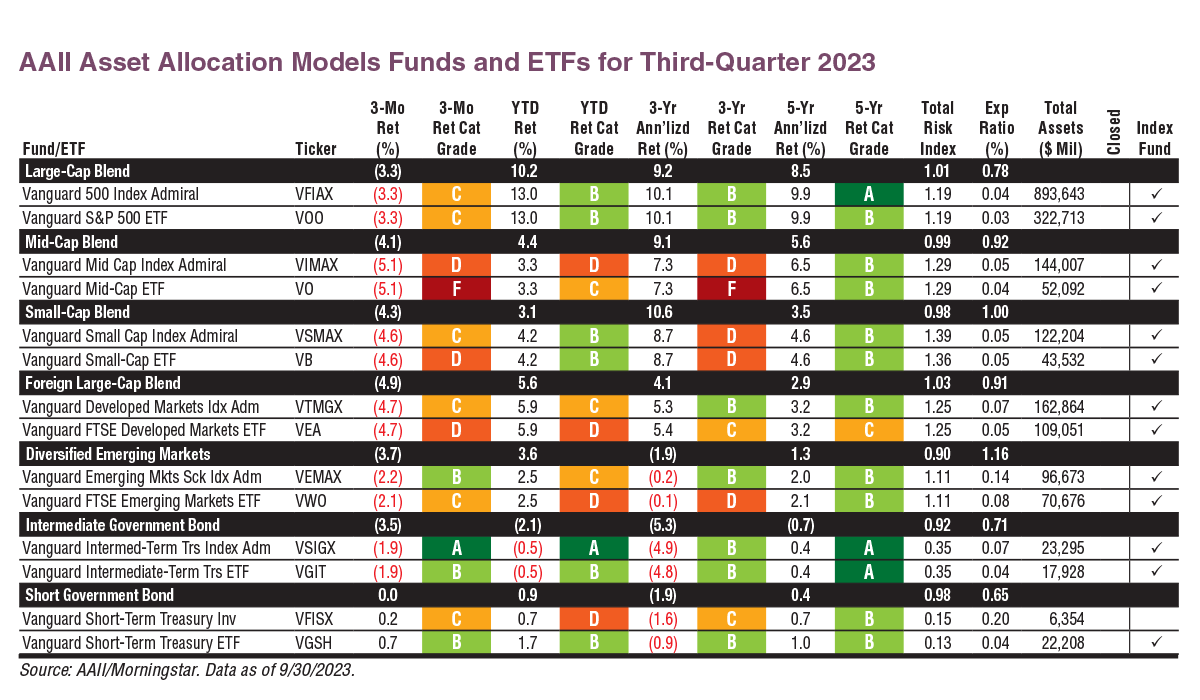
Download the Excel spreadsheet for AAII Asset Allocation Models Funds and ETFs for Third-Quarter 2023.
Final Thoughts: Mind the Risk
The top and bottom performers for both mutual funds and ETFs were largely thematic or focused on specific sectors. This means that most are not very diversified, which is reflected in their high total risk index values. For example, the average total risk index for top-performing ETFs is 2.55 and is 1.66 for top-performing mutual funds. The total risk index compares the standard deviation of returns for a given fund with that of all funds in the universe—bond, stock, domestic, international, allocation, commodities and alternative. The average risk index is 1.00. A value below 1.00 indicates lower risk relative to the overall universe. Three years of monthly returns are required to calculate this number.
As a reminder, investors can research funds further at AAII.com. Data for more than 23,000 mutual funds and 3,200 ETFs is updated monthly and available to all AAII members. To access our mutual fund and ETF guides, screens of top performers, comparison tools and more, visit www.aaii.com/funds and www.aaii.com/etfs.

Related

Quarterly Mutual Fund Update
Tech and Global Action Drive Second-Quarter Returns
Related

ETFs and Mutual Funds
Comparing and Contrasting Real Estate Funds
Discussion
FREE REPORT

Get your free copy of our special
report analyzing the tech stocks
most likely to outperform the
market.
JOHN L from NJ posted over 2 years ago:
ROBERT A from NC posted over 2 years ago:
You need to log in as a registered AAII user before commenting.
Log InCreate an account