



Related

AAII How-To
Mutual funds and ETFs provide a low-cost entry point to real estate and allow investment in a variety of real estate markets.

There are a multitude of ways to invest in real estate, usually categorized as residential or nonresidential. Residential properties include single-family homes, apartments, condominiums and manufactured housing. Nonresidential covers office properties, shopping centers, warehouses and specialty properties such as factories or agriculture. Investments are further differentiated as either public or private.
Ownership in the private market will typically involve a direct investment such as buying a property or lending money to a purchaser. Direct investments can be solely owned or indirectly owned. A common arrangement for an indirect investment is a general partner providing property management services with investors who are limited partners. The public market includes ownership of real estate investment trusts (REITs), real estate operating companies (REOCs) and mortgage-backed securities (MBS).
By definition, real estate is indivisible and illiquid. One advantage of public investments is that the property remains undivided while simultaneously allowing investors divided ownership. For this reason, public real estate investments are liquid and allow investors to diversify their portfolios with more and different types of properties.
Pricing for real estate is opaque, and the normal price discovery mechanism that stocks and bonds utilize does not exist. Transaction costs can be significant, and many direct investments require property management. Investing through a mutual fund or exchange-traded fund (ETF) is a way to sidestep most of these issues. Mutual funds and ETFs especially provide a low-cost entry point and allow investment in a variety of real estate markets.
Real estate has been a rough neighborhood lately. Case in point, the Vanguard Real Estate ETF  (VNQ) fell 26.2% in 2022. Returns for this ETF have started to recover, up 2.1% year to date through the end of April.
Although real estate mutual funds and ETFs inked red in 2022, the reasons to invest in real estate as an asset class have not changed. Investors have long looked to real estate to provide income and capital appreciation, but diversification and tax benefits top the list.
Since they are public, equity REITs are often used as a proxy for the real estate asset class. Correlation measures the degree to which the returns of two different asset classes move together. A correlation of 1.0 means they move perfectly in lockstep in the same direction, and a value of –1.0 means they move in opposite directions. Per the “Stocks, Bonds, Bills, and Inflation” 2023 Ibbotson Yearbook (Kroll, 2023), equity REITs were not perfectly correlated with either small- or large-cap stocks from 1972 through 2022. Equity REITs had an even lower, though still positive, correlation with long-term corporate and government bonds. As a hedge, they have a slight negative correlation with inflation over the same time frame.
Corporate tax advantages are synonymous with REITs, which can avoid income taxes. Thus, investors escape the double taxation of having both corporate earnings and dividends taxed. In turn, REITs distribute 90% or more of taxable income to shareholders that is not treated as qualified dividends.
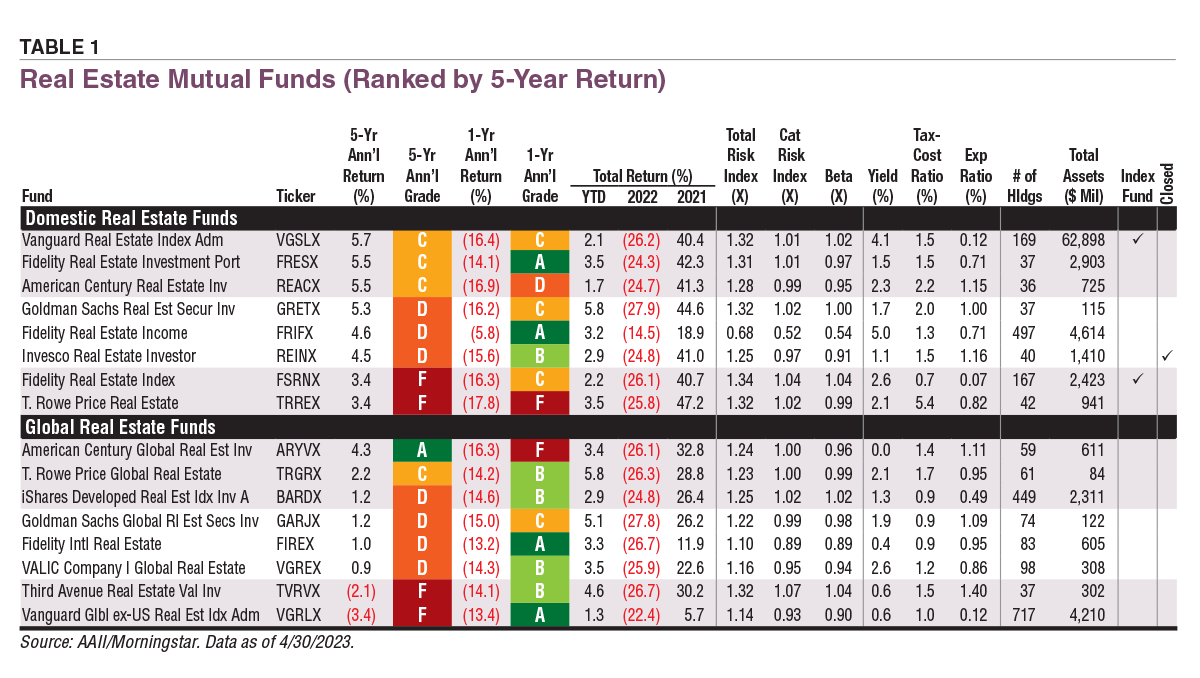
We used the A+ Investor Mutual Fund and ETF Screeners to create the lists of funds in Tables 1 and 2. Selected funds offer broad exposure and specific strategies. The remainder of this article looks at the performance of these funds, their A+ Investor grades and the tax costs investors can anticipate. The funds in Tables 1 and 2 are grouped by international and domestic categories. The universe includes 16 mutual funds and 36 ETFs. Within this group, eight mutual funds and 12 ETFs are categorized as global real estate.
Download the Excel spreadsheet of Table 1.
The tables include five-year returns, which emphasize intermediate-term performance and, importantly, both falling- and rising-interest-rate environments. In addition, one-year, year-to-date and annual returns for the past two years are provided to give more detail—including for those funds lacking a full five years of return data. Lacking historical data, funds that are less than one year old were screened out.
Our screens capture three risk measures shown in the tables. The total risk index compares the standard deviation of returns for a given fund with that of all funds in the universe—bond, stock, domestic, international and alternative asset classes. The average risk index is 1.00. A value below 1.00 indicates lower risk relative to the overall universe. The category risk index compares the standard deviation of returns for individual funds with that of peers from the same category. Again, the average risk index value is 1.00. Total and category risk figures are based on monthly returns for the last three years; ETFs in Table 2 without enough history lack this risk index data.
Beta, which measures sensitivity to market movements, is also included. A beta of 1.00 implies similar volatility to that of the overall market.
Download the Excel spreadsheet of Table 2.
The Vanguard Real Estate Index Admiral fund (VGSLX) was the highest performer of the REIT mutual funds, returning 5.7% on a five-year basis. Vanguard Real Estate Index Admiral is diversified. Its REIT investments offer exposure to multiple areas of industry and types of real estate. Holdings encompass data centers, health care facilities, multi-family residential, offices, industrial spaces, retail stores, single-family residential, telecom towers, timber and hotels and resorts. This is also a notable example of a fund that offers modest amounts of exposure to real estate operating companies, development and services.
Even in a fund with broad exposure, paying attention to the details is informative. A review of sector weights compared to the benchmark reveals that Vanguard Real Estate Index Admiral differs with significant weightings in data centers, multi-family residential and telecom towers to name a few. The fund’s one-year annual return is –16.4%. Both five-year and one-year return grades are C. In general, real estate funds suffered in 2022. Vanguard Real Estate Index Admiral was no exception and had the second-worst return of the domestic real estate funds at –26.2%. A minimum investment of $3,000 is required. The expense ratio is 0.12%, which is tied for the second lowest of the mutual funds covered here.
Vanguard Real Estate Index Admiral has a tax-cost ratio of 1.5%, while the average for the domestic group is 2.0%. The tax-cost ratio measures how much a fund’s annualized return is reduced by the taxes paid on distributions, assuming the maximum marginal tax rate. A tax-cost ratio of 0.0% indicates that the fund did not pay any taxable income or make capital gains distributions. A tax-cost ratio of 1.5% means that each year, on average, investors lost 1.5% of their assets to taxes. The way to think about this ratio is that lower is better, meaning the fund is more tax-efficient.
T. Rowe Price’s Real Estate fund (TRREX) was the worst performer among domestic real estate mutual funds. A 3.4% five-year annualized return and a –17.8% one-year loss equated to grades of F over both periods. Narrowly focused, T. Rowe Price Real Estate currently has 42 holdings. It has an expense ratio of 0.82% and a tax-cost ratio of 5.4%.
The Fidelity Real Estate Index fund (FSRNX) also has a five-year 3.4% annualized return but ranks above T. Rowe Price Real Estate in Table 1 (which is sorted by five-year returns) because its one-year loss was comparatively better, at –16.3%. Notably, Fidelity Real Estate Index has the lowest expense ratio of the mutual funds at 0.07%. This is likely due to its passive index strategy.
The other domestic Fidelity funds passing our screen, Fidelity Real Estate Investment Portfolio (FRESX) and Fidelity Real Estate Income fund (FRIFX), have better five-year annualized returns but also higher expense ratios. Both charge 0.71%, which is over 10 times higher than Fidelity Real Estate Index’s expense ratio.
Did global diversification drive better returns? Comparing the global and domestic REIT mutual funds, the short answer is no. The American Century Global Real Estate fund (ARYVX) was the top performer, with a five-year annualized return of 4.3%. This equates to an A+ Investor Grade of A. Return grades are specific to the time period measured, as is evidenced by American Century Global Real Estate’s one-year return grade of F, attributable to its worse-than-category-average performance of –16.3%.
Not only is it the second-most concentrated in the global category with 59 holdings, but American Century Global Real Estate has the second-highest expense ratio and third-highest tax-cost ratio, at 1.11% and 1.4%, respectively. Another interesting point about American Century Global Real Estate is that 72% of its holdings are based in the U.S. A breakdown by country reveals that the U.K. and Australia account for the second-highest allocations at 6% each. Japan is a close third at 5%.
The Vanguard Global ex-U.S. Real Estate Index fund (VGRLX) had the worst performance of the global real estate mutual funds for the five-year period, losing –3.4%. This equates to an A+ Investor Grade of F. On a one-year annual basis, the fund received an A for holding up better than its category peers with a loss of 13.4%. Going back to 2021 when all funds in the table posted positive returns, Vanguard Global ex-U.S. Real Estate lagged with a 5.7% gain. For global funds passing our screen, Vanguard Global ex-U.S. Real Estate is among the most tax-efficient. Four of the eight global real estate mutual funds have higher tax-cost ratios than this fund’s 1.0%, and the average tax-cost ratio for global funds covered here is 1.2%.
The top-performing real estate ETF is iShares Residential and Multisector Real Estate ETF with the catchy ticker REZ. It earned an A+ Investor Grade of A for its five-year annual return of 7.7%. The ETF fared much worse over the past 12 months, falling by –17.1% for a below-category-average return grade of D. Investors will pay a 0.48% expense ratio and give up 1.1% of returns in taxes. Year to date, iShares Residential and Multisector Real Estate has posted a 6.6% return. Checking its 45 holdings revealed that its second-largest allocation is to health care REITs, with the largest allocation being to multi-family real estate.
An ETF worth mentioning is the Vanguard Real Estate ETF (VNQ). Largest by assets under management (AUM), it is the counterpart of the Vanguard Real Estate Index Admiral mutual fund. The ETF has a slightly better tax-cost ratio of 1.3% than the mutual fund’s 1.5%.
The bottom domestic ETF with a five-year history is the VanEck Mortgage REIT ETF (MORT). VanEck Mortgage REIT takes a different approach than iShares Residential and Multisector Real Estate and Vanguard Real Estate. It tracks the overall performance of U.S. mortgage REITs and has a concentrated portfolio, with just 28 holdings. For five-year and one-year periods, it returned –4.7% and –17.0%, respectively. Year to date, the fund is still down with a 1.4% loss. In 2021, which was a stellar year for real estate funds, VanEck Mortgage REIT had the lowest return of all domestic ETFs shown in Table 2. It also has the highest tax-cost ratio of the domestic ETFs, at 4.0%. The average tax-cost ratio for the domestic real estate ETFs is 1.6%.
A similar strategy is used by the iShares Mortgage Real Estate Capped ETF (REM). It offers exposure to the U.S. residential and commercial mortgage real estate sectors. It also did poorly over the same periods, receiving A+ Investor Grades of F and D for returns of –4.2% and –17.1% over the five-year and one-year periods, respectively.
Returns for the global real estate ETFs were much worse than their domestic cousins on both a five-year and one-year annualized basis. For the five-year period, only three global ETFs had positive returns. So far for 2023, all the global real estate ETFs in the table have positive returns. Topping the list is the iShares Global REIT ETF (REET) with a five-year A+ Investor Grade of A based on a 2.6% return. The tax-cost ratio of 1.1% is slightly under the average of 1.2% for global real estate ETFs. Geographical concentration is prevalent in iShares Global REIT. Nearly 70% of its exposure is to the U.S., with approximately 7.6% coming from Japan as the next largest country allocation. The U.K. represents 4.6% with Australia at 4.2%.
Of the global ETFs with a five-year record, the Global X SuperDividend REIT ETF (SRET) lags the group with a –6.0% annualized return. Nuanced in strategy, Global X SuperDividend REIT focuses on REIT yield and assets that it determines to be among the 30 highest-yielding REITs in the world. For eight years, it has made monthly distributions. The majority of its assets are allocated in the U.S. (53.7%) with Singapore representing the second-highest weighting at 17.9%, followed by Australia at 7.2%. The tax-cost and expense ratios are 3.0% and 0.59%, respectively.
Vanguard Global ex-U.S. Real Estate ETF (VNQI) is the counterpart of the Vanguard Global ex-U.S. Real Estate Index Admiral mutual fund. The ETF returned –3.5% and –13.5% over the last five- and one-year periods, respectively. Positives for this ETF are a low expense ratio of 0.12% and a below-average tax-cost ratio of 1.0%. Geographic distribution for Vanguard Global ex-U.S. Real Estate is different than the two previously highlighted global real estate ETFs. The Pacific region is weighted at 52.2%, with Europe making up 22.1% of the portfolio and emerging markets claiming 19.9%. North America represents a mere 2.9%.
Discussions about funds and ETFs in this article are focused primarily on REITs. REITs enjoy favorable corporate tax treatment as long as they pass along an adequate share of earnings directly to investors. Since dividends are taxed unfavorably relative to capital gains, investors should keep an eye on the tax-cost ratio when holding such funds in taxable accounts. Global real estate funds can offer some diversification, but a careful review of holdings and geographic weighting is needed to determine the extensiveness of non-U.S. holdings.
When considering the merits and risks of investing, keep in mind that REITs require hefty capital and typically carry big debt loads. This translates to substantial interest rate risk. The overall appeal of using mutual funds and ETFs is the ease of buying and selling, the liquidity and the relative diversification.
AAII How-To

AAII How-To


BARRY J from TX posted over 3 years ago:
John W from OH posted over 3 years ago:
You need to log in as a registered AAII user before commenting.
Log InCreate an account