

Article Highlights:
- As a bond yield decreases, its price rises at an increasing rate, whereas a bond’s price falls at a decreasing rate as its yield increases. This phenomenon is known as convexity.
- The discount rates used to determine the future value of expected coupon rates when yields rise or fall differ and, as a result, have different price impacts.
- A bond with more convexity will offer you more upside if rates decrease, while promising less downside if rates increase.
The ideal sports team is one that is good at both offense and defense.
A football or soccer team, for example, needs to be able to capitalize on scoring opportunities when it has possession of the ball, but it is just as important that it fields a good defense in order to protect against attacks by the opposing team. We can apply this analogy to investing in general, and to bonds in particular.
Bond Pricing
As we saw in my November 2015 AAII Journal article, “Bond Pricing Made Simple,” a bond is a loan, where the lender receives interest payments periodically over the life of the loan. The principal is typically repaid on the maturity date, but in some examples, such as mortgage-backed securities, it may instead be repaid over the life of the loan. While some loans may carry a floating rate of interest, the interest rate on a bond is usually fixed. Therefore, we can determine the price of the loan using the “sum of perpetuities” formula (Formula 1, which is shown in the accompanying box below).
By applying the sum of perpetuities formula, we can easily price a bond at a given yield. A 10-year bond that pays 10% interest semiannually, for example, will have a price of par, or $1,000, when the market yield is 10%. If yields increase to 11%, however, the bond’s price will decrease:
P = ($50 ÷ 0.055) + [($1,000 – ($50 ÷ 0.055)) × (1 + 0.055)–20]
P = $940.25
For bonds with a semiannual coupon, we divide the annual coupon payment by two to determine the semiannual payment. We also multiply the number of years by two to determine the number of coupon payments to be paid. In our example, the investor holding a 10-year bond paying 10% ($100) annually would receive a $50 coupon payment every six months for 20 periods. Similarly, we divide the annual yield by two to get the semiannual yield. To calculate the bond price at a yield of 11%, for example, each cash flow must be discounted at 11% ÷ 2, or 5.5%.
In my April 2016 AAII Journal article, “Interest Rate Sensitivity and Bond Pricing,” we saw that when the prevailing yield changes we can also calculate the new price using the “relative coupons” method (Formula 2 in the box below). This formula compares the dollar coupon received on the bond in question to the coupon paid on a par bond.
For example, when the market yield is 11%, a par bond will pay $55 every six months (for a total of $110 annually). The 10% bond, on the other hand, will pay $50 every six months, so that the investor holding it will be at a comparative disadvantage to the investor in the 11% par bond in the amount of $5 every six months for 10 years.
We can calculate the present value of the stream of $5 shortfall amounts as follows:
D = (–$5 ÷ 0.055) × [1 – (1 + 0.055)–20]
D = $59.75
While a par bond has a price of $1,000, the 10% bond will have a price that is $59.75 lower, or $940.25, matching the price we calculated above.
(A par bond is one where the coupon is the same as the current market yield. If the bond pays a coupon that is higher than the market yield, its price will be higher than, or at a premium to, par. Conversely, if the bond’s coupon is lower than the market yield, its price will be lower than, or at a discount to, par.)
Bond Formulas
Formula 1: Sum of Perpetuities
The price of a bullet bond—a bond’s whose principal can solely be paid at maturity, meaning the bond cannot be called prior to maturity by the issuer—with periodic interest payments can be calculated by using the values of the perpetuities and the principal bullet:

Where,
-
P is the bond price
-
C is the periodic coupon payment,
-
y is the periodic yield,
-
B is the principal bullet at maturity, and
-
T is the number of periods to maturity.
Note that the valuation expression for a perpetuity will be undefined at a yield equal to zero. When the yield to maturity is zero, the price of a bond is simply the undiscounted sum of all coupons and principal cash flows. In practice the formula can be used, however, if an infinitesimally small yield is assumed, such as 0.00001%.
Formula 2: Relative Coupons
The value of the difference in cash from holding a bond with an interest rate below or above the current market yield can be determined by using a long and short perpetuity:
S
D = — (1 – (1 + y)–T)
y
Where,
-
D is the premium or discount—that is, difference in value from a par bond,
-
y is the periodic yield,
-
T is the number of periods to maturity, and
-
S is the periodic cash flow shortfall (or increase)—that is, the difference between the coupon paid on a par bond and a bond with a lower (or higher) interest rate.
Bond Convexity
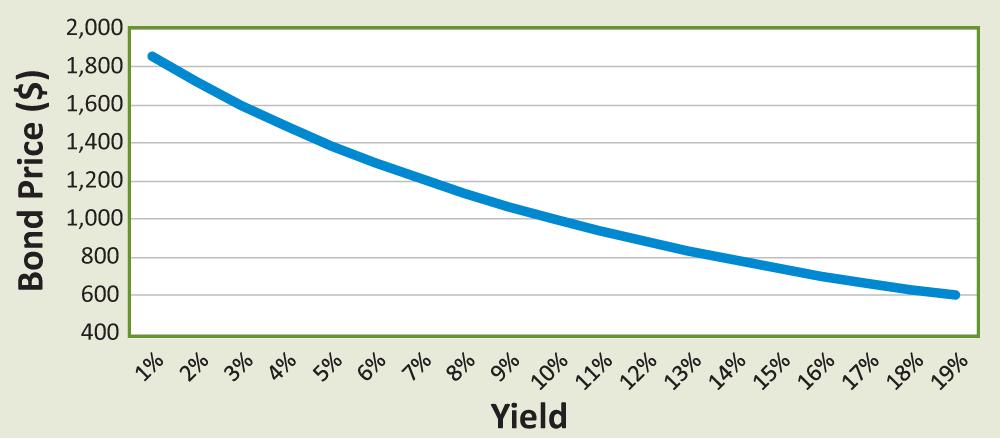
If we calculate a bond’s price at different yields, we would notice that the relationship between the change in the assumed yield and the corresponding change in the bond’s price is curved, rather than linear. For example, suppose we were to calculate the price of our 10% bond at a range of yields from 1% to 19%, we could plot the yields and the prices as shown in Figure 1.
At a yield of 10%, the bond has a price of $1,000 (par), as shown in Table 1. At a yield of 1%, the bond’s price increases to $1,854.43, whereas at a yield of 19% the bond’s price decreases to $603.44. Clearly, the price changes are asymmetric: a yield decrease of 9% results in a price increase of $854.43, while a yield increase of 9% results in a significantly smaller price decrease of $396.56.
Table 1. Changes in a Bond’s Price
| This table shows how the price a of a 10-year bond with a 10% coupon changes at different yields. The column labeled “Delta ($)” shows the absolute change in price. As you can see, the bond’s price rises at an increasing rate as yields fall, but declines at a decreasing rate as yields rise. This characteristic causes the line in Figure 1 to be convex instead of straight. | |||
| Yield (%) | Change (%) | Price ($) | |
|---|---|---|---|
| Delta ($) | |||
| 1 | -9 | 1,854.43 | 854.43 |
| 2 | -8 | 1,721.82 | 721.82 |
| 3 | -7 | 1,600.90 | 600.90 |
| 4 | -6 | 1,490.54 | 490.54 |
| 5 | -5 | 1,389.73 | 389.73 |
| 6 | -4 | 1,297.55 | 297.55 |
| 7 | -3 | 1,213.19 | 213.19 |
| 8 | -2 | 1,135.90 | 135.90 |
| 9 | -1 | 1,065.04 | 65.04 |
| 10 | 0 | 1,000.00 | 0.00 |
| 11 | 1 | 940.25 | -59.75 |
| 12 | 2 | 885.30 | -114.70 |
| 13 | 3 | 834.72 | -165.28 |
| 14 | 4 | 788.12 | -211.88 |
| 15 | 5 | 745.14 | -254.86 |
| 16 | 6 | 705.46 | -294.54 |
| 17 | 7 | 668.78 | -331.22 |
| 18 | 8 | 634.86 | -365.14 |
| 19 | 9 | 603.44 | -396.56 |
As its yield decreases, the bond’s price rises at an increasing rate, whereas the bond’s price falls at a decreasing rate as its yield increases. It is this asymmetry in price changes for positive and negative changes in yield that causes the bond price/yield relationship shown in Figure 1 to be curved, a phenomenon we refer to as the bond’s positive convexity (or simply, convexity). The consequence of convexity is that if we experience a favorable change in yields (that is, a yield decrease), the bond’s price will increase by more than it would drop if we were to experience an unfavorable yield change (that is, a yield increase) of the same magnitude.
(It is worth noting that not all bonds exhibit the relationship that we have described. In an environment where interest rates decrease, some bonds, notably callable bonds and mortgage-backed securities, may experience significantly smaller price increases than their Treasury and corporate bond peers, due to the increased likelihood of them being called or prepaid, respectively. We refer to these bonds as exhibiting negative convexity.)
Why Are Bonds Convex?
If we return to our relative coupon framework, we can understand why bond prices and yields share this convex relationship. Consider our 10% bond. When yields increase to 11%, we see how the holder of the bond experiences a shortfall, relative to a par bond, of $5 each period. The impact on the bond’s price is simply the present value of the stream of $5 shortfall amounts, which totals to a drop of $59.75. Relative to par, this bond should be worth $59.75 less, resulting in a bond price of $940.25.
On the other hand, if the bond’s yield drops to 9%, the bondholder now benefits to the tune of $5 each period. When the market demands a yield of 9%, par bonds will pay $45 semiannually (for a total of $90 per year), while the 10% bond will pay $50 semiannually ($100 annually). The bondholder is, therefore, better off by $5 each semiannual period, relative to the holder of the par bond.
While the periodic $5 cash flow advantage, relative to a par bond, arising from the yield decrease is the same magnitude as the $5 shortfall that would arise in the case of a yield increase, the present value of the two cash flow streams is different because we have to discount them at different interest rates. When the yield drops to 9%, we now discount the $5 cash flow differences at 4.5% (9% annually), rather than the 5.5% (11% annually) we used previously. This results in a present value that is $65.04 above par and corresponds to a bond price of $1,065.04. It is because we use different discount rates that the positive and negative yield changes of the same magnitude have different price impacts, resulting in the convex price/yield relationship.
Offense and Defense
Comparing two bonds that exhibit the same interest rate risk, as measured by modified duration, a bond with more convexity will offer you more upside if rates decrease, while promising less downside if rates increase. In other words, it will have a higher price than its less convex peer following a change in yield, regardless of whether rates have increased or decreased. As a result, if you expect interest rates to change, convexity is a desirable characteristic for a bond. Indeed, investors will tend to pay a premium for bonds with convexity, all other things being equal. On the other hand, if you do not expect yields to change, you may be better off investing in bonds with less convexity and that are, therefore, comparatively cheaper than their more convex alternatives.
For the same maturity and yield, bonds with lower coupons have greater convexity. Zero-coupon bonds, which pay their entire cash flows at maturity as opposed to semiannually, have the highest convexity. This is because in general the more dispersed the cash flows in your bond portfolio are, the greater the convexity will be. Thus, one common way to increase convexity is to own bonds with different maturities, drawn from both the short and the long end of the yield curve, in a “barbell strategy.”
Returning to our sport analogy, if we construct our bond portfolio to have as much convexity as possible, given our modified duration and other constraints, then we will have both a strong offense and a strong defense—when we win, we win by more, and when we lose, we lose by less, comparatively speaking. That’s how you win the investing game.

Related
Bonds
Bond Pricing Made Simple
Related

Investor Professor
How Interest Rate Changes Affect the Price of Bonds
Discussion
FREE REPORT

Get your free copy of our special
report analyzing the tech stocks
most likely to outperform the
market.
Dave Gilmer from WA posted over 8 years ago:
Terry Bearden from IN posted over 8 years ago:
Brian Haughey from NY posted over 8 years ago:
Fernando Robles from FL posted over 8 years ago:
You need to log in as a registered AAII user before commenting.
Log InCreate an account