

Related

Financial Planning
The uncertainty of how long a person will live poses negligible risk at younger ages and substantial risk at older ages.
by Bob Collie | October 2015

In a defined-contribution pension arrangement (e.g., a 401(k) plan), individual retirees are subject to both investment risk (i.e., uncertainty about what their investment returns will be) and longevity risk (uncertainty about how long they will live).
This article explores the question: Which of these risks is bigger?
In studies at Russell Investments, we find that the relative size of the risks changes with age. For the typical investment strategy, investment risk is larger at younger retirement ages, but longevity risk becomes larger with time. For example, for an 80-year-old, the uncertainty associated with how long they will live is greater than the uncertainty associated with investment returns. However, the reverse is true at age 50. What’s more, at younger ages, the combined effect of longevity risk and investment risk is not much greater than the effect of investment risk alone.
These findings are relevant to the current debate on the provision of lifetime income to defined-contribution plan retirees. In particular, they may help to clarify the role annuities can play in managing longevity risk.
In a defined-benefit arrangement (e.g., a pension plan), plan participants receive a known income throughout retirement that lasts as long as they do. Therefore, the income they receive is not sensitive to fluctuations in market returns, nor is it affected by uncertainty about the future life span. Thus, in a definted-benefit plan, the retiree is shielded from both market risk and longevity risk.
(There are other risks, however. For example, most defined-benefit arrangements in the U.S. are not linked to the cost of living, so their value can be eroded by inflation. The benefit is also contingent on the continuing ability of the plan to meet its obligations (backed, in the case of private-sector plans, by the Pension Benefit Guaranty Corporation.)
In a defined-contribution arrangement, the plan participant instead has an account balance and must decide how quickly to draw on that money after retirement. This decision is difficult, because the individual does not know how long they will live, or what their investment returns will be.
This analysis explores the size of these two sources of uncertainty. We start with a specific case (a 65-year-old female) and then extend that to the more general case.
Imagine a world in which both longevity and investment returns are known with certainty. We assume that in this hypothetical world, investments return exactly 6% each year, and that a 65-year-old female who retired in 2014 will live for precisely 23.8 more years (which is her average life expectancy as implied by the Society of Actuaries’ RP-2014 table.)
Since we know with certainty, in this hypothetical world, how long income will be required and what the value of $1 invested today will be at every future point, it is fairly straightforward to calculate that a sum of $100,000 would generate annual income of $7,775 a year for this retiree. This figure represents our baseline result.
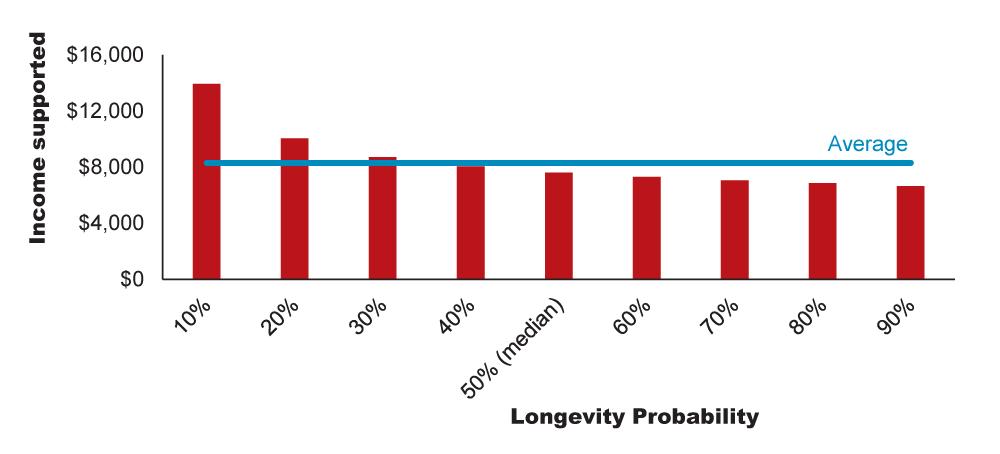
Now imagine a second hypothetical world—which we might call the uncertain-lifespan world—in which investment returns are certain, but longevity is unknown. The average annual income supported in the uncertain-lifespan world would be $8,304, and the median would be $7,616. While the average life span of our retiree in this world is still 23.8 years, there is now a 10% chance that she will live for 9.3 years or less, and hence that $100,000 would be sufficient to generate annual income of $13,944 for life. There is similarly a 10% chance that she will live 35.9 years or longer, in which case the annual income supported would be only $6,648, as is indicated in Figure 1. The latter figure is of more interest in the context of this analysis, since it is an unexpectedly long life (not an unexpectedly short one) that represents a financial threat.
As shown in Figure 1, the downward trend in these amounts is not a straight line. If the retiree outlives her average life expectancy, the cost of funding her lifetime income increases, but the additional payments are a long time in the future so they are fairly small in today’s dollars.
We see that, for the 65-year-old retiree, introducing longevity risk (but not investment risk) reduces the income that is generated (at a 90% probability of being sustained throughout retirement) from $7,775 to $6,648 as shown in Figure 1, a 14% penalty. [There is a 10% chance of the retiree living more than 35.9 years. Hence, if income can be provided for 35.9 years, there is a 90% probability that the income that is generated will last for the whole of their lifetime (in this mortality-uncertain world).]
To put this penalty into more familiar terms, we can compare the uncertain-lifespan world to another hypothetical world, an uncertain-return world. In this world, life spans are certain, but investment returns are not.
We begin with a simple and familiar version of uncertain returns by replacing the 6% fixed return assumption with a normally distributed return. In this uncertain-return world, the time horizon is fixed at 23.8 years. For example, if we assume an annual standard deviation of 10% (standard deviation being a common measure of how far returns will typically vary each year from their long-term average), then the income supported (at a 90% confidence level) would be $5,551, which represents a 29% penalty below the baseline level of $7,775 (Figure 2).
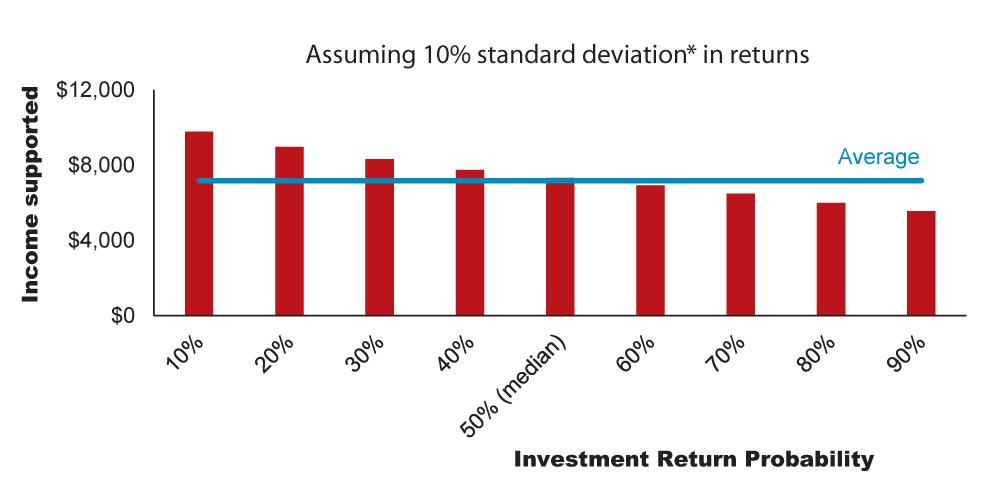
To arrive at a 14% penalty (equal to the penalty in the uncertain-lifespan world), we would need to set the standard deviation of the investments at roughly 5.2%. Hence, in this case longevity risk can be thought of as akin to a standard deviation of 5.2% in the investment portfolio. This is a low level of investment volatility compared to that in most actual portfolios and is roughly what might be expected from a portfolio allocated entirely to fixed-income securities. (Russell’s standard capital market assumptions as of year-end 2014, for example, have an expected time series volatility on aggregate fixed income of 4.6% a year over the next 20 years.)
Thus, the effect of the uncertainty around how long this retiree will live is comparable to the effect of a 5.2% standard deviation in investment returns. Since most investment portfolios have expected volatility that is above this level, we can conclude that longevity risk is smaller than investment risk in this case.
To complete the picture for the 65-year-old female retiree, we can consider a fourth (still hypothetical) world, in which both investment returns and longevity are uncertain.
For example, if we assume a standard deviation of 10% in investment returns, along with an uncertain life span, then the level of income supported (at a 90% probability) falls to $5,209, a 33% penalty below the baseline. This penalty is larger than the 29% penalty associated with investment risk alone, but not massively so. Indeed, the impact of introducing longevity risk is roughly equivalent to increasing the assumed standard deviation of returns from 10% to 11.5%.
In other words, the interaction of longevity and investment risk means that the combined impact of both forms of uncertainty is only a little more than the impact of investment risk alone in this example.
We summarize the results so far in Table 1, adding also the equivalent results for a 65-year-old male retiree and for a male-female (second to die) joint life.
Table 1. Income Generated With 90% Confidence by $100,000 in Four Hypothetical Worlds
| Age at retirement in 2014 = 65 | |||||
|
|
Female | Male | Joint Life | ||
| Certain world | $7,775 (baseline) | $8,142 (baseline) | $7,213 (baseline) | ||
| Uncertain life span | $6,648 (–14%) | $6,784 (–17%) | $6,570 (–9%) | ||
|
Uncertain returns (Std Dev = 10%) |
$5,551 (–29%) (or –14% at 5.2% SD) |
$5,891 (–28%) (or –17% at 6.1% SD) |
$5,046 (–30%) |
||
| Uncertain life span and returns |
$5,209 (–33%) (equiv. 11.5% SD) |
$5,422 (–33%) (equiv. 11.9% SD) |
$4,924 (-38%) (equiv. 10.6% SD) |
||
This hypothetical example is for illustration only and is not intended to reflect the return of any actual investment.
Std Dev and SD = standard deviation.
The results above vary significantly at different ages. At younger ages, the majority of longevity risk is concentrated in the distant future. For example, as stated previously, while the average life span is 23.8 years, the range of outcomes is 9.3 years in retirement for the shortest decile (bottom 10%) to 35.9 years in retirement for the longest decile (top 90%) for a 65-year-old female. Therefore, the long life is roughly four times longer than the short life. At age 50, that ratio would fall to 2.5 times longer; at age 80, it is 7.5 times. Investment risk, meanwhile, reduces slightly as the time horizon shortens.
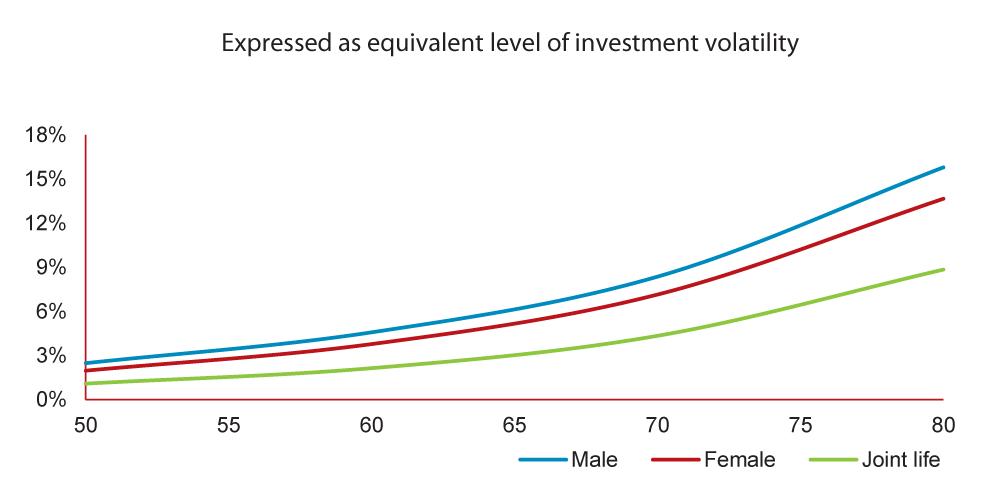
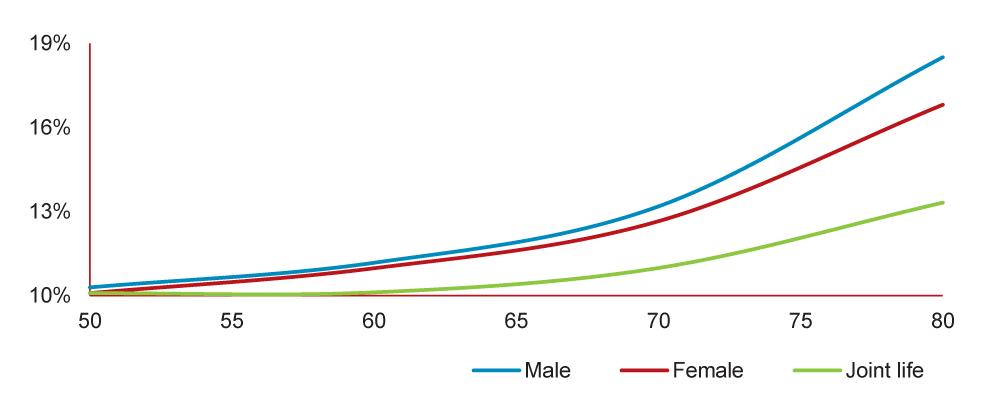
Figure 3 shows the investment volatility that is equivalent to longevity risk at various ages, and Figure 4 shows the investment volatility that is equivalent to the combination of longevity risk and 10% volatility. Both charts are based on the same approach previously discussed.
For a 65-year-old retiree, we concluded that:
Longevity risk is smaller than typical levels of investment risk; and
The interaction of longevity risk and investment risk means that the combined impact of both forms of uncertainty is only a little larger than the impact of investment risk alone.
These conclusions hold even more strongly at younger retirement ages. Indeed, at the left end of the charts (age 50), longevity risk is essentially negligible when set alongside typical levels of investment risk.
However, the importance of longevity risk increases at older ages. For an 80-year-old, the uncertainty associated with how long he or she will live is equivalent to a fairly substantial level of investment risk.
There is currently a great deal of focus on the question of lifetime income for defined-contribution plan retirees: As noted above, the defined-contribution system does not automatically provide a stream of retirement income in the same way the defined-benefit system does. While it is beyond the scope of this article to provide a detailed discussion of the various possible approaches to managing your retirement income, the relative impact of uncertainty in longevity and in investment returns is relevant to this debate. Accordingly, we end with some high-level general observations on this question.
The simplest vehicle available to individuals seeking to manage longevity risk is a fixed annuity contract. This provides a known income for life, in return for payment of an initial premium (with the understanding that payments from annuities are subject to the claims-paying ability of the issuing insurance company.) These annuities are not, however, pure longevity plays: They also represent an investment decision.
Any decision around the purchase of an annuity should therefore be judged not only in terms of the management of longevity risk, but also on its impact on investment strategy. To the extent that investment risk is the dominant risk (and we have argued above that it is, at typical retirement ages), the purchase of an annuity should therefore be thought of as being an investment decision, just as much as it is a longevity-protection decision. Other forms of longevity protection, such as a variable annuity contract, have different implications for investment strategy, which may provide for a better fit to the typical retiree’s needs.
Alternatively, these findings might be taken as leading to the conclusion that for typical retirees, it is better to ignore longevity risk in the first few years of retirement and to address it later. That does not necessarily follow, however. Even though the risk that is being managed concerns mortality experience at advanced ages, steps can be taken to address that risk sooner rather than later.
Even at a younger retirement age, the threat to financial security that arises from uncertainty in longevity is a “right-tail” threat. That is to say, it is the possibility of the retiree living longer than the average life span that may result in financial strain. So it is the right tail—the possibility of outliving average life expectancy—on which the debate should focus. [Editor’s note: Right tail refers to measurements that are in excess of a typical range. They are the outliers that would be marked on the right-hand side of a distribution chart that plots measurements from smallest to largest, or in this case, from shortest life expectancy to longest life expectancy.]
Managing this right tail becomes more expensive as more time passes. To state the obvious: A lifetime annuity payable from age 85 is a considerably more expensive purchase at age 85 than at age 65. Yet, even at age 65, it is this right tail with which we are concerned.
It is this line of thinking that has led to a growing interest in deferred annuities as a means of addressing longevity risk early in retirement, when it can be done more cost effectively. In 2014, the U.S. Treasury and the Department of Labor issued regulations that made qualifying longevity annuity contracts (or QLACs) more accessible to defined-contribution plan participants. These types of contracts provide lifetime income starting at an advanced age, such as 80 or 85.
Appendix: A More Complex Model of Investment Risk
In order to put longevity risk into terms that can be widely understood, we used a very simple form of investment risk above. More sophisticated models of investment risk allow for fat tails in the distribution of outcomes (ones in which extreme outcomes occur with greater frequency than they would under a normal distribution with the same standard deviation), as well as variation over time in the volatility of asset returns and in the correlations between asset returns, and so on. Using Russell’s standard capital market assumption model (as of year-end 2014), we can extend the above analysis.
For example, if we assume a 50%/50% allocation between global equities and broad market fixed income, the level of income that would be generated in the uncertain-return world at the 90% probability level would be $5,295 for the 65-year-old female retiree (assuming a fixed term of 23.8 years). The median level of income supported would be $7,003, and the average would be $6,748.
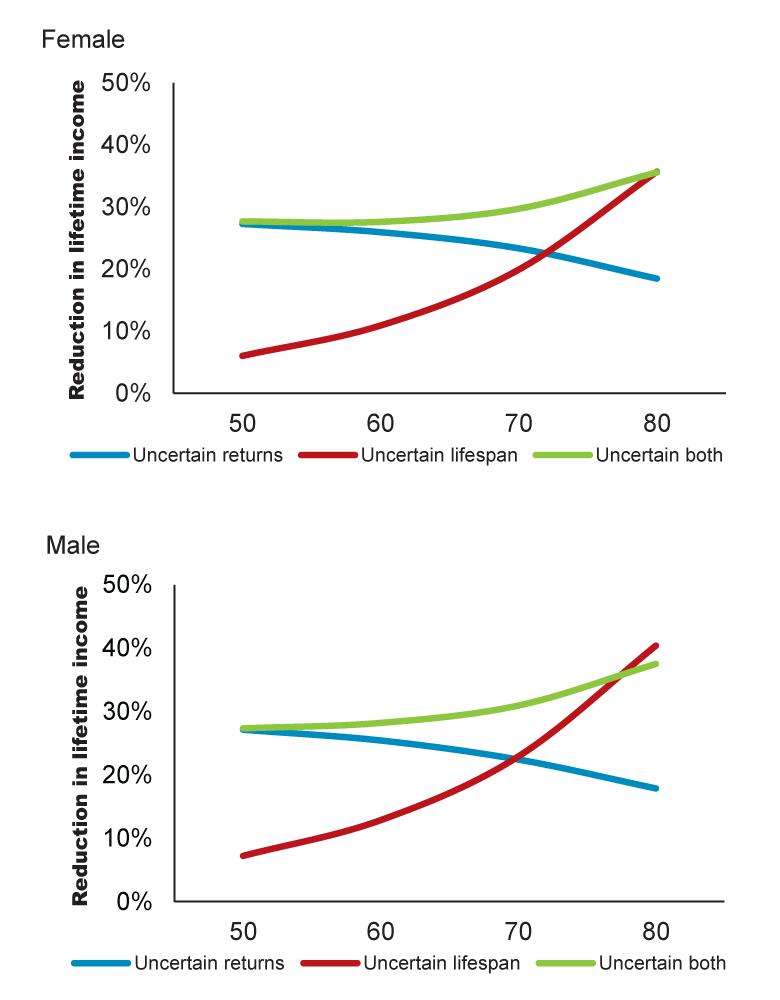
The Figure 5 charts show how the impact of uncertainty changes with age.
The percentage shown is the shortfall of the income generated at the 90% probability level below the income generated at the 50% probability level. To ensure a like-for-like comparison at each age, the fixed return assumed in the uncertain-lifespan world was set so as to produce the same median level of income as was generated in the uncertain-return world; this fixed return varied from 3.3% to 5.3%, depending on the age of the retiree.
Under this model, the age at which longevity risk overtakes investment risk is around age 70 for both the female retiree and the male retiree. The overall pattern of the results is consistent with the findings of the simpler model, in that longevity risk appears relatively insignificant at younger ages but increases materially once retirees reach their 70s.
Financial Planning

Financial Planning
Financial Planning

Steve S from New Jersey posted over 10 years ago:
Leon Granowitz from MA posted over 10 years ago:
Donald Myers from AZ posted over 10 years ago:
S. M. Mclaughlin from IL posted over 10 years ago:
John Knox from AL posted over 10 years ago:
William Sanders from WA posted over 10 years ago:
Alan Curtis from OH posted over 10 years ago:
James Van Trump from DE posted over 9 years ago:
You need to log in as a registered AAII user before commenting.
Log InCreate an account