




There are many options for keeping track of your investments: manual record keeping, Excel spreadsheets, online services and stand-alone software. Investment tracking solutions such as Quicken are well-known and offer easy integration with their other products, while online-only portfolio tracking websites such as Macroaxis offer slick interfaces with analytics. But each of those solutions has it weaknesses: for Quicken, nowadays, reliability has become a question (see our review), while for Macroaxis (see our Best of Web review), you need to trust the website to keep your information secure on their server.
If you are looking for an alternative to Quicken that is more secure than a website, Investment Account Manager 2, developed by Quant IX Software, may be of interest to you. The product is offered in two versions: a retail version for individual investors and a more powerful version for professional asset managers. We focus on the retail version, which is more appropriate for most CI readers. Additionally, while the product can work with a variety of asset types such as bonds or derivatives, we focus here on stocks.
The cost starts at $79 and goes up from there, although AAII members get $20 off. Look for Special Offers in the Member Benefits section of the AAII website for the coupon. Pricing details are given toward the end of this article. For AAII members who subscribe to Stock Investor Pro, there is an additional perk: You do not have to sign up for QuoteMedia as a data feed since you can select SI Pro as your data source.
Investment Account Manager is available for sale directly from their website at www.investmentaccountmanager.com in the Quant IX store.
Home Page/Dashboard
After opening the program and bypassing any initial notifications such as new updates and portfolio alerts, you arrive at the home page, or what can colloquially be called a dashboard (Figure 1). This tab contains “at a glance” information such as portfolio and benchmark returns as well as current holdings. A default portfolio is highlighted, although you can see all the portfolios that are available, and you can easily switch from portfolio to portfolio by checking the box next to the portfolio name. You cannot select multiple portfolios to get a comprehensive view of all your assets. While this feature would not be strictly necessary, it would still be nice to have. Users can still look through the portfolios individually, which is a common practice.
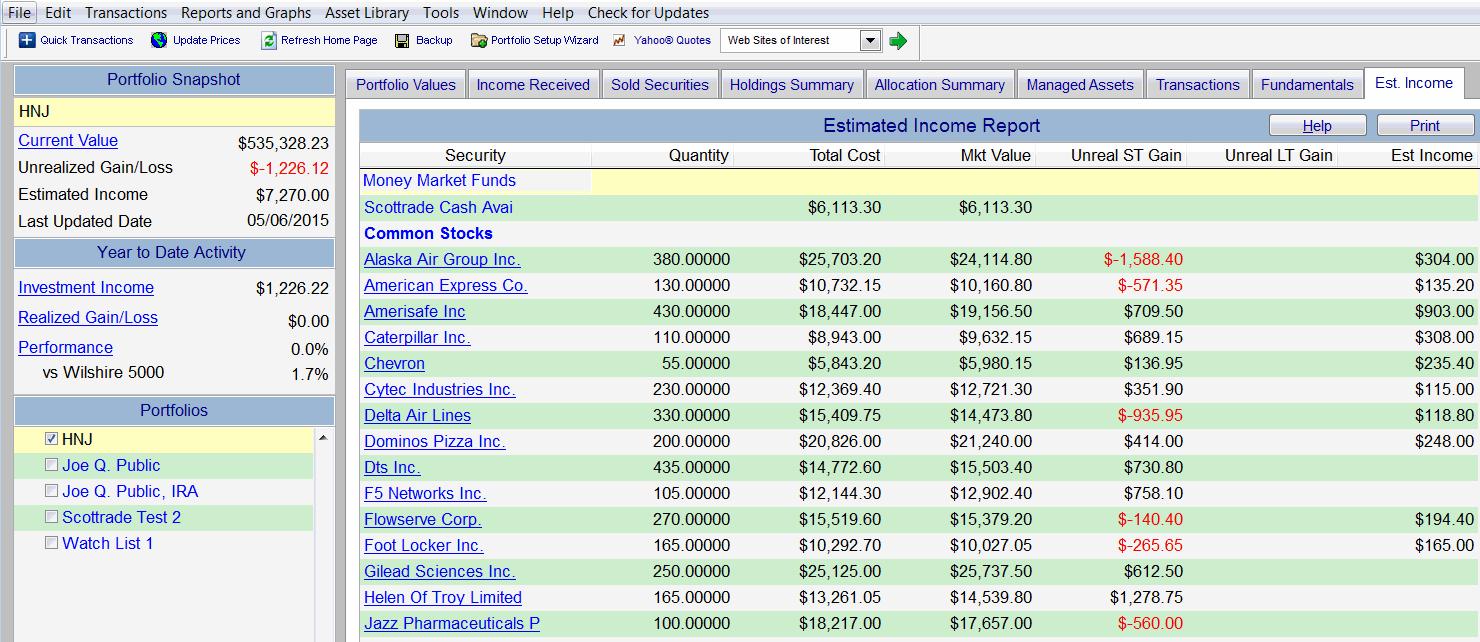
The portfolio snapshot gives users a quick look at the selected portfolio’s value, any unrealized gain or loss and estimated income. It also includes the date of the last update, which is a nice reminder if you tend to forget to update.
The home page also shows your holdings and supporting data for a selected portfolio. Seeing this information immediately, as well as the high-level view of the portfolio, gives access to commonly sought out information without having to dig deep to find it.
While only year-to-date activity is shown, you can run a report to see monthly and quarterly data if you choose to do so. You can change the benchmark to an index or even an ETF. For subscribers to either of AAII’s stock portfolios (Dividend Investing and Stock Superstars Report), being able to use the iShares Dow Jones U.S. ETF (IYY) as a benchmark is particularly important (this is the bogey we use for both portfolios). New tickers can be added in the Asset Library, and users can then select that ticker to be the benchmark under File and then Preferences. You will find the option under the home page tab.
Users cannot select different benchmarks for different portfolios on the home page. Two possible solutions for this are to switch the benchmark as you change the portfolio selected or to run a report with all the applicable benchmarks for your portfolios.
If needed, there is an option for manually entering transactions, though the download link from your broker (if supported) would probably be preferable for most users.
The holdings table can be easily exported with a single button, which is located just below the main tabs. Select “export to text file” to create a CSV file that can be used in Excel. The file should then be opened in Excel as a text file. When the option presents itself, the user should select that the data is comma-separated. The file will then open with five fields of data for each holding. Currently there are no headings in the exported data when opened, though users can easily add them. Quant IX told us they are working on adding column headings for this export for a future update.
Selecting “export to Google CSV file” allows users to easily upload their portfolio to Google Docs and create a real-time portfolio tracker. There is also an option for exporting to Manifest Investing, which requires a subscription.
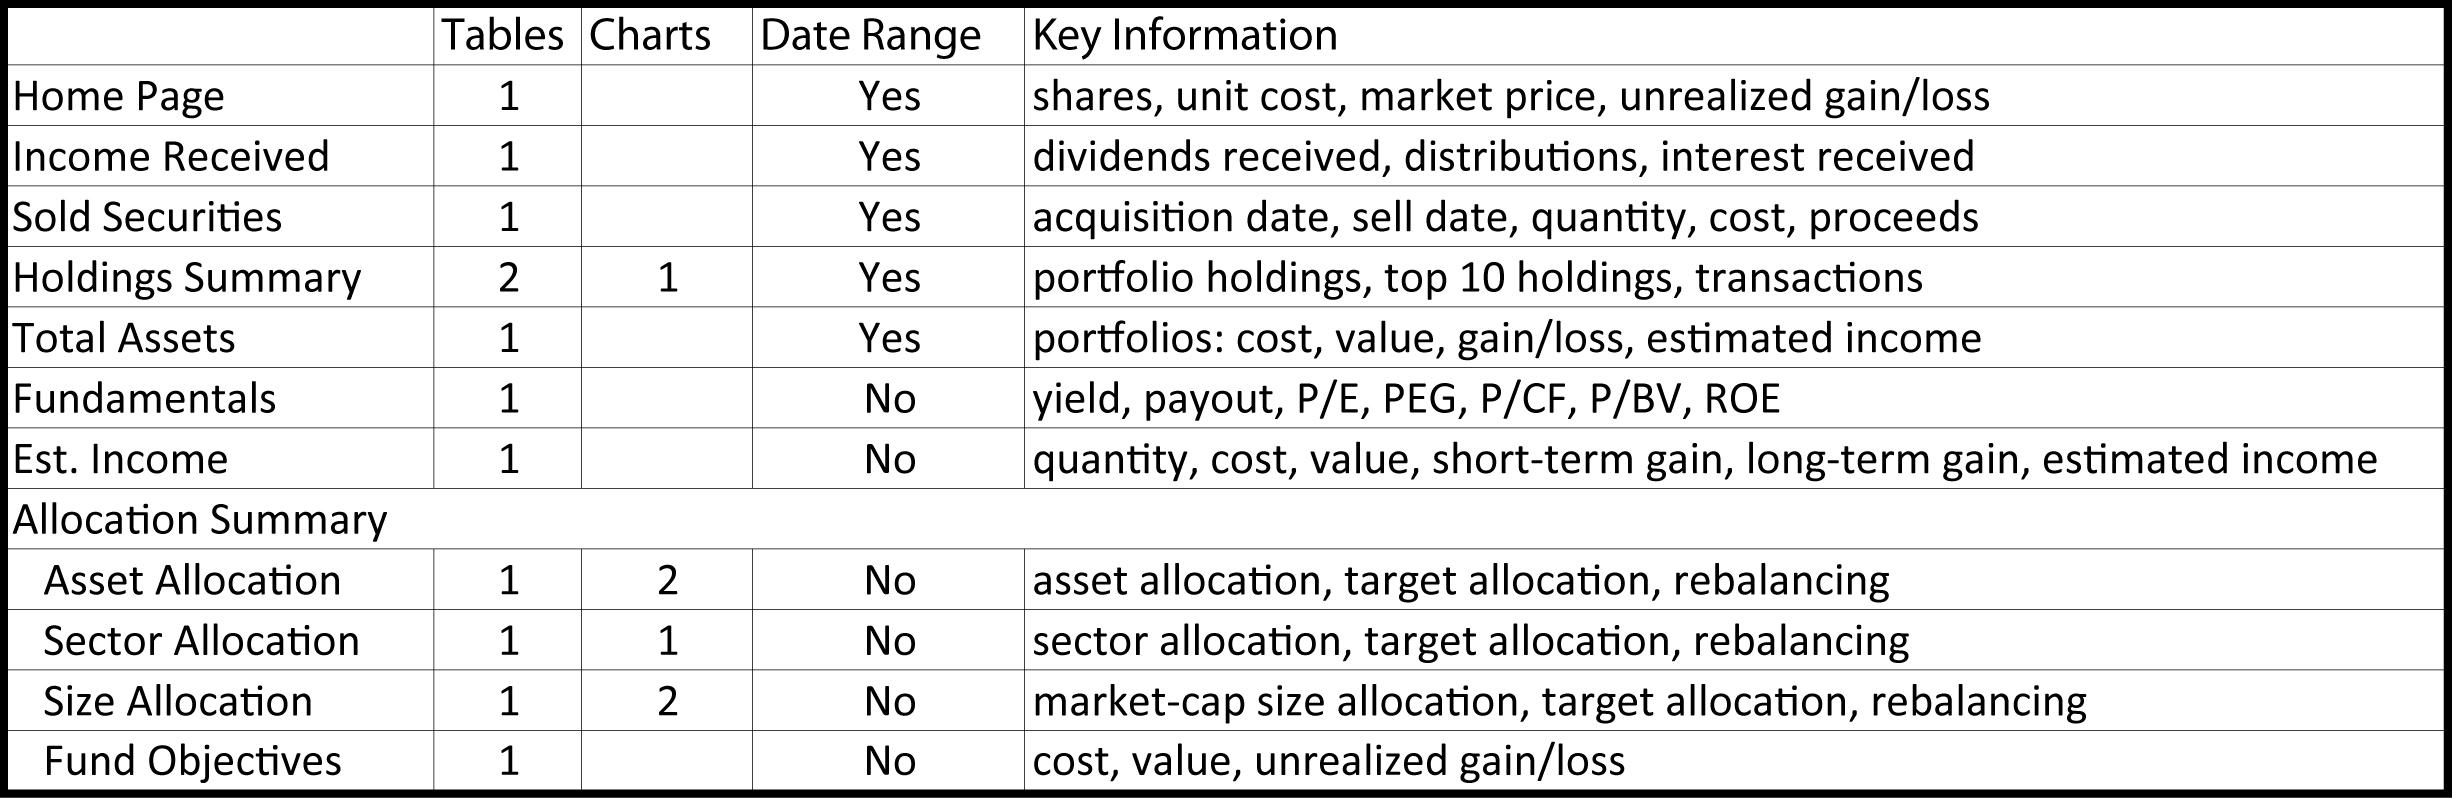
The tabs of note running above the main portfolio holdings list on the home page are Income Received, Sold Securities, Holdings Summary, Managed Assets, Fundamentals and Est. Income. Table 1 summarizes what you’ll find in each of these sections.
Income Received
Keeping tracking of dividends and interest, both taxable and nontaxable, while not particularly complicated, can be a painstaking chore. Whether it is unreliable results from a download, as some users complained about from our Quicken review, or having to manually download the information from each account and format it in a way that makes sense, users are looking for simpler solutions. Investment Account Manager makes it almost effortless with their reliable download from your brokerage account in the Income Received tab. The tab is found at the top next to the Portfolio Values tab. The table breaks down the income received into taxable interest and dividends and then nontaxable interest and dividends along with short- and long-term distributions. Additionally, a drop-down menu allows users to change the period to a date range up to 12 months prior (assuming the software has that data). The date range selected is displayed at the top of the table so there is no confusion what data you are looking at. Totals for the view you have selected are displayed at the bottom. For most investors, the bulk of the information will be in the taxable dividends and total columns, which means that three-quarters of the table will be showing no information. It’s not that there is any missing information, it’s just that the other types of distributions are not very common.
Still, it is very useful for investors to be able to download data from their broker via the transactions drop-down menu at the top and instantly have a view of dividends received by holding over various periods over the last 12 months. The date range options on this and other tabs are focused on the current year or the most recent 12 months. See the reporting section for details on creating custom data ranges.
Sold Securities
The Sold Securities tab is meant to track stocks you have sold, whether the holding period was short-term (less than one year) or long-term (more than one year). As with most of the tabs, the date range is displayed at the top of the table and can be changed using the drop-down menu.
It is possible that the complete history of your sells will not be shown in this list. The reason is that cost basis is required by Investment Account Manager, but is often not provided by brokers in the open financial exchange (OFX) file. While not all financial institutions offer financial history data via OFX, there is a workaround provided by Quant IX. You can create an Excel file with the date and cost basis of your holdings and upload it to Investment Account Manager. Once the software has the cost basis for all securities in its history, then Sold Securities (and Transactions) should be populated with sells.
Most brokers, though there are exceptions, will only allow 90 days of transaction data to be downloaded. In order to recreate an accurate history if your account is more than 90 days old, you will have to manually enter the historical transactions, or upload via a CSV-compatible file. You will also have to remember to download transactions on a monthly basis to avoid having to recreate recent history.
Holdings Summary
The Holdings Summary tab offers a more detailed and varied look at the selected portfolio. Holdings are identified in the first table by weighting in the portfolio; market price and value are offered as well. A second box displays the top 10 holdings in the portfolio.
A table at the bottom of the page shows transactions in the portfolio for the selected date range. This will be populated automatically if data has been downloaded from your brokerage account, but you also have the choice of manually entering a transaction if necessary. A date range can be selected, but keep in mind that the maximum is 12 months and custom ranges need to be selected in reporting. You can find specific transactions by using a drop-down search menu. Users can search by name, date, amount or by using other criteria. You can find the same information in the Transactions tab, so that tab is not broken out separately here for discussion.
There is also a print button for the holdings table and the transactions activity for those who want a hard copy.
Total/Managed Assets
An overview of all the portfolios you manage is useful in tracking all of your assets. Knowing the total gain, loss and total income allows you to see if a particular portfolio or strategy is struggling or outperforming and make adjustments as appropriate. Total cost, market value, unrealized gain/loss and percent gain/loss are all immediate concerns of investors and the Managed Assets tab offers a quick view by portfolio. Additional information is also available, such as estimated income and yield. As with most tabs, the date range is flexible up to 12 months.
On this tab, as well as the other tabs, a help button takes you directly to information available for that tab, instead of having to search for the applicable topic from the home page. That is a nice touch, and one I’m sure users appreciate.
Fundamentals
The Fundamentals tab allows users to be able to glance at key Financial Metrics for a company. The data is preselected and not changeable, but it does cover important statistics such as price-earnings ratio, PEG ratio, price-to-book-value ratio and more. If these metrics are useful to you, then this page could be interesting. The data is sortable alphabetically in ascending or descending order. The period covered for the data is not identified, which means users should be extra careful when relying on it.
This tab can be used to create watchlists of stocks to track and research for possible action. Just keep in mind that the data provided is very limited and users are not allowed much flexibility here.
Estimated Income
The Estimated Incomes (Est. Income) tab displays the portfolio in alphabetical order with holdings size, cost, market value and unrealized short-term or long-term gains. There is no ability to change the date range. The estimated income number shows how much income would be produced at the current yield for the next 12 months. This is a useful view to get a picture of income that could be received.
Allocation Summary
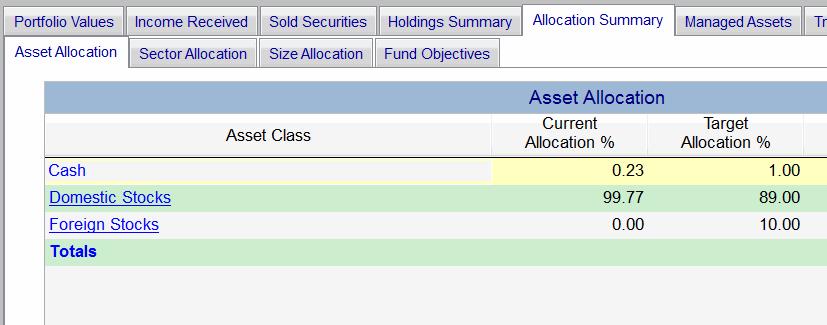
The Allocation Summary sections offers several tabs for user viewing: Asset Allocation, Sector Allocation, Size Allocation and Fund Objectives. The default tab shown first is the Asset Allocation tab (Figure 2).
Asset Allocation
In the Asset Allocation tab, users can see the breakdown of holdings for a selected portfolio between cash, domestic stocks and foreign stocks. The weighting, or allocation, is provided as well as a target allocation that a user might have in mind. A third field identifies the numerical variance, if any, between the target allocation for a category and the actual allocation. For members who have certain targets or limits in mind when balancing between domestic and foreign stocks, this could be quite useful.
The target allocations are adjustable by going to the file drop-down menu, add/edit portfolio and then selecting portfolio targets. Stock Investor Pro users can also switch the data source to SI Pro from QuoteMedia here.
There are two pie charts shown below the table that graphically display the information listed in the table.
Sector Allocation
The Sector Allocation tab shows the breakdown of the selected portfolio’s holdings by sector, including target allocations and variance. This is particularly useful for those looking to control over- or under-allocation in sectors. Similar information can be found in Morningstar’s premium section if you are a subscriber.
As in the Asset Allocation tab, you can adjust the target allocations to match your own personal preferences. And, again, there is a chart displaying the target allocations and current allocations. However, the sector allocations are shown in a bar chart, which I found to be better for comparing target and current allocations than the pie charts were in the Asset Allocation tab. Unfortunately, users are not able to switch chart styles on these tabs.
Size Allocation
The Size Allocation tab shows the breakdown between small-, medium- and large-cap stocks. This is determined by market capitalization, which can be adjusted in Preferences. Specifically, you can change the definition of the small-cap and large-cap groups, and the medium-cap group is calculated based on other two numbers. This is important to investors if they are trying to track a particular benchmark or if they have their own personal preferences when it comes to market-cap ranges.
Stylistically, this page is very similar to the Asset Allocation tab, including the two pie charts at the bottom. As mentioned previously, you cannot change the chart style.
Fund Objectives
If you own mutual funds, the Fund Objectives tab combines funds with similar fund objectives (top 10 only) and provides the totals—for example, by market cap or emerging markets.
Data provided includes the total cost, market value, unrealized gain or loss and more.
This tab could be very helpful for fund investors who wish to take an overall look at their portfolio to see if they are overweight or underweight in any objectives.
Reporting
While Investment Account Manager is hard-coded in places, which limits user flexibility, the reporting capabilities have a great deal of flexibility. The reports range from portfolio performance to a fees analysis to an income report, among many more (Figure 3). They can be generated from the Reports and Graphs selection in the main menu at the top of the program. There are more than 50 reports available to choose from, with the appraisal report being the most popular. The appraisal report is a comprehensive view of current holdings for a selected portfolio with cost, value, weighting and more information available. The inputs required vary but are not overwhelming for regular users.

You can run reports with custom date ranges by adding dates to the Asset Library. For example, if you wanted to run a report from December 31, 2013, through May 8, 2015, you would have to add 12/31/2013 to the asset library. That would bring in the securities prices as of that date and you would then be able to run reports using that custom date range. This is a tremendously valuable tool and is the most powerful part of the program. Not everyone will need this level of customization, but it is nice to know it is possible. Users can also select different asset types such as fixed-income products, exchange-traded funds or even options. Selecting the “current only” option limits calculation to current holdings, whereas selecting “all activity” will calculate the report including all data available.
Updating the Software
Users are prompted to update their software if an update is available; however, keep in mind that there are two parts to the update. Also, you only receive updates if you are within the first 12 months of having bought the software or if you have paid for a support package.
Assuming you are eligible to receive updates, the first part of the process is to update the software by clicking yes to the “update now” button, which will download the appropriate files. You then need to go to the Start menu on your computer and find the Investment Account Manager files. Selecting the file titled IAM2 will update the program with the downloaded files. You can quickly find Investment Account Manager by doing a search.
Pricing
You can purchase Investment Account Manager at their website. The cost is $79 without the QuoteMedia data feed, and the QuoteMedia data feed is not necessary if you have SI Pro or if you focus only on mutual funds. If you do not have another data source, you can buy 12 months of data from QuoteMedia along with the software for $109.
As mentioned above, AAII members get $20 off. Look under Special Offers in the Member Benefits section of the AAII website for a discount code, which is input into the discount coupon code field when checking out with the software purchase at the Investment Account Manager website. That means the actual price to members is either $59 (without the data feed) or $80 (with the data feed).
All purchasers receive support and free upgrades for 12 months. If you wish to try before you buy, you can test the program by downloading a free 30-day working version of the software, which includes tutorials and a variety of sample data.
There is also the option of, later on, purchasing one year of technical support for $59 without QuoteMedia or $89 with QuoteMedia. This package provides access not only to support from the company but also regular updates to the software. You would not be able to use another $20 discount for this service, however.
Comparison to Quicken
While Quicken offers an integrated package that helps investors manage their investments to make better buy/sell decisions and track their investments for tax time, it may not suit all investors. In fact, Quant IX says that they get a fair amount of investors from Quicken because their investment tools are not comprehensive enough. Quicken can download brokerage account information similar to Investment Account Manager, and Quicken’s partnership with Morningstar enhanced their product.
The one big difference between the two products that is that Quicken is not an investment-focused product, whereas Investment Account Manager is. Less common investment-related activities that may be problematic in Quicken are easily taken care of with Investment Account Manager. As I mentioned in the Quicken Premier Review, actions like stock splits can confuse Quicken’s software, resulting in inaccurate data. I had no such concern when using Quant IX’s software.
Conclusion
As a tool for those who are not particularly proficient at using Microsoft Excel for portfolio-related tasks, I think that Investment Account Manager 2 is a perfectly acceptable solution. It provides the basic information that many investors look for in a simple portfolio management package without containing an overwhelming amount of superfluous information. Do not, however, underestimate the software, as there are some powerful capabilities within it should you need them.
The company is currently working on version 3 of their software, which is coming toward the end of 2015 or early 2016. It is expected to offer more flexibility for retail investors, similar to the professional version of the software.
While the team at Quant IX is small, they are very responsive, which is a nice contrast to the recent user experience with Quicken. While working with the program, I had the opportunity to speak with the staff and ask questions. I was pleasantly surprised to hear, during follow-up calls, that suggestions I had previously made were already incorporated into the software. Whether or not their pace of work was hastened by the fact that I was reviewing the software, their regular release of program updates gives me the indication that they are constantly improving the software.
Discussion
FREE REPORT

Carol Clemens from OK posted over 11 years ago:
David Phillips from AL posted over 11 years ago:
Jim from FL posted over 11 years ago:
Robert from AR posted over 11 years ago:
Herbert Kuntz from CA posted over 11 years ago:
Jerry Lund from UT posted over 11 years ago:
You need to log in as a registered AAII user before commenting.
Log InCreate an account